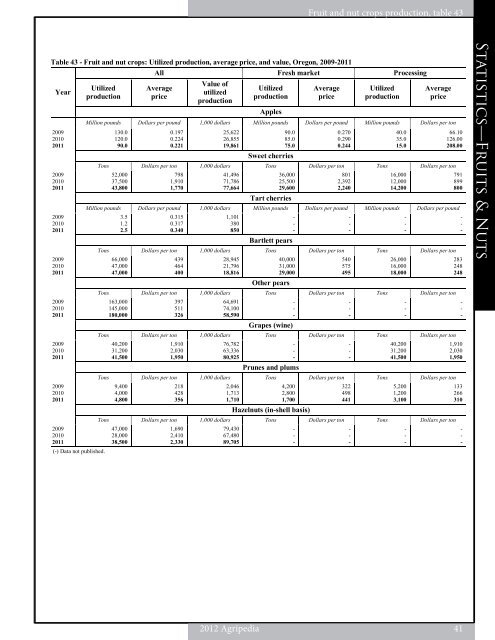
Fruit and nut crops production, table 43 Table 43 - Fruit and nut crops: Utilized production, average price, and value, <strong>Oregon</strong>, 2009-2011 All Fresh market Processing Year 2009 2010 2011 2009 2010 2011 2009 2010 2011 2009 2010 2011 2009 2010 2011 2009 2010 2011 2009 2010 2011 2009 2010 2011 Utilized production (-) Data not published. Average price Value of utilized production Utilized production Apples Average price Utilized production Average price Million pounds Dollars per pound 1,000 dollars Million pounds Dollars per pound Million pounds Dollars per ton 130.0 120.0 90.0 0.197 0.224 0.221 25,622 26,855 19,861 90.0 85.0 75.0 Sweet cherries Tons Dollars per ton 1,000 dollars Tons Dollars per ton Tons Dollars per ton 52,000 37,500 43,800 798 1,910 1,770 41,496 71,786 77,664 36,000 25,500 29,600 Tart cherries 0.270 0.290 0.244 801 2,392 2,240 40.0 35.0 15.0 16,000 12,000 14,200 Million pounds Dollars per pound 1,000 dollars Million pounds Dollars per pound Million pounds Dollars per pound 3.5 1.2 2.5 0.315 0.317 0.340 1,101 380 850 Bartlett pears Tons Dollars per ton 1,000 dollars Tons Dollars per ton Tons Dollars per ton 66,000 47,000 47,000 439 464 400 28,945 21,796 18,816 - - - 40,000 31,000 29,000 Other pears 66.10 126.00 208.00 <strong>2012</strong> Agripedia 41 - - - 540 575 495 - - - 26,000 16,000 18,000 Tons Dollars per ton 1,000 dollars Tons Dollars per ton Tons Dollars per ton 163,000 145,000 180,000 397 511 326 64,691 74,100 58,590 Grapes (wine) Tons Dollars per ton 1,000 dollars Tons Dollars per ton Tons Dollars per ton 40,200 31,200 41,500 1,910 2,030 1,950 76,782 63,336 80,925 - - - - - - Prunes and plums - - - - - - - - - 40,200 31,200 41,500 Tons Dollars per ton 1,000 dollars Tons Dollars per ton Tons Dollars per ton 9,400 4,000 4,800 218 428 356 2,046 1,713 1,710 4,200 2,800 1,700 Hazelnuts (in-shell basis) Tons Dollars per ton 1,000 dollars Tons Dollars per ton Tons Dollars per ton 47,000 28,000 38,500 1,690 2,410 2,330 79,430 67,480 89,705 - - - 322 498 441 - - - 5,200 1,200 3,100 - - - 791 899 800 - - - 283 248 248 - - - 1,910 2,030 1,950 133 266 310 - - - Regulations—Fruits Statistics—Fruits & & Nuts
Regulations—Fruits Statistics—Fruits & & Nuts Tree fruit crops production, table 44 Table 44 - Tree fruit crops: Production, by area, <strong>Oregon</strong>, 2008-2011 <strong>Oregon</strong> <strong>State</strong> University estimates 1 2008 2009 2010 2011 2008 2009 2010 2011 2008 2009 2010 2011 2008 2009 2010 2011 2008 2009 2010 2011 2008 2009 2010 2011 2008 2009 2010 2011 Year Apples Sweet cherries Tart cherries 42 <strong>2012</strong> Agripedia Pears Bartlett Asian Winter Boxes Tons Tons Tons Tons Tons 595,285 472,755 434,575 391,445 330 275 330 300 12,500 7,000 2,850 2,830 2,349,822 2,409,696 2,341,950 2,207,000 28,500 3,500 2,500 2,500 32,514 30,775 31,245 30,126 3,018,951 2,924,001 2,813,450 2,634,201 2,434 2,949 2,771 2,946 - - - - 53 263 210 143 22,652 53,385 37,613 42,578 805 1,625 1,200 1,258 22 36 36 40 25,966 58,258 41,830 46,965 Willamette Valley 693 700 493 912 Coastal - - - - Southwestern - - - - North Central - - - - Eastern - - - - South Central - - - - <strong>State</strong> total 2 1 Areas are as defined by <strong>Oregon</strong> <strong>State</strong> University. 2 <strong>Oregon</strong> <strong>State</strong> University <strong>State</strong> level estimates may differ from official NASS estimates. Source: <strong>Oregon</strong> Agricultural <strong>Information</strong> Network, <strong>Oregon</strong> <strong>State</strong> University, Web site: http://oain.oregonstate.edu. 693 700 493 912 2,218 2,239 1,969 2,039 - - - - 10,927 9,427 4,419 4,427 47,020 47,330 46,690 38,250 - - - - - - - - 60,165 58,996 53,078 44,716 Table 45 - Processed utilization: Apples and sweet cherries, <strong>Oregon</strong>, 2009-2011 Processed utilization Year 1 Canned Quantity Price Juice and cider Quantity Price Brined Quantity Price Apples Other Quantity Price 2009 2010 2011 2009 2010 2011 1 Fresh equivalent basis. 462 471 213 193 - - - - 289 270 101 70 616 616 616 280 - - - - - - - - 1,367 1,357 930 543 344 348 336 348 - - - - 55,146 57,274 36,561 28,889 113,820 133,018 123,750 116,320 - - - - 20 20 20 20 169,330 190,660 160,667 145,577 Total processed Tons Dollars per ton Tons Dollars per ton Tons Dollars per ton Tons Dollars per ton Tons - - - - - - 7,100 9,000 3,000 37.00 105.00 170.00 - - - Sweet cherries Tons Dollars per ton Tons Dollars per ton Tons Dollars per ton Tons Dollars per ton Tons 2,000 700 1,450 850.00 995.00 1,100.00 - - - - - - 13,000 10,200 10,500 - - - 800.00 910.00 750.00 12,900 8,500 4,500 1,000 1,100 2,250 - - - 560.00 737.00 840.00 20,000 17,500 7,500 16,000 12,000 14,200
- Page 2 and 3: OregOn Agriculture Oregon Agricultu
- Page 4 and 5: Oregon Agriculture & Fisheries Stat
- Page 6 and 7: Vineyards and wineries overview ...
- Page 8 and 9: Grower Assisted Inspection Program
- Page 10 and 11: 2011-2012 Oregon Agriculture & Fish
- Page 12 and 13: Table 1 - Crop production summary,
- Page 14 and 15: Exports: Top Estimated destinations
- Page 16 and 17: Per capita consumption, table 7 Tab
- Page 18 and 19: Hired workers by region, table 8 Ta
- Page 20 and 21: Crop production rankings, table 10
- Page 22 and 23: Table 12 - Oregon historical highli
- Page 24 and 25: Table 14 - Cash receipts: Farm mark
- Page 26 and 27: Prices paid by farmers, table 16 Ta
- Page 28 and 29: Horticulture and specialty products
- Page 30 and 31: Floriculture: Flats, Floriculture:
- Page 32 and 33: Hay production was high in 2011 whi
- Page 34 and 35: Table 25 - All wheat: Acreage, yiel
- Page 36 and 37: Table 27 - Spring wheat, all practi
- Page 38 and 39: Barley: By county, table 29 Table 2
- Page 40 and 41: Table 31 - Hay: Acreage, yield, and
- Page 42 and 43: Table 33 - Alfalfa hay: Acreage, yi
- Page 44 and 45: Table 35 - All potatoes: Acreage, y
- Page 46 and 47: Table 37 - Potatoes: Stocks, Oregon
- Page 48 and 49: Alfalfa, clover, and grass Peppermi
- Page 52 and 53: Million pounds 200 180 160 140 120
- Page 54 and 55: Tons 50,000 45,000 40,000 35,000 30
- Page 56 and 57: Oregon wine grape production rose 3
- Page 58 and 59: Overall 2011 berry production incre
- Page 60 and 61: Berry crops: By county, table 60 Ta
- Page 62 and 63: Table 61 - Strawberries: Acreage, y
- Page 64 and 65: Table 62 - Vegetable crops: Acreage
- Page 66 and 67: Table 65 - Snap beans for processin
- Page 68 and 69: Table 67 - Cold storage holdings: S
- Page 70 and 71: Fertilizer: Material sold or distri
- Page 72 and 73: Table 69 - Value of production: Liv
- Page 74 and 75: Table 72 - Cattle and calves: Inven
- Page 76 and 77: Million pounds 2,500 2,000 1,500 1,
- Page 78 and 79: 1,000 head 30 25 20 15 10 - 5 Hogs:
- Page 80 and 81: Table 84 - All sheep: Inventory, va
- Page 82 and 83: Sheep and lambs: Goats: Inventory,
- Page 84 and 85: Honey, Mink, table 94 95 Table 94 -
- Page 86 and 87: Commercial food fish: Historical, t
- Page 88: ALABAMA 4121 Carmichael Rd. Sterlin
- Page 91 and 92: Regulations Photograph by Jessica H
- Page 93 and 94: Regulations—employment Employing
- Page 95 and 96: Regulations—employment Employment
- Page 97 and 98: Regulations—employment Family and
- Page 99 and 100: Regulations—employment Minimum wa
- Page 101 and 102:
Regulations—employment Recruiting
- Page 103 and 104:
Regulations—employment Social Sec
- Page 105 and 106:
Regulations—employment Workers’
- Page 107 and 108:
Regulations—business Bird, predat
- Page 109 and 110:
Regulations—business Energy and a
- Page 111 and 112:
Regulations—business Exclusive fa
- Page 113 and 114:
Regulations—business Farm scales
- Page 115 and 116:
Regulations—business Fertilizers
- Page 117 and 118:
Regulations—business Grants and f
- Page 119 and 120:
Regulations—business Oregon Centu
- Page 121 and 122:
Regulations—business Oregon’s r
- Page 123 and 124:
Regulations—business Specialty Cr
- Page 125 and 126:
Regulations—livestock Caged Layin
- Page 127 and 128:
Regulations—livestock Confined An
- Page 129 and 130:
Regulations—livestock Importation
- Page 131 and 132:
Regulations—livestock Interstate
- Page 133 and 134:
Regulations—marketing Dairy produ
- Page 135 and 136:
Regulations—marketing Field inspe
- Page 137 and 138:
Regulations—marketing Good Agricu
- Page 139 and 140:
Regulations—marketing Organic Cos
- Page 141 and 142:
Regulations—marketing Weed-Free F
- Page 143 and 144:
Regulations—plants Imported firew
- Page 145 and 146:
Regulations—plants Protected nati
- Page 147 and 148:
Regulations—taxes Income tax with
- Page 149 and 150:
Regulations—taxes Self-employment
- Page 151 and 152:
Regulations—taxes Unemployment ta
- Page 153 and 154:
Regulations—Waste Composting wast
- Page 155 and 156:
Regulations—Waste Federal hazardo
- Page 157 and 158:
Regulations—Waste Pesticide use,
- Page 159 and 160:
Regulations—Waste Waste tire usag
- Page 161 and 162:
Regulations—Water Fish passage at
- Page 163 and 164:
Regulations—Water Groundwater $75
- Page 165 and 166:
Regulations—Water Water rights wh
- Page 167 and 168:
Regulations—Worker safety Agricul
- Page 169 and 170:
Regulations—Worker safety Field s
- Page 171 and 172:
Regulations—Worker safety Worker
- Page 173 and 174:
Regulations—Worker safety Worker
- Page 175 and 176:
Regulations—Worker safety Worker
- Page 177 and 178:
Regulations—Worker safety Worker
- Page 179 and 180:
Directory 170 2012 Agripedia Photog
- Page 181 and 182:
Directory—Ag organizations Americ
- Page 183 and 184:
Directory—Ag organizations Farm B
- Page 185 and 186:
Directory—Ag organizations Klamat
- Page 187 and 188:
Directory—Ag organizations Oregon
- Page 189 and 190:
Directory—Ag organizations Oregon
- Page 191 and 192:
Directory—Ag organizations Oregon
- Page 193 and 194:
Directory—Ag organizations Wallow
- Page 195 and 196:
Directory—Federal government Agri
- Page 197 and 198:
Directory—Federal government Labo
- Page 199 and 200:
Directory—State government Agricu
- Page 201 and 202:
Directory—State government Energy
- Page 203 and 204:
Directory—State government Occupa
- Page 205 and 206:
Directory—State government Oregon
- Page 207 and 208:
Directory—State government Soil &
- Page 210 and 211:
4-H Operating or riding on machiner
- Page 212 and 213:
Climate Environmental and Energy St
- Page 214 and 215:
FFA Organization National .........
- Page 216 and 217:
Material Safety Data Sheets Oregon
- Page 218 and 219:
Oregon Thoroughbred Owners & Breede
- Page 220 and 221:
Tree fruit Home Orchard Society ...