EXAM P SAMPLE SOLUTIONS
EXAM P SAMPLE SOLUTIONS
EXAM P SAMPLE SOLUTIONS

You also want an ePaper? Increase the reach of your titles
YUMPU automatically turns print PDFs into web optimized ePapers that Google loves.
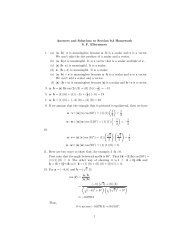
92. Solution: B<br />
Let X and Y denote the two bids. Then the graph below illustrates the region over which<br />
X and Y differ by less than 20:<br />
Based on the graph and the uniform distribution:<br />
1<br />
− ⋅<br />
Shaded Region Area<br />
Pr 20<br />
2<br />
⎣⎡ X − Y < ⎤ ⎦ = = 2 2<br />
200<br />
( 2200 − 2000)<br />
( )<br />
2<br />
200 2 180<br />
2<br />
180<br />
2<br />
= 1− = 1− 2 ( 0.9) = 0.19<br />
200<br />
More formally (still using symmetry)<br />
Pr ⎡⎣ X − Y < 20⎤ ⎦ = 1−Pr⎡⎣ X −Y ≥20⎤ ⎦ = 1−2Pr[ X −Y ≥20]<br />
2200 x−20<br />
1 2200 1<br />
= 1− 2∫ 1 2<br />
2020 ∫ dydx = −<br />
2000 2 2020 2<br />
200 ∫ 200<br />
x−20<br />
y 2000 dx<br />
2<br />
= 1− 2<br />
200 ∫ 2020<br />
x−20 − 2000<br />
1<br />
dx= 1− 2<br />
200<br />
x−2020<br />
2<br />
⎛180 ⎞<br />
= 1− ⎜ ⎟ = 0.19<br />
⎝200 ⎠<br />
( ) ( )<br />
2200 2 2200<br />
2020<br />
Page 39 of 55<br />
2