Create successful ePaper yourself
Turn your PDF publications into a flip-book with our unique Google optimized e-Paper software.
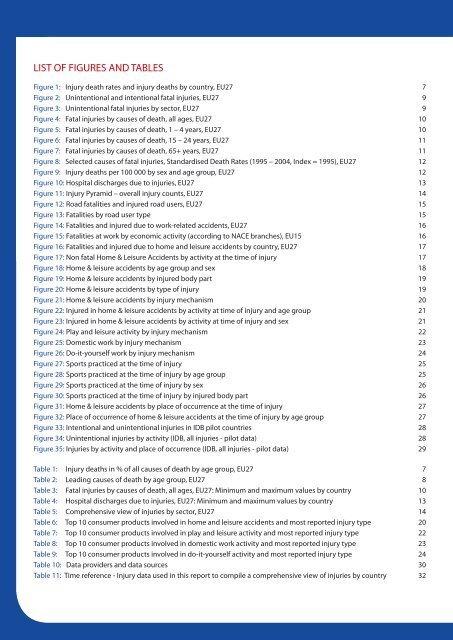
LIST OF FIGURES AND TABLES<br />
Figure 1: Injury death rates and <strong>in</strong>jury deaths by country, EU27 7<br />
Figure 2: Un<strong>in</strong>tentional and <strong>in</strong>tentional fatal <strong>in</strong>juries, EU27 9<br />
Figure 3: Un<strong>in</strong>tentional fatal <strong>in</strong>juries by sector, EU27 9<br />
Figure 4: Fatal <strong>in</strong>juries by causes of death, all ages, EU27 10<br />
Figure 5: Fatal <strong>in</strong>juries by causes of death, 1 – 4 years, EU27 10<br />
Figure 6: Fatal <strong>in</strong>juries by causes of death, 15 – 24 years, EU27 11<br />
Figure 7: Fatal <strong>in</strong>juries by causes of death, 65+ years, EU27 11<br />
Figure 8: Selected causes of fatal <strong>in</strong>juries, Standardised Death Rates (1995 – 2004, Index = 1995), EU27 12<br />
Figure 9: Injury deaths per 100 000 by sex and age group, EU27 12<br />
Figure 10: Hospital discharges due to <strong>in</strong>juries, EU27 13<br />
Figure 11: Injury Pyramid – overall <strong>in</strong>jury counts, EU27 14<br />
Figure 12: Road fatalities and <strong>in</strong>jured road users, EU27 15<br />
Figure 13: Fatalities by road user type 15<br />
Figure 14: Fatalities and <strong>in</strong>jured due to work-related accidents, EU27 16<br />
Figure 15: Fatalities at work by economic activity (accord<strong>in</strong>g to NACE branches), EU15 16<br />
Figure 16: Fatalities and <strong>in</strong>jured due to home and leisure accidents by country, EU27 17<br />
Figure 17: Non fatal Home & Leisure Accidents by activity at <strong>the</strong> time of <strong>in</strong>jury 17<br />
Figure 18: Home & leisure accidents by age group and sex 18<br />
Figure 19: Home & leisure accidents by <strong>in</strong>jured body part 19<br />
Figure 20: Home & leisure accidents by type of <strong>in</strong>jury 19<br />
Figure 21: Home & leisure accidents by <strong>in</strong>jury mechanism 20<br />
Figure 22: Injured <strong>in</strong> home & leisure accidents by activity at time of <strong>in</strong>jury and age group 21<br />
Figure 23: Injured <strong>in</strong> home & leisure accidents by activity at time of <strong>in</strong>jury and sex 21<br />
Figure 24: Play and leisure activity by <strong>in</strong>jury mechanism 22<br />
Figure 25: Domestic work by <strong>in</strong>jury mechanism 23<br />
Figure 26: Do-it-yourself work by <strong>in</strong>jury mechanism 24<br />
Figure 27: Sports practiced at <strong>the</strong> time of <strong>in</strong>jury 25<br />
Figure 28: Sports practiced at <strong>the</strong> time of <strong>in</strong>jury by age group 25<br />
Figure 29: Sports practiced at <strong>the</strong> time of <strong>in</strong>jury by sex 26<br />
Figure 30: Sports practiced at <strong>the</strong> time of <strong>in</strong>jury by <strong>in</strong>jured body part 26<br />
Figure 31: Home & leisure accidents by place of occurrence at <strong>the</strong> time of <strong>in</strong>jury 27<br />
Figure 32: Place of occurrence of home & leisure accidents at <strong>the</strong> time of <strong>in</strong>jury by age group 27<br />
Figure 33: Intentional and un<strong>in</strong>tentional <strong>in</strong>juries <strong>in</strong> IDB pilot countries 28<br />
Figure 34: Un<strong>in</strong>tentional <strong>in</strong>juries by activity (IDB, all <strong>in</strong>juries - pilot data) 28<br />
Figure 35: Injuries by activity and place of occurrence (IDB, all <strong>in</strong>juries - pilot data) 29<br />
Table 1: Injury deaths <strong>in</strong> % of all causes of death by age group, EU27 7<br />
Table 2: Lead<strong>in</strong>g causes of death by age group, EU27 8<br />
Table 3: Fatal <strong>in</strong>juries by causes of death, all ages, EU27: M<strong>in</strong>imum and maximum values by country 10<br />
Table 4: Hospital discharges due to <strong>in</strong>juries, EU27: M<strong>in</strong>imum and maximum values by country 13<br />
Table 5: Comprehensive view of <strong>in</strong>juries by sector, EU27 14<br />
Table 6: Top 10 consumer products <strong>in</strong>volved <strong>in</strong> home and leisure accidents and most reported <strong>in</strong>jury type 20<br />
Table 7: Top 10 consumer products <strong>in</strong>volved <strong>in</strong> play and leisure activity and most reported <strong>in</strong>jury type 22<br />
Table 8: Top 10 consumer products <strong>in</strong>volved <strong>in</strong> domestic work activity and most reported <strong>in</strong>jury type 23<br />
Table 9: Top 10 consumer products <strong>in</strong>volved <strong>in</strong> do-it-yourself activity and most reported <strong>in</strong>jury type 24<br />
Table 10: Data providers and data sources 30<br />
Table 11: Time reference - Injury data used <strong>in</strong> this report to compile a comprehensive view of <strong>in</strong>juries by country 32


