
You also want an ePaper? Increase the reach of your titles
YUMPU automatically turns print PDFs into web optimized ePapers that Google loves.
1. INJURIES IN THE EUROPEAN UNION – MORTALITY<br />
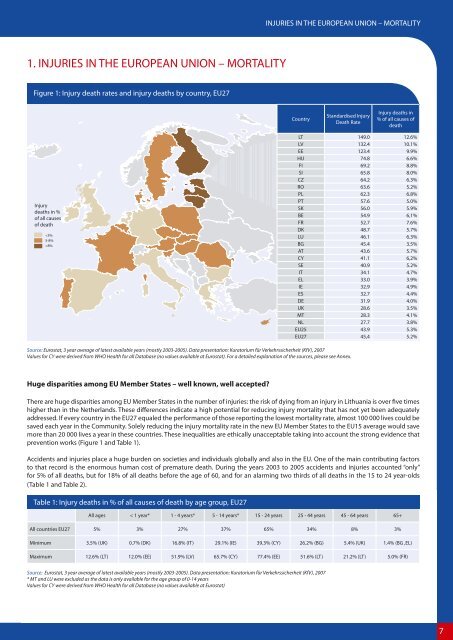
Figure 1: Injury death rates and <strong>in</strong>jury deaths by country, EU27<br />
Injury<br />
deaths <strong>in</strong> %<br />
of all causes<br />
of death<br />
8%<br />
Source: Eurostat, 3 year average of latest available years (mostly 2003-2005). Data presentation: Kuratorium für Verkehrssicherheit (KfV), 2007<br />
Values for CY were derived from WHO Health for all Database (no values available at Eurostat). For a detailed explanation of <strong>the</strong> sources, please see Annex.<br />
Huge disparities among EU Member States – well known, well accepted?<br />
There are huge disparities among EU Member States <strong>in</strong> <strong>the</strong> number of <strong>in</strong>juries: <strong>the</strong> risk of dy<strong>in</strong>g from an <strong>in</strong>jury <strong>in</strong> Lithuania is over five times<br />
higher than <strong>in</strong> <strong>the</strong> Ne<strong>the</strong>rlands. These differences <strong>in</strong>dicate a high potential for reduc<strong>in</strong>g <strong>in</strong>jury mortality that has not yet been adequately<br />
addressed. If every country <strong>in</strong> <strong>the</strong> EU27 equaled <strong>the</strong> performance of those report<strong>in</strong>g <strong>the</strong> lowest mortality rate, almost 100 000 lives could be<br />
saved each year <strong>in</strong> <strong>the</strong> Community. Solely reduc<strong>in</strong>g <strong>the</strong> <strong>in</strong>jury mortality rate <strong>in</strong> <strong>the</strong> new EU Member States to <strong>the</strong> EU15 average would save<br />
more than 20 000 lives a year <strong>in</strong> <strong>the</strong>se countries. These <strong>in</strong>equalities are ethically unacceptable tak<strong>in</strong>g <strong>in</strong>to account <strong>the</strong> strong evidence that<br />
prevention works (Figure 1 and Table 1).<br />
Accidents and <strong>in</strong>juries place a huge burden on societies and <strong>in</strong>dividuals globally and also <strong>in</strong> <strong>the</strong> EU. One of <strong>the</strong> ma<strong>in</strong> contribut<strong>in</strong>g factors<br />
to that record is <strong>the</strong> enormous human cost of premature death. Dur<strong>in</strong>g <strong>the</strong> years 2003 to 2005 accidents and <strong>in</strong>juries accounted “only”<br />
for 5% of all deaths, but for 18% of all deaths before <strong>the</strong> age of 60, and for an alarm<strong>in</strong>g two thirds of all deaths <strong>in</strong> <strong>the</strong> 15 to 24 year-olds<br />
(Table 1 and Table 2).<br />
Table 1: Injury deaths <strong>in</strong> % of all causes of death by age group, EU27<br />
All ages < 1 year* 1 - 4 years* 5 - 14 years* 15 - 24 years 25 - 44 years 45 - 64 years 65+<br />
All countries EU27 5% 3% 27% 37% 65% 34% 8% 3%<br />
M<strong>in</strong>imum 3.5% (UK) 0.7% (DK) 16.8% (IT) 29.1% (IE) 39.3% (CY) 26.2% (BG) 5.4% (UK) 1.4% (BG ,EL)<br />
Maximum 12.6% (LT) 12.0% (EE) 51.9% (LV) 65.7% (CY) 77.4% (EE) 51.6% (LT) 21.2% (LT) 5.0% (FR)<br />
Source: Eurostat, 3 year average of latest available years (mostly 2003-2005). Data presentation: Kuratorium für Verkehrssicherheit (KfV), 2007<br />
* MT and LU were excluded as <strong>the</strong> data is only available for <strong>the</strong> age group of 0-14 years<br />
Values for CY were derived from WHO Health for all Database (no values available at Eurostat)<br />
INJURIES IN THE EUROPEAN UNION – MORTALITY<br />
Country<br />
Standardised Injury<br />
Death Rate<br />
Injury deaths <strong>in</strong><br />
% of all causes of<br />
death<br />
LT 149.0 12.6%<br />
LV 132.4 10.1%<br />
EE 123.4 9.9%<br />
HU 74.8 6.6%<br />
FI 69.2 8.8%<br />
SI 65.8 8.0%<br />
CZ 64.2 6.3%<br />
RO 63.6 5.2%<br />
PL 62.3 6.8%<br />
PT 57.6 5.0%<br />
SK 56.0 5.9%<br />
BE 54.9 6,1%<br />
FR 52.7 7.6%<br />
DK 48.7 5.7%<br />
LU 46.1 6.3%<br />
BG 45.4 3.5%<br />
AT 43.6 5.7%<br />
CY 41.1 6,2%<br />
SE 40.9 5.2%<br />
IT 34.1 4.7%<br />
EL 33.0 3.9%<br />
IE 32.9 4.9%<br />
ES 32.7 4.4%<br />
DE 31.9 4.0%<br />
UK 28.6 3.5%<br />
MT 28.3 4.1%<br />
NL 27.7 3.8%<br />
EU25 43.9 5.3%<br />
EU27 45,4 5.2%<br />
7