Analysis of Bull Proofs for Intermediate Optimum Traits - CGIL
Analysis of Bull Proofs for Intermediate Optimum Traits - CGIL
Analysis of Bull Proofs for Intermediate Optimum Traits - CGIL

Create successful ePaper yourself
Turn your PDF publications into a flip-book with our unique Google optimized e-Paper software.
Introduction<br />
<strong>Analysis</strong> <strong>of</strong> <strong>Bull</strong> Pro<strong>of</strong>s <strong>for</strong><br />
<strong>Intermediate</strong> <strong>Optimum</strong> <strong>Traits</strong><br />
G. Kistemaker, G. Huapaya, B. Van Doormaal<br />
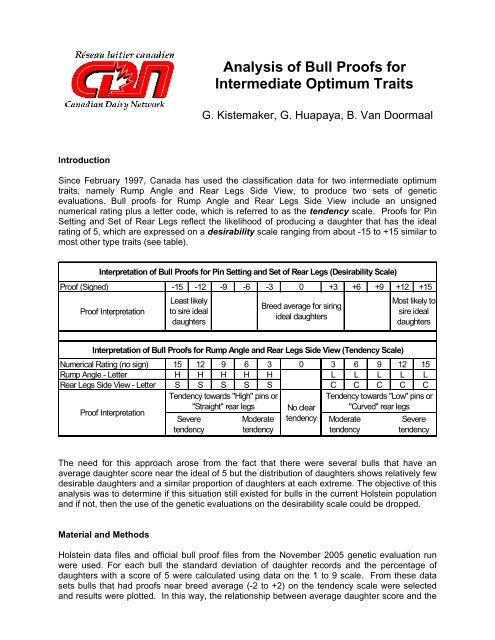
Since February 1997, Canada has used the classification data <strong>for</strong> two intermediate optimum<br />
traits, namely Rump Angle and Rear Legs Side View, to produce two sets <strong>of</strong> genetic<br />
evaluations. <strong>Bull</strong> pro<strong>of</strong>s <strong>for</strong> Rump Angle and Rear Legs Side View include an unsigned<br />
numerical rating plus a letter code, which is referred to as the tendency scale. Pro<strong>of</strong>s <strong>for</strong> Pin<br />
Setting and Set <strong>of</strong> Rear Legs reflect the likelihood <strong>of</strong> producing a daughter that has the ideal<br />
rating <strong>of</strong> 5, which are expressed on a desirability scale ranging from about -15 to +15 similar to<br />
most other type traits (see table).<br />
Interpretation <strong>of</strong> <strong>Bull</strong> Pro<strong>of</strong>s <strong>for</strong> Pin Setting and Set <strong>of</strong> Rear Legs (Desirability Scale)<br />
Pro<strong>of</strong> (Signed) -15 -12 -9 -6 -3 0 +3 +6 +9 +12 +15<br />
Pro<strong>of</strong> Interpretation<br />
Interpretation <strong>of</strong> <strong>Bull</strong> Pro<strong>of</strong>s <strong>for</strong> Rump Angle and Rear Legs Side View (Tendency Scale)<br />
Numerical Rating (no sign) 15 12 9 6 3 0 3 6 9 12 15<br />
Rump Angle - Letter H H H H H L L L L L<br />
Rear Legs Side View - Letter S S S S S C C C C C<br />
Pro<strong>of</strong> Interpretation<br />
The need <strong>for</strong> this approach arose from the fact that there were several bulls that have an<br />
average daughter score near the ideal <strong>of</strong> 5 but the distribution <strong>of</strong> daughters shows relatively few<br />
desirable daughters and a similar proportion <strong>of</strong> daughters at each extreme. The objective <strong>of</strong> this<br />
analysis was to determine if this situation still existed <strong>for</strong> bulls in the current Holstein population<br />
and if not, then the use <strong>of</strong> the genetic evaluations on the desirability scale could be dropped.<br />
Material and Methods<br />
Least likely<br />
to sire ideal<br />
daughters<br />
Tendency towards "High" pins or<br />
"Straight" rear legs<br />
Severe<br />
tendency<br />
Moderate<br />
tendency<br />
Breed average <strong>for</strong> siring<br />
ideal daughters<br />
No clear<br />
tendency<br />
Most likely to<br />
sire ideal<br />
daughters<br />
Tendency towards "Low" pins or<br />
"Curved" rear legs<br />
Moderate<br />
tendency<br />
Severe<br />
tendency<br />
Holstein data files and <strong>of</strong>ficial bull pro<strong>of</strong> files from the November 2005 genetic evaluation run<br />
were used. For each bull the standard deviation <strong>of</strong> daughter records and the percentage <strong>of</strong><br />
daughters with a score <strong>of</strong> 5 were calculated using data on the 1 to 9 scale. From these data<br />
sets bulls that had pro<strong>of</strong>s near breed average (-2 to +2) on the tendency scale were selected<br />
and results were plotted. In this way, the relationship between average daughter score and the
sire’s pro<strong>of</strong> on the desirability scale could be examined. The underlying hypothesis <strong>of</strong> this<br />
approach is that the publication <strong>of</strong> pro<strong>of</strong>s on the tendency scale alone would suffice if bulls with<br />
pro<strong>of</strong>s near the breed average showed a consistently desirable pattern <strong>for</strong> producing desirable<br />
daughters.<br />
Results & Discussion<br />
<strong>Bull</strong> pro<strong>of</strong>s aim to reflect the expected average per<strong>for</strong>mance <strong>of</strong> future daughters assuming a<br />
continuous linear scale. For type traits with an intermediate optimum that are recorded on a 9point<br />
linear scale, previous research found various bulls to have desirable daughter averages<br />
near the optimum score <strong>of</strong> 5 based mainly on daughters at each extreme <strong>of</strong> the linear scale<br />
rather than a majority at the ideal mid-score value. Computing genetic evaluations using these<br />
data yield bull pro<strong>of</strong>s near the ideal <strong>of</strong> zero (meaning no clear tendency towards either extreme)<br />
and there<strong>for</strong>e suggest these bulls are breed improvers. For these reason, in 1997, it was<br />
decided to use the same classification data, but on a folded scale <strong>of</strong> 1 to 5, to produce genetic<br />
evaluations on a desirability scale, published as Set <strong>of</strong> Rear Legs and Pin Setting.<br />
Figures 1 and 2 show a clear relationship between the percentage <strong>of</strong> daughters that have an<br />
ideal score <strong>of</strong> 5 and the sire’s pro<strong>of</strong> <strong>for</strong> Set <strong>of</strong> Rear Legs and Pin Setting, respectively, based on<br />
bulls that have a pro<strong>of</strong> on the tendency scale that is near breed average. Daughters <strong>of</strong> bulls<br />
that are close to average <strong>for</strong> Rear Leg Side View and have a Set <strong>of</strong> Rear Legs pro<strong>of</strong> <strong>of</strong> less than<br />
-10 have about a 20% probability <strong>of</strong> having an ideal score <strong>of</strong> ‘5’ <strong>for</strong> Rear Leg Side View. In<br />
contrast, daughters <strong>of</strong> bulls with an average pro<strong>of</strong> <strong>for</strong> Rear Leg Side View and are at least +10<br />
<strong>for</strong> Set <strong>of</strong> Rear Legs have more than 40% chance <strong>of</strong> having a score <strong>of</strong> 5. Similar results were<br />
observed <strong>for</strong> Rump Angle/Pin Setting in Figure 2 with the spread in likelihood <strong>of</strong> having an ideal<br />
daughter being from 30% at -10 to 50% at +10 <strong>for</strong> Pin Setting.<br />
The standard deviation <strong>of</strong> daughter scores <strong>for</strong> bulls at opposite ends in their pro<strong>of</strong> <strong>for</strong> Set <strong>of</strong><br />
Rear Legs (and Pin Setting) also has a clear trend based on bulls that have a pro<strong>of</strong> near breed<br />
average <strong>for</strong> the pro<strong>of</strong> on the tendency scale. Basically, a higher standard deviation <strong>of</strong> daughter<br />
scores <strong>for</strong> negative pro<strong>of</strong>s on the desirability scale reflect that these bulls have a large variation<br />
in how their daughters are scoring. Less variability in daughter scores <strong>for</strong> highly rated bulls on<br />
the desirability scale indicate that the system is appropriately identifying bulls that are producing<br />
daughters that consistently have the ideal phenotype.<br />
Conclusion and Recommendation<br />
The results <strong>of</strong> this analysis, as presented in Figures 1 and 2, clearly show that there are bulls<br />
evaluated as ideal (i.e.: near zero) on the tendency scale that are inappropriately considered as<br />
siring daughters near the ideal rating <strong>of</strong> 5. There<strong>for</strong>e, the pro<strong>of</strong> in<strong>for</strong>mation on both the<br />
tendency and desirability scales are required <strong>for</strong> a proper interpretation <strong>of</strong> bull pro<strong>of</strong>s <strong>for</strong> these<br />
intermediate optimum type traits. While this analysis was done only <strong>for</strong> the Holstein breed there<br />
is no reason to assume that a similar result would not also occur <strong>for</strong> other breeds. It is<br />
recommended that the current procedure <strong>for</strong> calculating pro<strong>of</strong>s on both the tendency and<br />
desirability scales be continued.
Standard Deviation <strong>of</strong> the<br />
Score<br />
Standard Deviation <strong>of</strong> the Score<br />
Figure 1: Relationship between phenotypic score <strong>for</strong> Rear Leg Side View and<br />
the pro<strong>of</strong> <strong>for</strong> Set <strong>of</strong> Rear Legs <strong>for</strong> bulls with a Rear Leg Side View pro<strong>of</strong> ranging<br />
from -2 to +2<br />
1.8<br />
70%<br />
1.6<br />
1.4<br />
1.2<br />
1<br />
0.8<br />
0.6<br />
0.4<br />
1.8<br />
1.6<br />
1.4<br />
1.2<br />
-13 -11 -9 -7 -5 -3 -1 1 3 5 7 9 11 13 15<br />
Set <strong>of</strong> Rear Legs pro<strong>of</strong><br />
1<br />
0.8<br />
0.6<br />
0.4<br />
Standard Deviation Percent with a score <strong>of</strong> 5<br />
Figure 2: Relationship between phenotypic score <strong>for</strong> Rump Angle and the pro<strong>of</strong><br />
<strong>for</strong> Pin Setting <strong>for</strong> bulls with a Rump Angle pro<strong>of</strong> ranging from -2 to +2<br />
-15 -13 -11 -9 -7 -5 -3 -1 1 3 5 7 9 11 13 15<br />
Pin Setting pro<strong>of</strong><br />
Standard Deviation Percent with a score <strong>of</strong> 5<br />
60%<br />
50%<br />
40%<br />
30%<br />
20%<br />
10%<br />
0%<br />
% <strong>of</strong> records with a<br />
score <strong>of</strong> 5<br />
70%<br />
60%<br />
50%<br />
40%<br />
30%<br />
20%<br />
10%<br />
0%<br />
% <strong>of</strong> records with a score <strong>of</strong> 5