Short communication: Effect of preadjusting test-day yields for stage ...
Short communication: Effect of preadjusting test-day yields for stage ...
Short communication: Effect of preadjusting test-day yields for stage ...

You also want an ePaper? Increase the reach of your titles
YUMPU automatically turns print PDFs into web optimized ePapers that Google loves.
J. Dairy Sci. 92:2270–2275<br />
doi:10.3168/jds.2008-1806<br />
© American Dairy Science Association, 2009.<br />
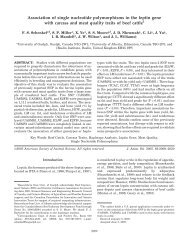
<strong>Short</strong> <strong>communication</strong>: effect <strong>of</strong> <strong>preadjusting</strong> <strong>test</strong>-<strong>day</strong> <strong>yields</strong> <strong>for</strong> <strong>stage</strong><br />
<strong>of</strong> pregnancy on variance component estimation in Canadian ayrshires<br />
S. Loker,* F. miglior,†‡ 1 J. Bohmanova,* L. r. Schaeffer,* J. Jamrozik,* and G. Kistemaker‡<br />
*Centre <strong>for</strong> Genetic Improvement <strong>of</strong> livestock, University <strong>of</strong> Guelph, Guelph, ontario, Canada, N1G 2W1<br />
†Dairy and Swine research and Development Centre, Agriculture and Agri-Food Canada, Sherbrooke, Quebec, Canada, J1M 1Z3<br />
‡Canadian Dairy Network, Guelph, ontario, Canada, N1K 1e5<br />
aBStraCt<br />
Preadjustment <strong>of</strong> phenotypic records is an alternative<br />
to accounting <strong>for</strong> the effect <strong>of</strong> pregnancy within<br />
the genetic evaluation model. Variance components<br />
used in the Canadian Test-Day Model may need to<br />
be re-estimated after <strong>preadjusting</strong> <strong>for</strong> pregnancy. The<br />
objective <strong>of</strong> this study was to assess the effect <strong>of</strong> <strong>preadjusting</strong><br />
<strong>test</strong>-<strong>day</strong> <strong>yields</strong> on variance components and<br />
estimated breeding values using a random regression<br />
<strong>test</strong>-<strong>day</strong> model in a random sample <strong>of</strong> Ayrshire cows.<br />
A random sample <strong>of</strong> 981 Canadian Ayrshire cows from<br />
18 complete herds (average <strong>of</strong> 54.5 cows/herd) was<br />
analyzed. Two data sets were created using the same<br />
animals, one with unadjusted milk, fat, and protein<br />
<strong>yields</strong>, and one data set with <strong>test</strong>-<strong>day</strong> records adjusted<br />
<strong>for</strong> pregnancy effects. Pregnancy effect estimates from<br />
a previous study were used <strong>for</strong> additive preadjustment<br />
<strong>of</strong> records. Variance components were estimated using<br />
both data sets. Results were very similar between the 2<br />
data sets <strong>for</strong> all estimated genetic parameters (heritabilities,<br />
genetic, and permanent environmental correlations).<br />
The relative squared differences were very small:<br />
0.05% <strong>for</strong> heritabilities, 0.20% <strong>for</strong> genetic correlations,<br />
and 0.18% <strong>for</strong> permanent environmental correlations.<br />
Furthermore, paired Student’s t-<strong>test</strong>s showed that the<br />
differences between the genetic parameters <strong>of</strong> data sets<br />
adjusted and unadjusted <strong>for</strong> pregnancy effect were not<br />
significantly different from 0. Results from this study<br />
show that <strong>preadjusting</strong> data <strong>for</strong> pregnancy did not<br />
yield changes in covariance component estimates, thus<br />
suggesting that <strong>preadjusting</strong> <strong>test</strong>-<strong>day</strong> records could be<br />
a feasible solution to account <strong>for</strong> pregnancy in the Canadian<br />
Test-Day Model without changing the current<br />
model. Estimated breeding values (EBV) were calculated<br />
<strong>for</strong> both data sets to observe the impact <strong>of</strong> <strong>preadjusting</strong><br />
<strong>for</strong> pregnancy. Overall, the largest changes in<br />
EBV seen when <strong>preadjusting</strong> <strong>for</strong> pregnancy (compared<br />
with unadjusted records) occurred <strong>for</strong> nonpregnant elite<br />
Received October 13, 2008.<br />
Accepted January 13, 2009.<br />
1 Corresponding author: Miglior@cdn.ca<br />
2270<br />
cows, whose EBV declined. Preadjusting <strong>for</strong> pregnancy<br />
be<strong>for</strong>e genetic evaluations improves the estimation <strong>of</strong><br />
breeding values by adding the negative impact <strong>of</strong> pregnancy<br />
back onto pregnant cow <strong>test</strong>-<strong>day</strong> records, causing<br />
an increase in their production EBV.<br />
Key words: <strong>test</strong>-<strong>day</strong> model, pregnancy status, <strong>stage</strong><br />
<strong>of</strong> pregnancy, preadjustment<br />
Many countries preadjust phenotypes <strong>for</strong> environmental<br />
effects be<strong>for</strong>e using the data in genetic evaluation<br />
<strong>of</strong> dairy cattle (Interbull, 2008). Generally, all<br />
effects should be accounted <strong>for</strong> in the genetic evaluation<br />
model, but if preadjustment methods are chosen,<br />
they should be well justified (Interbull, 2001). One<br />
advantage <strong>of</strong> preadjustment is the reduced computation<br />
time <strong>for</strong> running genetic evaluations (Muir et<br />
al., 2007; Leclerc et al., 2008). Also, less memory is<br />
required to run genetic evaluations because there are<br />
fewer unknowns (Leclerc et al., 2008). Muir et al. (2007)<br />
noted that shorter computing time and “difficulties in<br />
applying methodology and explaining results” justify<br />
preadjustment. However, preadjustment factors should<br />
be updated regularly (Wilmink, 1987). The Interbull<br />
guidelines (Interbull, 2001) suggest updating preadjustment<br />
factors at least once per generation. Leclerc et al.<br />
(2008) suggest updating preadjustment factors every<br />
year. Furthermore, Mark (2004) states that a genetic<br />
evaluation is no longer a best linear unbiased prediction<br />
when phenotypes are preadjusted, so preadjustment<br />
should be used in moderation. If the preadjustment factors<br />
are not independent <strong>of</strong> genotype, then some genetic<br />
effects will be subtracted from phenotypic observations<br />
(Taylor et al., 1993), which would result in inaccurate<br />
genetic evaluations.<br />
Determination <strong>of</strong> pregnancy is not always accurate<br />
(Bohmanova et al., 2008). For cows with lactation still<br />
in progress at the time <strong>of</strong> genetic evaluation, assumptions<br />
may have to be made about their pregnancy status<br />
if pregnancy effect is included in the model itself.<br />
This means that estimation <strong>of</strong> pregnancy effects has<br />
the potential to be very error-prone, especially if pregnancy<br />
status assumptions need to be made on many<br />
animals. However, if pregnancy effects can be estimated
SHorT CoMMUNICATIoN: TeST-DAY YIelDS AND STAGe oF PreGNANCY<br />
be<strong>for</strong>e genetic evaluation using data with limited assumptions,<br />
then more accurate pregnancy effects can<br />
be determined, making preadjustment <strong>for</strong> pregnancy<br />
effect potentially more accurate than including pregnancy<br />
in the genetic evaluation model.<br />
Some countries use preadjustment to adjust <strong>for</strong> heterogeneous<br />
variances (Interbull, 2008). An example <strong>of</strong><br />
heterogeneous variance is when phenotypic variances<br />
differ across time, herd, region, or parity (Wiggans and<br />
VanRaden, 1991). Canada and the United States preadjust<br />
phenotypic data <strong>for</strong> heterogeneity <strong>of</strong> variances<br />
(Muir et al., 2007). Italy has preadjusted <strong>for</strong> heterogeneous<br />
variance in their genetic evaluation model<br />
since 1993, and chose preadjustment because it was less<br />
time consuming (Muir et al., 2007). A survey by Mark<br />
(2004) found that 20 <strong>of</strong> the 31 countries questioned<br />
preadjusted <strong>for</strong> heterogeneous variances be<strong>for</strong>e genetic<br />
evaluations.<br />
Interbull (2008) indicated that several countries use<br />
preadjustment <strong>for</strong> various fixed-effects factors. The<br />
Walloon region <strong>of</strong> Belgium per<strong>for</strong>ms additive preadjustment<br />
<strong>for</strong> age within lactation-<strong>stage</strong>-breed effects<br />
on production traits. France per<strong>for</strong>ms multiplicative<br />
preadjustments <strong>for</strong> the effect <strong>of</strong> parity on production<br />
traits. Italy and the United States also preadjust production<br />
trait records <strong>for</strong> various environmental effects<br />
(including age and month <strong>of</strong> calving).<br />
Pregnancy is an environmental effect that negatively<br />
influences milk production in dairy cattle. The effect <strong>of</strong><br />
pregnancy results from an increased regression <strong>of</strong> the<br />
mammary gland (Bachman et al., 1988; Coulon et al.,<br />
1995; Brotherstone et al., 2004; Akers, 2006) and the<br />
partitioning <strong>of</strong> nutrients toward fetal growth (Bell et<br />
al., 1995). As the fetus grows, the effect <strong>of</strong> pregnancy<br />
increases (Auran, 1974; Wiggans, 1980; Olori et al.,<br />
1997; Brotherstone et al., 2004). Recently, the assessment<br />
<strong>of</strong> the impact <strong>of</strong> pregnancy on milk production<br />
has been shown in Canada by Bohmanova et al. (2008)<br />
in Holsteins and by Loker et al. (2009) in other Canadian<br />
dairy breeds. Milk and fat <strong>yields</strong> began to decline<br />
because <strong>of</strong> pregnancy after about 4 mo <strong>of</strong> gestation, and<br />
protein began to decline after about 2 mo. Loker et al.<br />
(2009) proposed 4 different models to account <strong>for</strong> pregnancy<br />
that included: a) <strong>day</strong>s open; b) <strong>day</strong>s pregnant;<br />
c) <strong>day</strong>s open and <strong>stage</strong> <strong>of</strong> pregnancy interaction; and<br />
d) <strong>stage</strong> <strong>of</strong> pregnancy classes. The most feasible model<br />
was the <strong>stage</strong>-<strong>of</strong>-pregnancy model. Once the proper<br />
model is chosen, pregnancy effect can be accounted <strong>for</strong><br />
in the Canadian Test-Day Model (CTDM), either by<br />
<strong>preadjusting</strong> <strong>test</strong>-<strong>day</strong> records <strong>for</strong> milk, fat, and protein<br />
be<strong>for</strong>e breeding value estimation, or by including the effect<br />
<strong>of</strong> pregnancy in the genetic evaluation model. The<br />
objective <strong>of</strong> this study was to use adjustment factors<br />
from the <strong>stage</strong>-<strong>of</strong>-pregnancy model to assess the effect<br />
<strong>of</strong> <strong>preadjusting</strong> <strong>test</strong>-<strong>day</strong> <strong>yields</strong> on variance components<br />
and EBV using a random regression <strong>test</strong>-<strong>day</strong> model<br />
applied to a random sample <strong>of</strong> Ayrshire cows.<br />
Data were provided by the Canadian Dairy Network<br />
and were from <strong>test</strong>-<strong>day</strong> record extraction <strong>for</strong> the<br />
August 2007 genetic evaluation. Adjustment factors<br />
were estimated by Loker et al. (2009) <strong>for</strong> milk, fat,<br />
and protein <strong>yields</strong> using <strong>stage</strong> <strong>of</strong> pregnancy (classes <strong>of</strong><br />
<strong>day</strong>s pregnant with 30 d <strong>for</strong> each class, the last class<br />
including all <strong>test</strong>-<strong>day</strong> records after 210 d <strong>of</strong> pregnancy).<br />
Specifically, the model used was a fixed-effects model<br />
that included <strong>stage</strong> <strong>of</strong> pregnancy, herd <strong>test</strong>-<strong>day</strong> effect<br />
as a classification variable, and the lactation curve was<br />
modeled with a fourth-order Legendre polynomial on<br />
DIM within age-parity-season <strong>of</strong> calving class. Separate<br />
models were fitted to parities 1, 2, and 3. For this<br />
study, additive adjustment factors were assumed to be<br />
zero be<strong>for</strong>e the fourth <strong>stage</strong> <strong>of</strong> pregnancy <strong>for</strong> milk and<br />
fat yield. Adjustment factors were assumed to be zero<br />
<strong>for</strong> the first <strong>stage</strong> <strong>of</strong> pregnancy <strong>for</strong> protein yield. The<br />
additive adjustment factors are listed in Table 1. A<br />
fourth order polynomial regression was then fitted <strong>for</strong><br />
each parity and trait to smooth the preadjustments at<br />
each <strong>test</strong>-<strong>day</strong> record. All <strong>test</strong>-<strong>day</strong> records <strong>for</strong> milk, fat,<br />
and protein <strong>yields</strong> were preadjusted using the estimated<br />
polynomial functions, based on the <strong>day</strong> <strong>of</strong> pregnancy <strong>of</strong><br />
each <strong>test</strong>-<strong>day</strong> record.<br />
After <strong>preadjusting</strong> the full data set, records from<br />
DIM 305 d were eliminated. The SCC were<br />
log-trans<strong>for</strong>med to SCS. Only records from the first<br />
3 parities that had data <strong>for</strong> all production traits on a<br />
given <strong>test</strong>-<strong>day</strong> were kept. Within cow, if parity 3 was<br />
present, parities 1 and 2 were also present, and if parity<br />
2 was present, parity 1 was also present. Herds were<br />
required to have a minimum <strong>of</strong> 50 cows in the data<br />
set to be included in the analysis. To estimate variance<br />
components, a random sample <strong>of</strong> complete herds<br />
was extracted from the edited data set. A total <strong>of</strong> 981<br />
cows from 18 herds (average <strong>of</strong> 54.5 cows/herd) with<br />
14,738 <strong>test</strong>-<strong>day</strong> records were randomly selected. The<br />
total number <strong>of</strong> animals (cows with own records and<br />
pedigree) included 3,528 animals. Covariance components<br />
were estimated by Bayesian methods with Gibbs<br />
sampling using the 4-trait multiple-lactation random<br />
regression <strong>test</strong>-<strong>day</strong> model described by Miglior et al.<br />
(2007):<br />
y = Hh + Xb + Za + Wp + e,<br />
2271<br />
where y is a vector <strong>of</strong> milk, fat, protein yield, and SCS<br />
observations <strong>for</strong> the first 3 lactations, either additively<br />
adjusted (yield traits) or left unadjusted <strong>for</strong> pregnancy<br />
effect (depending on the data set, which is explained<br />
below); h is a vector <strong>of</strong> fixed herd-<strong>test</strong>-<strong>day</strong> effects;<br />
Journal <strong>of</strong> Dairy Science Vol. 92 No. 5, 2009
2272<br />
b is a vector <strong>of</strong> fixed regression coefficients <strong>for</strong> ageparity-season<br />
classes; a is a vector <strong>of</strong> random regression<br />
coefficients <strong>for</strong> genetic effects; p is a vector <strong>of</strong> random<br />
regression coefficients <strong>for</strong> permanent environmental<br />
(PE) effects; and e is a vector <strong>of</strong> residual effects; H, X,<br />
Z, and W are incidence matrices relating observations<br />
to their respective effects. The distribution <strong>of</strong> random<br />
effects is assumed to be<br />
with variances:<br />
æaö<br />
ç<br />
çp<br />
N(, 0 V),<br />
ç<br />
èç<br />
eø÷<br />
é<br />
ê<br />
GÄA 0 0<br />
V = ê 0 IÄP 0<br />
ê<br />
+<br />
ê 0 0<br />
ë å<br />
R p,s<br />
where G and P are covariance matrices <strong>for</strong> genetic and<br />
PE regression coefficients, respectively, A is the additive<br />
relationship matrix and R p,s is the matrix <strong>of</strong> residual<br />
covariances among traits with elements depending on<br />
parity (p) and the interval <strong>of</strong> DIM (s).<br />
Custom-written s<strong>of</strong>tware that is routinely used at<br />
the Canadian Dairy Network was used <strong>for</strong> the analysis.<br />
Two data sets were created with the same animals and<br />
records, one with unadjusted milk, fat, and protein<br />
<strong>yields</strong>, and one data set with adjusted <strong>test</strong>-<strong>day</strong> records.<br />
Somatic cell score was left unadjusted in both data sets.<br />
Variance components were estimated on both data sets.<br />
Posterior means and standard deviation <strong>of</strong> (co)variance<br />
components were estimated using 40,000 samples after<br />
a burn-in <strong>of</strong> 10,000 samples. Daily heritability was<br />
defined as a ratio <strong>of</strong> genetic variance to the sum <strong>of</strong><br />
genetic, PE, and residual variances <strong>for</strong> each <strong>day</strong> in milk<br />
from 5 to 305 d, and averaged across the entire lacta-<br />
Journal <strong>of</strong> Dairy Science Vol. 92 No. 5, 2009<br />
ù<br />
ú ,<br />
ú<br />
û<br />
loKer eT Al.<br />
Table 1. Adjustment factors 1 by parity and trait <strong>for</strong> each <strong>stage</strong> <strong>of</strong> gestation<br />
Classes <strong>of</strong> <strong>day</strong>s<br />
pregnant (d)<br />
Milk yield (kg) Fat yield (kg) Protein yield (kg)<br />
Parity 1 Parity 2 Parity 3 Parity 1 Parity 2 Parity 3 Parity 1 Parity 2 Parity 3<br />
0 0.00 0.00 0.00 0.000 0.000 0.000 0.000 0.000 0.000<br />
1–30 0.00 0.00 0.00 0.000 0.000 0.000 0.000 0.000 0.000<br />
31–60 0.00 0.00 0.00 0.000 0.000 0.000 0.009 0.011 0.014<br />
61–90 0.00 0.00 0.00 0.000 0.000 0.000 0.016 0.019 0.022<br />
91–120 0.32 0.16 0.16 0.012 0.011 0.008 0.027 0.030 0.030<br />
121–150 0.65 0.71 0.69 0.020 0.025 0.024 0.036 0.041 0.042<br />
151–180 1.43 1.85 1.86 0.041 0.059 0.057 0.055 0.067 0.068<br />
181–210 2.64 3.28 3.35 0.080 0.104 0.104 0.091 0.108 0.110<br />
>210 3.68 4.00 3.87 0.114 0.128 0.119 0.127 0.135 0.130<br />
1 Raw additive adjustment factors by <strong>stage</strong> <strong>of</strong> pregnancy, provided by Loker et al. (2009).<br />
tion <strong>for</strong> each <strong>of</strong> the first 3 lactations. Genetic and PE<br />
correlations between production traits were calculated<br />
using (co)variances <strong>of</strong> the first regression coefficients<br />
as described by Wood et al. (2003). A paired Student’s<br />
t-<strong>test</strong>, with the null hypothesis that the mean difference<br />
between genetic parameters was 0, was per<strong>for</strong>med between<br />
the genetic parameter estimates <strong>of</strong> the adjusted<br />
and unadjusted data sets.<br />
The convergence <strong>of</strong> Gibbs samples was monitored<br />
by visual inspection <strong>of</strong> the plot <strong>of</strong> realizations <strong>for</strong> selected<br />
covariance components. The effective sample size<br />
ranged from 13 to 89 (genetic variances), from 29 to<br />
217 (PE variances), and from 278 to 2,069 (residual<br />
variances).<br />
Using the same random regression <strong>test</strong>-<strong>day</strong> model,<br />
breeding values were estimated <strong>for</strong> bulls and cows using<br />
the 2 complete data sets (one data set unadjusted and<br />
one pregnancy preadjusted). This was done to monitor<br />
the change in animals’ EBV when <strong>preadjusting</strong> <strong>for</strong><br />
pregnancy effect versus not accounting <strong>for</strong> pregnancy.<br />
Genetic and PE correlations and daily heritabilities<br />
are shown in Tables 2 and 3 <strong>for</strong> the unadjusted data set<br />
and preadjusted data set, respectively. Posterior standard<br />
deviations <strong>of</strong> all estimates (heritability, genetic,<br />
and PE correlations) ranged from 0.001 to 0.013, both<br />
<strong>for</strong> adjusted and nonadjusted analyses. Results were<br />
very similar between the 2 data sets <strong>for</strong> all estimated<br />
parameters (heritabilities, genetic, and PE correlations).<br />
Table 4 shows the differences between the preadjusted<br />
and unadjusted estimates. The relative squared<br />
differences between the parameters estimated with unadjusted<br />
and adjusted were very small: 0.05% <strong>for</strong> heritabilities,<br />
0.20% <strong>for</strong> genetic correlations, and 0.18% <strong>for</strong><br />
PE correlations. The paired Student’s t-<strong>test</strong>s between<br />
the adjusted data set and unadjusted data set genetic<br />
parameter estimates resulted in small t-values <strong>of</strong> −0.21<br />
(P = 0.83), −0.11 (P = 0.92), and −0.51 (P = 0.61)<br />
<strong>for</strong> the differences in genetic correlations, heritabilities,<br />
and PE correlations, respectively. This indicates that
SHorT CoMMUNICATIoN: TeST-DAY YIelDS AND STAGe oF PreGNANCY<br />
Table 2. Average daily heritabilities on the diagonal, genetic correlations below the diagonal, and permanent environment correlations above<br />
the diagonal (unadjusted data set)<br />
Item<br />
Milk<br />
(kg)<br />
First parity Second parity Third parity<br />
Fat<br />
(kg)<br />
Protein<br />
(kg) SCS<br />
Milk<br />
(kg)<br />
the differences between the genetic parameters <strong>of</strong> data<br />
sets adjusted and unadjusted <strong>for</strong> pregnancy effect were<br />
not significantly different from 0. Assuming similar<br />
results <strong>for</strong> the preadjustment <strong>of</strong> phenotypes <strong>for</strong> other<br />
Canadian breeds, variance components may not need<br />
to be re-estimated be<strong>for</strong>e using records preadjusted <strong>for</strong><br />
pregnancy in the CTDM.<br />
Preadjusting <strong>for</strong> pregnancy had little effect on bull<br />
EBV: the EBV <strong>of</strong> 99% <strong>of</strong> bulls did not change by more<br />
than 50 kg <strong>for</strong> milk yield (EBV SD = 630 kg), and 2 kg<br />
<strong>for</strong> fat (EBV SD = 24 kg) and protein yield (EBV SD =<br />
20 kg). However, larger changes occurred <strong>for</strong> lactation<br />
persistency EBV, <strong>for</strong> which the relative EBV <strong>of</strong> 3.5% <strong>of</strong><br />
bulls changed by 2 points (EBV SD = 5 points). When<br />
an adjustment is not made <strong>for</strong> pregnancy, pregnant<br />
Fat<br />
(kg)<br />
Protein<br />
(kg) SCS<br />
Milk<br />
(kg)<br />
Fat<br />
(kg)<br />
2273<br />
Protein<br />
(kg) SCS<br />
First parity<br />
Milk (kg) 0.41 0.91 0.96 −0.27 0.59 0.50 0.57 −0.08 0.46 0.34 0.42 0.05<br />
Fat (kg) 0.84 0.35 0.92 −0.29 0.51 0.54 0.53 −0.12 0.43 0.42 0.43 −0.01<br />
Protein (kg) 0.93 0.86 0.39 −0.24 0.60 0.55 0.63 −0.09 0.48 0.40 0.49 0.02<br />
SCS −0.04 −0.06 −0.04 0.31 −0.17 −0.17 −0.16 0.44 −0.19 −0.19 −0.18 0.38<br />
Second parity<br />
Milk (kg) 0.73 0.60 0.66 −0.09 0.45 0.92 0.96 −0.33 0.57 0.50 0.55 −0.11<br />
Fat (kg) 0.58 0.70 0.58 −0.07 0.87 0.40 0.94 −0.38 0.55 0.59 0.57 −0.16<br />
Protein (kg) 0.66 0.63 0.70 −0.06 0.93 0.89 0.43 −0.33 0.57 0.53 0.59 −0.13<br />
SCS −0.10 −0.09 −0.06 0.49 −0.34 −0.33 −0.32 0.40 −0.20 −0.20 −0.18 0.54<br />
Third parity<br />
Milk (kg) 0.56 0.46 0.51 −0.02 0.70 0.60 0.65 −0.18 0.43 0.92 0.96 −0.38<br />
Fat (kg) 0.39 0.53 0.41 −0.04 0.57 0.70 0.60 −0.18 0.86 0.38 0.93 −0.43<br />
Protein (kg) 0.49 0.47 0.55 −0.03 0.62 0.59 0.68 −0.17 0.93 0.87 0.42 −0.35<br />
SCS −0.03 −0.08 −0.03 0.28 −0.26 −0.30 −0.27 0.55 −0.28 −0.37 −0.27 0.39<br />
cows would appear to be genetically less persistent. It is<br />
there<strong>for</strong>e logical to see a change in lactation persistency<br />
EBV after <strong>preadjusting</strong> records <strong>for</strong> pregnancy effect.<br />
Overall, larger changes were observed <strong>for</strong> cow EBV; in<br />
particular, a significant decrease <strong>of</strong> cow indexes <strong>for</strong> top<br />
elite cows with large <strong>day</strong>s open that have been flushed<br />
extensively <strong>for</strong> embryo transfer. As expected, cows that<br />
did not have large <strong>day</strong>s open showed an increase in<br />
EBV <strong>for</strong> production traits.<br />
Leclerc et al. (2008) compared a 2-step procedure<br />
(preadjustment, then genetic evaluation) with a 1-step<br />
genetic evaluation including all factors in the model.<br />
Preadjustment was carried out <strong>for</strong> effects related to the<br />
shape <strong>of</strong> the lactation curve, including gestation effect<br />
using 4-knot regression splines with knots at 100, 150,<br />
Table 3. Average daily heritabilities on the diagonal, genetic correlations below the diagonal, and permanent environment correlations above<br />
the diagonal (preadjusted data set)<br />
Item<br />
Milk<br />
(kg)<br />
First parity Second parity Third parity<br />
Fat<br />
(kg)<br />
Protein<br />
(kg) SCS<br />
Milk<br />
(kg)<br />
Fat<br />
(kg)<br />
Protein<br />
(kg) SCS<br />
Milk<br />
(kg)<br />
Fat<br />
(kg)<br />
Protein<br />
(kg) SCS<br />
First parity<br />
Milk (kg) 0.42 0.91 0.95 −0.29 0.54 0.46 0.53 −0.09 0.45 0.35 0.43 0.03<br />
Fat (kg) 0.83 0.36 0.92 −0.31 0.45 0.49 0.48 −0.12 0.42 0.43 0.42 −0.02<br />
Protein (kg) 0.92 0.87 0.39 −0.27 0.54 0.51 0.59 −0.10 0.47 0.42 0.49 −0.01<br />
SCS −0.03 −0.05 −0.04 0.30 −0.16 −0.16 −0.15 0.43 −0.18 −0.19 −0.18 0.36<br />
Second parity<br />
Milk (kg) 0.74 0.59 0.66 −0.09 0.44 0.92 0.96 −0.37 0.55 0.49 0.53 −0.14<br />
Fat (kg) 0.59 0.69 0.58 −0.08 0.86 0.39 0.94 −0.40 0.53 0.57 0.55 −0.16<br />
Protein (kg) 0.67 0.63 0.70 −0.08 0.93 0.89 0.41 −0.36 0.55 0.52 0.58 −0.14<br />
SCS −0.10 −0.10 −0.06 0.50 −0.29 −0.31 −0.29 0.40 −0.18 −0.18 −0.16 0.52<br />
Third parity<br />
Milk (kg) 0.56 0.46 0.51 −0.06 0.68 0.59 0.63 −0.20 0.43 0.92 0.96 −0.37<br />
Fat (kg) 0.38 0.53 0.40 −0.09 0.53 0.68 0.56 −0.23 0.84 0.38 0.93 −0.41<br />
Protein (kg) 0.47 0.46 0.53 −0.08 0.60 0.59 0.66 −0.21 0.92 0.86 0.42 −0.33<br />
SCS −0.02 −0.10 −0.02 0.31 −0.20 −0.28 −0.23 0.56 −0.30 −0.40 −0.30 0.40<br />
Journal <strong>of</strong> Dairy Science Vol. 92 No. 5, 2009
2274<br />
200, and 265 d pregnant. Solutions <strong>for</strong> random effects<br />
were similar between 1- and 2-step procedures, with<br />
correlations >0.99. The Interbull guidelines (Interbull,<br />
2001) suggest that using preadjusted records <strong>for</strong> genetic<br />
evaluations should be well justified. Determination <strong>of</strong><br />
pregnancy by Loker et al. (2009) was not always accurate.<br />
For cows with lactation still in progress, conception<br />
was assumed using date <strong>of</strong> last insemination, which<br />
was not necessarily correct. Sometimes, insemination<br />
records were not available, which would lead to further<br />
error when assuming dates <strong>of</strong> conception and pregnancy<br />
status. Bohmanova et al. (2008) separated cows into<br />
classes depending on the availability <strong>of</strong> insemination<br />
data. Because insemination date and calving date were<br />
not always known, pregnancy status was more accurate<br />
<strong>for</strong> some classes than <strong>for</strong> others. In the future, preadjustment<br />
<strong>for</strong> pregnancy should be per<strong>for</strong>med using<br />
estimates <strong>for</strong> <strong>stage</strong> <strong>of</strong> pregnancy obtained after eliminating<br />
records that have erroneous pregnancy in<strong>for</strong>mation.<br />
Conversely, if pregnancy effect was accounted<br />
<strong>for</strong> in the genetic evaluation model, there would be a<br />
large number <strong>of</strong> records with erroneous pregnancy data<br />
that would result in inaccurate corrections. Readers<br />
should note that there would still be animals <strong>for</strong> which<br />
pregnancy status is uncertain when per<strong>for</strong>ming genetic<br />
evaluation <strong>of</strong> records preadjusted <strong>for</strong> pregnancy. However,<br />
because adjustment factors would be accurately<br />
estimated based on data with more certain pregnancy<br />
status in<strong>for</strong>mation, the effects <strong>of</strong> errors in determining<br />
pregnancy status <strong>for</strong> genetic evaluation will be limited<br />
compared with using all data to adjust <strong>for</strong> pregnancy.<br />
Results from this study show that <strong>preadjusting</strong> data<br />
<strong>for</strong> pregnancy did not yield relevant changes in variance<br />
component estimates, thus suggesting that <strong>preadjusting</strong><br />
<strong>test</strong>-<strong>day</strong> records could be a feasible solution to account<br />
Journal <strong>of</strong> Dairy Science Vol. 92 No. 5, 2009<br />
loKer eT Al.<br />
Table 4. Differences between estimated parameters from preadjusted data set with parameters estimated from unadjusted data set (average<br />
daily heritabilities on the diagonal, genetic correlations below the diagonal and permanent environment correlations above the diagonal)<br />
Item<br />
Milk<br />
(kg)<br />
First parity Second parity Third parity<br />
Fat<br />
(kg)<br />
Protein<br />
(kg) SCS<br />
Milk<br />
(kg)<br />
Fat<br />
(kg)<br />
Protein<br />
(kg) SCS<br />
Milk<br />
(kg)<br />
Fat<br />
(kg)<br />
Protein<br />
(kg) SCS<br />
First parity<br />
Milk (kg) 0.011 −0.004 −0.007 −0.022 −0.051 −0.041 −0.042 −0.011 −0.001 0.014 0.006 −0.018<br />
Fat (kg) −0.004 0.006 −0.004 −0.022 −0.057 −0.049 −0.050 0.005 −0.009 0.006 −0.005 −0.009<br />
Protein (kg) −0.001 0.005 0.003 −0.028 −0.057 −0.046 −0.043 −0.010 −0.002 0.017 0.007 −0.031<br />
SCS 0.011 0.010 0.006 −0.007 0.005 0.006 0.009 −0.007 0.011 0.007 0.001 −0.016<br />
Second parity<br />
Milk (kg) 0.013 −0.008 −0.005 0.003 −0.010 0.004 −0.003 −0.039 −0.020 −0.010 −0.014 −0.023<br />
Fat (kg) 0.011 −0.001 0.002 −0.004 −0.005 −0.007 −0.001 −0.015 −0.020 −0.015 −0.015 −0.001<br />
Protein (kg) 0.015 0.001 −0.002 −0.013 −0.003 0.002 −0.014 −0.024 −0.021 −0.010 −0.007 −0.011<br />
SCS 0.006 −0.012 0.001 0.007 0.053 0.021 0.033 0.008 0.022 0.029 0.018 −0.019<br />
Third parity<br />
Milk (kg) 0.004 0.006 −0.001 −0.045 −0.020 −0.008 −0.019 −0.024 −0.006 0.000 −0.007 0.016<br />
Fat (kg) −0.012 0.000 −0.015 −0.050 −0.043 −0.015 −0.036 −0.044 −0.012 −0.002 −0.002 0.024<br />
Protein (kg) −0.014 −0.004 −0.019 −0.056 −0.024 −0.006 −0.020 −0.038 −0.010 −0.007 −0.007 0.021<br />
SCS 0.004 −0.012 0.009 0.031 0.057 0.018 0.045 0.009 −0.019 −0.032 −0.026 0.014<br />
<strong>for</strong> pregnancy in the CTDM without changing the current<br />
model and programs. Re-estimation <strong>of</strong> pregnancy<br />
effects is required after elimination <strong>of</strong> records <strong>for</strong> cows<br />
whose pregnancy status is not certain. Accounting <strong>for</strong><br />
pregnancy effect removed some bias from breeding<br />
value estimations. Evidence <strong>of</strong> this is seen in the results<br />
<strong>of</strong> this study, which showed that elite cows used <strong>for</strong><br />
embryo transfer (cows that had longer <strong>day</strong>s open) experienced<br />
a decline in EBV and other cows with shorter<br />
<strong>day</strong>s open experienced an increase in EBV when the<br />
data set was adjusted <strong>for</strong> pregnancy. This is expected,<br />
because these elite cows lactate without experiencing<br />
the negative environmental effect <strong>of</strong> pregnancy within<br />
the first 305 d <strong>of</strong> lactation. Meanwhile, the negative<br />
effect <strong>of</strong> pregnancy is added back onto records <strong>of</strong> other,<br />
nonelite cows. There<strong>for</strong>e, elite cows flushed <strong>for</strong> embryo<br />
transfer do not appear as genetically superior to other<br />
cows compared with when pregnancy is not accounted<br />
<strong>for</strong>. Aside from this difference, <strong>preadjusting</strong> <strong>for</strong> pregnancy<br />
did not have much <strong>of</strong> an effect on Ayrshire EBV.<br />
There<strong>for</strong>e, preadjustment <strong>of</strong> <strong>test</strong>-<strong>day</strong> records <strong>for</strong> the<br />
effect <strong>of</strong> pregnancy be<strong>for</strong>e genetic evaluations are per<strong>for</strong>med<br />
may improve the estimation <strong>of</strong> breeding values<br />
<strong>for</strong> dairy cattle, and may be applicable <strong>for</strong> use in the<br />
CTDM without having to change the current model<br />
and programs. Similar studies should be per<strong>for</strong>med on<br />
other breeds, using preadjustment factors calculated<br />
after the removal <strong>of</strong> data <strong>for</strong> animals with uncertain<br />
pregnancy status.<br />
aCKnOWLeDGmentS<br />
The authors acknowledge the DairyGen Council <strong>of</strong><br />
Canadian Dairy Network, and NSERC <strong>of</strong> Canada <strong>for</strong><br />
funding this project. Authors are also grateful to the 2<br />
anonymous reviewers <strong>for</strong> their helpful comments.
SHorT CoMMUNICATIoN: TeST-DAY YIelDS AND STAGe oF PreGNANCY<br />
reFerenCeS<br />
Akers, R. M. 2006. Major advances associated with hormone and<br />
growth factor regulation <strong>of</strong> mammary growth and lactation in<br />
dairy cows. J. Dairy Sci. 89:1222–1234.<br />
Auran, T. 1974. Studies on monthly and cumulative monthly milk yield<br />
records. II. The effect <strong>of</strong> calving interval and <strong>stage</strong> <strong>of</strong> pregnancy.<br />
Acta Agric. Scand. A 24:339–348.<br />
Bachman, K. C., M. J. Hayen, D. Morse, and C. J. Wilcox. 1988.<br />
<strong>Effect</strong> <strong>of</strong> pregnancy, milk yield, and somatic cell count on bovine<br />
milk fat hydrolysis. J. Dairy Sci. 71:925–931.<br />
Bell, A. W., R. Slepetis, and R. A. Ehrhardt. 1995. Growth and<br />
accretion <strong>of</strong> energy and protein in the gravid uterus during late<br />
pregnancy in Holstein cows. J. Dairy Sci. 78:1954–1961.<br />
Bohmanova, J., J. Jamrozik, and F. Miglior. 2008. The effect <strong>of</strong><br />
pregnancy <strong>of</strong> production traits <strong>of</strong> first lactation Holstein cows.<br />
http://cgil.uoguelph.ca/dcbgc/Agenda0804/pregnancy11.pdf<br />
Accessed April 26, 2008.<br />
Brotherstone, S., R. Thompson, and I. M. S. White. 2004. <strong>Effect</strong>s <strong>of</strong><br />
pregnancy on daily milk yield <strong>of</strong> Holstein-Friesian dairy cattle.<br />
Livest. Prod. Sci. 87:265–269.<br />
Coulon, J. B., L. Pérochon, and F. Lescourret. 1995. Modelling the<br />
effect <strong>of</strong> the <strong>stage</strong> <strong>of</strong> pregnancy on dairy cows’ milk yield. Anim.<br />
Sci. 60:401–408.<br />
Interbull. 2001. Interbull guidelines <strong>for</strong> national and international<br />
genetic evaluation systems in dairy cattle with focus on production<br />
traits. Interbull Bull. 28:1–27.<br />
Interbull. 2008. National GES in<strong>for</strong>mation. http://www-interbull.slu.<br />
se/national_ges_info2/framesida-ges.htm Accessed May 13, 2008.<br />
Leclerc, H., D. Duclos, A. Barbat, T. Druet, and V. Ducrocq. 2008.<br />
Environmental effects on lactation curves included in a <strong>test</strong>-<strong>day</strong><br />
model genetic evaluation. Animal 2:344–353.<br />
2275<br />
Loker, S., F. Miglior, J. Bohmanova, J. Jamrozik, and L. R. Schaeffer.<br />
2009. Phenotypic analysis <strong>of</strong> pregnancy effect on milk, fat, and<br />
protein <strong>yields</strong> <strong>of</strong> Canadian Ayrshire, Jersey, Brown Swiss, and<br />
Guernsey breeds. J. Dairy Sci. 92:1300–1312.<br />
Mark, T. 2004. Applied genetic evaluations <strong>for</strong> production and<br />
functional traits in dairy cattle. J. Dairy Sci. 87:2641–2652.<br />
Miglior, F., A. Sewalem, J. Jamrozik, J. Bohmanova, D. M. Lefebvre,<br />
and R. K. Moore. 2007. Genetic analysis <strong>of</strong> milk urea nitrogen<br />
and lactose and their relationships with other production traits in<br />
Canadian Holstein cattle. J. Dairy Sci. 90:2468–2479.<br />
Muir, B. L., G. Kistemaker, J. Jamrozik, and F. Canavesi. 2007.<br />
Genetic parameters <strong>for</strong> a multiple-trait multiple-lactation random<br />
regression <strong>test</strong>-<strong>day</strong> model in Italian Holsteins. J. Dairy Sci.<br />
90:1564–1574.<br />
Olori, V. E., S. Brotherstone, W. G. Hill, and B. J. McGuirk. 1997.<br />
<strong>Effect</strong> <strong>of</strong> gestation <strong>stage</strong> on milk yield and composition in Holstein<br />
Friesian dairy cattle. Livest. Prod. Sci. 52:167–176.<br />
Taylor, J. F., B. Abbitt, J. P. Walter, S. K. Davis, J. T. Jaques,<br />
and R. F. Ochoa. 1993. Estimation <strong>of</strong> genotype distributions and<br />
posterior genotype probabilities <strong>for</strong> β-mannosidosis in Salers cattle.<br />
Genetics 135:855–868.<br />
Wiggans, G. R. 1980. Contribution <strong>of</strong> <strong>day</strong>s since bred, herd average,<br />
and sample-<strong>day</strong> production to accuracy in projecting lactation<br />
records. J. Dairy Sci. 63:984–988.<br />
Wiggans, G. R., and P. M. VanRaden. 1991. Method and effect <strong>of</strong><br />
adjustment <strong>for</strong> heterogeneous variance. J. Dairy Sci. 74:4350–<br />
4357.<br />
Wilmink, J. B. M. 1987. Adjustment <strong>of</strong> lactation yield <strong>for</strong> age at calving<br />
in relation to level <strong>of</strong> production. Livest. Prod. Sci. 16:321–334.<br />
Wood, G. M., P. J. Boettcher, J. Jamrozik, G. B. Jansen, and D. F.<br />
Kelton. 2003. Estimation <strong>of</strong> genetic parameters <strong>for</strong> concentration<br />
<strong>of</strong> milk urea nitrogen. J. Dairy Sci. 86:2462–2469.<br />
Journal <strong>of</strong> Dairy Science Vol. 92 No. 5, 2009