Genetic parameters for production traits and somatic cell ... - CGIL
Genetic parameters for production traits and somatic cell ... - CGIL
Genetic parameters for production traits and somatic cell ... - CGIL

You also want an ePaper? Increase the reach of your titles
YUMPU automatically turns print PDFs into web optimized ePapers that Google loves.
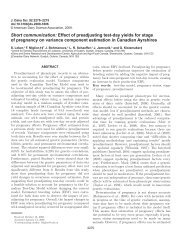
GENETIC PARAMETERS FOR PRODUCTION TRAITS<br />
AND SOMATIC CELL SCORE OF CANADIAN HOLSTEINS<br />
WITH MULTIPLE TRAIT RANDOM REGRESSION MODEL<br />
J.Jamrozik, L.R.Schaeffer <strong>and</strong> F.Grignola<br />
Centre <strong>for</strong> <strong>Genetic</strong> Improvement of Livestock<br />
Department of Animal <strong>and</strong> Poultrv Science<br />
Universitv . of Guelph, Guelph. ON. Can&la. N 1G 2W 1<br />
SUMMARY<br />
Multiple trait r<strong>and</strong>om regression model was applied to test day records of milk. fat, protein<br />
<strong>and</strong> <strong>somatic</strong> <strong>cell</strong> score in tlte first three lactations of Canadian Holsteins. Linear model <strong>for</strong><br />
each of 12 simuhaneously analysed <strong>traits</strong> included herd-test date (fixed), permanent<br />
efivironment (r<strong>and</strong>om) <strong>and</strong> fixed <strong>and</strong> r<strong>and</strong>om regressions. with three covariates. Gibbs<br />
sampling method was used to generate samples from marginal posterior distributions of 864<br />
(co)variance components. Production <strong>traits</strong> <strong>and</strong> <strong>somatic</strong> <strong>cell</strong> score in first three lactations<br />
were characterised in terms of genetic <strong>and</strong> environmental correlations on 3054 basis.<br />
Examples of estimated genetic covariance functions <strong>for</strong> selected combinations of <strong>traits</strong> are<br />
presented.<br />
9<br />
Keywords: test day e yields, r<strong>and</strong>om regression model. genetic <strong>parameters</strong><br />
INTRODUCTION<br />
R<strong>and</strong>om regression (RR) models have been suggested <strong>for</strong> genetic analysis of test day (TD)<br />
yields (24h measurements) by Schaeffer <strong>and</strong> Dekkers (1994) because of their ability to model<br />
a separate lactation curve <strong>for</strong> every animal. Single trait RR models were applied to first<br />
lactation milk, fat <strong>and</strong> protein TD data with different functions <strong>for</strong> fixed <strong>and</strong> r<strong>and</strong>om<br />
regressions (Jamrozik <strong>and</strong> Schaeffer 1997. Jamrozik et nl. 1997a. 1997b). In the simulation<br />
study of Kistemaker (1997) RR models were significantly better than an analysis of 305d<br />
gelds in terms of correlation between estimated <strong>and</strong> true breeding values.<br />
changes occurring in Canadian milk recording systems will require an application of<br />
multiple trait test day model in genetic evaluations <strong>for</strong> milk, fat, protein <strong>and</strong> <strong>somatic</strong> <strong>cell</strong><br />
score (SCS) TD records. In addition. analysing data from Werent lactations as separate <strong>traits</strong><br />
wit1 account <strong>for</strong> selection <strong>and</strong> culling on correlated <strong>traits</strong> both within <strong>and</strong> between lactations.<br />
The objectives of this study were to estimate variance <strong>and</strong> covariance components of the<br />
multiple lactation, multipIe trait RR model <strong>and</strong> to character& genetic aspects of dairy<br />
<strong>production</strong> in the first three lactations of Canadian Holsteins.<br />
MATERIAL AND METHODS<br />
Data consisted of TD records on milk (kg), fat (kg), protein (kg) <strong>and</strong> SCS (on the lo& scale)<br />
from the first three lactations of Canadian Holsteins from Ontario <strong>and</strong> Quebec. Two disjoint<br />
subsamples of data were created by r<strong>and</strong>om selection of herds with at least 300 TD records.<br />
All four <strong>traits</strong> were required to be recorded on each test day between 5 <strong>and</strong> 305 days in milk<br />
(DIM). Cows had to have at least one first lactation TD record with their first calving be<strong>for</strong>e<br />
January 1, 1993. Age at calving 3pas restricted to 18 - 68 months. Cows were assigned to one<br />
of four subclasses <strong>for</strong> age at calving within lactations <strong>and</strong> td one of two seasons of calving<br />
(September - February, March-August). Combined with region (Ontario, Quebec) this gave<br />
48 region-age-season subclasses within lactation. A summary of the data is given in Table 1.
,<br />
Tahlel. Characteristics of two subsets of Holstein data<br />
Cows with records<br />
Sires<br />
Animals<br />
TD records<br />
Lact 1<br />
Lact 2<br />
Lact 3<br />
Total<br />
Herd-test date subclasses<br />
Lact 1<br />
Lact 2<br />
Lact 3<br />
Data I Data II<br />
3297<br />
884<br />
10.876<br />
27.196 25.785<br />
20.149 17.337<br />
13.466 11.648<br />
60.8 I 1 54.770<br />
3032 - 4703<br />
3384 4627<br />
3278 4063<br />
Data was analysed by a multiple trait model in which TD milk. fat, <strong>and</strong> protein yields <strong>and</strong><br />
SCS in merent lactations were considered as different <strong>traits</strong>. The model equation was<br />
assumed to be the Same <strong>for</strong> each parity - trait combination. For trait h in lactation n it was<br />
yhtijkl = HTbi + &h&171 + Cahj&t, + Phnj + 4mtijll? wherf?<br />
yhtbu is record. 1 on cow j made on day t within herd-test day effect i, <strong>for</strong> a cow belonging to<br />
subclass k <strong>for</strong> region, age, <strong>and</strong> season of calving, Hm”i is fixed herd-test day effect, bhn)n are<br />
fixed regression coefficients specific to subclass k, ah+ are r<strong>and</strong>om regression coefficients<br />
specific to cow j, bj is r<strong>and</strong>om permanent environmental (PE) effect, ki~u is residual effect<br />
<strong>for</strong> each observation? zt, are covariates. I assumed to be the same <strong>for</strong> both fixed <strong>and</strong> r<strong>and</strong>om<br />
regressions.<br />
Wilmink’s function (1987) was chosen to describe the shape of lactation curves. The function<br />
is W(t) = wgto + wlztl + w2zt2 where ztO = 1, ztl = t, zt2 = exp(-O.O5t).<br />
Let pj represent the 12 by 1 vector of PE effect <strong>for</strong> cow j with covariance matrix P. PE effect<br />
was assumed to be constant <strong>for</strong> all DIM during lactation. The PE covariance matrix <strong>for</strong> all<br />
animals was IQPP. For aj, the vector of 36 by 1 r<strong>and</strong>om regression coefficients <strong>for</strong> animal j, the<br />
covariance matrix was G. AQPG was the genetic covariance matrix <strong>for</strong> all animals with A<br />
being the additive relationship matrixThe residual covariance matrix between <strong>traits</strong> on the<br />
same TD was I&. Different residual covariances were allowed <strong>for</strong> different lactations (n) <strong>and</strong><br />
time periods within lactation (t), defined as 5 to 45 DIM, 45 to 115 DIM, 116 to 265 DIM,<br />
<strong>and</strong> 266 to 305 DIM. Residual effects on different DIM were uncorrelated both within <strong>and</strong><br />
between cows.<br />
There were 666 different genetic (co)variances, 78 PE (co)variances <strong>and</strong> 120 residual<br />
(co)variances to be estimated <strong>for</strong> the model. A Bayesian approach using Gibbs sampling was<br />
taken to obtain the means of the marginal posterior distributions <strong>for</strong> all <strong>parameters</strong> of the<br />
model <strong>and</strong> selected functions of these <strong>parameters</strong>. The method used was the generalisation of<br />
Jamrozik <strong>and</strong> Schaeffer’s (1997) approach <strong>for</strong> the single trait case. Blocked sampling with<br />
multivariate normal <strong>and</strong> inverted, Wishart distributions was used. A chain of 2 1,000 samples<br />
was generated <strong>for</strong> each data set. The first 1000 samples were discarded as the burn-in period.<br />
The mean effective sample size over all single chain (co)variances <strong>for</strong> the thinned samples<br />
was 490 with a range from 30 to 6400 (average values <strong>for</strong> two data sets). The mean relative
squared difference between (co)variance estimates from two data sets was 3%. The resulting<br />
<strong>parameters</strong> were there<strong>for</strong>e estimated based ou the samples from two data sets (40,000 samples<br />
in total).<br />
RESULTS AND DISCUSSION<br />
There were 864 different (co)variance components estimated <strong>for</strong> the multiple trait RR model.<br />
They could be used to describe different characteristics of dairy <strong>production</strong> <strong>traits</strong> <strong>and</strong> ‘SCS<br />
within <strong>and</strong> between lactations. Traits could be expressed on a 305d basis, as part lactation<br />
yields or as daily yields. Results presented in this paper are restricted to selected aspects of<br />
dairy <strong>production</strong> during first three lactations..<br />
Coefficients of genetic covariance function, <strong>and</strong> PE <strong>and</strong> residual (co)variances <strong>for</strong> milk yield<br />
(kg) in the first three lactations are shown in Table 2. Estimates of (@variance components<br />
differed between first <strong>and</strong> later lactations. Residual variances were largest at the beginning<br />
<strong>and</strong> at the end of 3OSd interval. PE variances did not change significantly from first to later<br />
lactations. (Co)variances <strong>for</strong> fat, protein <strong>and</strong> SCS showed similar pattern of behaviour<br />
between <strong>and</strong> within lactations.<br />
PE efkct was modelled as a constant value <strong>for</strong> all DIM in lactation. Using a function with<br />
r<strong>and</strong>om regression coefficients to model this effect might change the partition of the total<br />
variance into different components. <strong>Genetic</strong> covariance as we11 as genetic correlation<br />
functions could be plotted <strong>for</strong> any parity-trait combinations thus allowing the analysis of the<br />
pattern of genetic {co)variabilitv . between <strong>traits</strong> during the course of lactations. -<br />
Table 2. Estimatei of (co)variances <strong>for</strong> r<strong>and</strong>om regression coefficients, PE effects <strong>and</strong><br />
residuals <strong>for</strong> milk yield (kg) in first three lactations of Canadian Holsteins<br />
Lact 1 Lact 2 Lact 3<br />
a0 a1 a2 a0 a1 a2 a0 a1 a2<br />
ac, 20.55 hle-2 -22.64 40.27 -0.15 -41.83 47.03 -0.18 -52.64<br />
a1 3.17e-4 4.97e-2 8.58e-4 0. I3 I .05e-3 0.16<br />
a2 59.38 93.40 136.89<br />
PE 4.03 5.51 6.45<br />
es-45 5.95 10.55 16.42<br />
%-1 15 3.97 6.62 8.45<br />
el16-265 3.08 4.48 4.86<br />
e266305 4.89 7.51 * 8.13<br />
Table 3 contains the genetic (above diagonal) <strong>and</strong> PE (below diagonal) correlations between<br />
<strong>traits</strong> on a 305d basis <strong>for</strong> milk, fat <strong>and</strong> protein yields, <strong>and</strong> on average daily basis <strong>for</strong> SCS, as<br />
well as average daily genetic variances <strong>for</strong> all <strong>traits</strong> (diagonal elements). Mean daily genetic<br />
variances tend to increase with lactation number. Larger diflerences were observed between<br />
first <strong>and</strong> later lactations than between second <strong>and</strong> third lactation. Estimates of genetic <strong>and</strong><br />
environmental correlations folldwed the general pattern reported in other studies. Milk, fat<br />
<strong>and</strong> protein were all positively <strong>and</strong> highly correlated within-lactation on the 305d basis with<br />
the largest correlations between milk <strong>and</strong> protein yields, Within trait genetic correlations<br />
between lactations were smaller than other reported estimates, especially <strong>for</strong> SCS (Mrode <strong>and</strong>
Swanson 1996). <strong>Genetic</strong> correlation between <strong>production</strong> <strong>traits</strong> <strong>and</strong> SCS were small <strong>and</strong><br />
positive (unfavourable) in first <strong>and</strong> negative in second <strong>and</strong> third lactations. This could be<br />
explained as an effect of culling in the first parity on the basis of mastitis <strong>and</strong> <strong>production</strong>. All<br />
within lactation environmental correlations between <strong>production</strong> <strong>traits</strong> <strong>and</strong> SCS were negative.<br />
Multiple trait model applied in this study could allow <strong>for</strong> a comprehensive description of<br />
genetic <strong>and</strong> environmental relationships between <strong>production</strong> <strong>traits</strong> <strong>and</strong> SCS in different<br />
parities.<br />
Estimates of (co)variances obtained in this studs will be used as <strong>parameters</strong> <strong>for</strong> multiple trait<br />
r<strong>and</strong>om regression model <strong>for</strong> genetic evaluatioh of Holstein bulls <strong>and</strong> cows <strong>for</strong> <strong>production</strong><br />
<strong>traits</strong> <strong>and</strong> SCS in Canada.<br />
Table3. Correlations (x100) <strong>for</strong> 305d yield <strong>traits</strong> <strong>and</strong> average daily SCS (genetic<br />
correlations above diagonal, PE correlations below diagonal) <strong>and</strong> average daily genetic<br />
variances <strong>for</strong> milk (M), fat (F), protein (P) (in kg) <strong>and</strong> SCS (S) in first (I), second (2) <strong>and</strong><br />
third (3) lactations (diagonal elements)<br />
1M IF 1P 1S 2M 2F 2P 2s 3M 3F 3P 3s<br />
1M 7.8 69 92 7 70 45 67 12 63 34 54 12<br />
1F 84 0.009 79 1 42 68 55 IO 38 60 45 5<br />
1P 95 89 0?006 6 62 50 71 14 56 42 60 8<br />
1s -28 -20 -20 0.59 4 -2 2 48 4 2 4 34<br />
2M 53 49 55 -18 13.9 76 94 -20 76 49 67 -4<br />
2F 38 60 49 -10 85 ‘0.02 83 -25 57 75 61 -11<br />
2P 48 51 56 -13 96 91 0.01 -19 73 9 76 -7<br />
2s -12 -14 -12 39 -24 -23 -20 0.84 -15 -17 -14 48<br />
3M 47 39 46 -12 51 38 48 -5 14.2 75 94 -20<br />
3F 34 52 43 -5 43 57 50 -5 84 0.02 82 -25<br />
3P 44 46 51 -8 51 48 57 -4 94 92 0.01 -20<br />
3s -17 -9 -9 31 -21 -11 -14 53 -29 -22 -20 1.09<br />
ACKNOWLEDGMENTS<br />
The authors acknowledge the financial support of the Ontario Ministry of Agriculture, Food ,<br />
<strong>and</strong> Rural Affairs, the Cattle Breeding Research Council of Canada; <strong>and</strong> the Natural Science<br />
<strong>and</strong> Engineering Research Council<br />
REFERENCES<br />
Jamrozik, J., Kistemaker, G.J., Dekkers? J.C.M. <strong>and</strong> Schaeffer, L.R. (1997a) J. Dairy Sci.<br />
(in print)<br />
Jamrozik, J. <strong>and</strong> Schaeffer. L.R. (1997) J. Dairv Sci. 80:762-770.<br />
Jamrozik. J.. Schaeffer, L.R. <strong>and</strong> Dekkers. J.C.M. (1997b) ,/. Dairv Ski. 80: 12 17-l 226.<br />
Kistemaker, G. J. (1997) PhD Thesis, University of GucIph. <br />
Mrode, R.A. <strong>and</strong> Swanson, G.J.T, (1996) Anim. Breed. Ah. 64:847-857.<br />
Schaeffer, L.R. <strong>and</strong> Dekkers, J.C.M. (1994) Proc. 5* WCGALP Guelph, Canada, l&443-<br />
446.<br />
Wilmie J.B.M. (1987) Livesf. Prod. Ski. 17:2 1 l-2 17.