Test-day fat to protein ratio as an indicator trait for sub-clinical ...
Test-day fat to protein ratio as an indicator trait for sub-clinical ...
Test-day fat to protein ratio as an indicator trait for sub-clinical ...

Create successful ePaper yourself
Turn your PDF publications into a flip-book with our unique Google optimized e-Paper software.
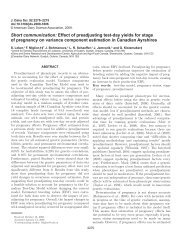
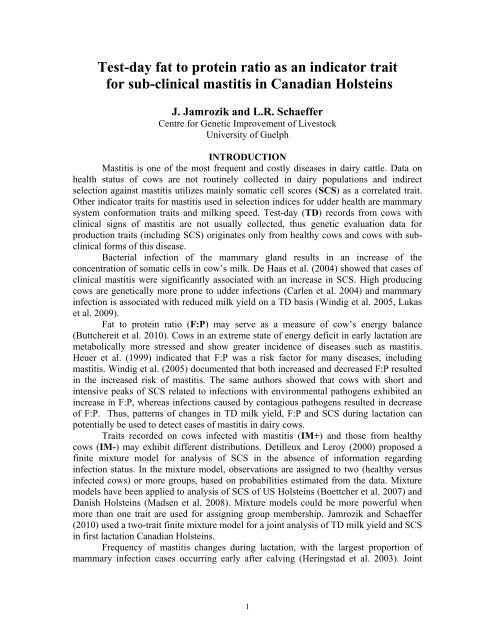
<strong>Test</strong>-<strong>day</strong> <strong>fat</strong> <strong>to</strong> <strong>protein</strong> <strong>ratio</strong> <strong>as</strong> <strong>an</strong> indica<strong>to</strong>r <strong>trait</strong><br />
<strong>for</strong> <strong>sub</strong>-<strong>clinical</strong> m<strong>as</strong>titis in C<strong>an</strong>adi<strong>an</strong> Holsteins<br />
J. Jamrozik <strong>an</strong>d L.R. Schaeffer<br />
Centre <strong>for</strong> Genetic Improvement of Lives<strong>to</strong>ck<br />
University of Guelph<br />
INTRODUCTION<br />
M<strong>as</strong>titis is one of the most frequent <strong>an</strong>d costly dise<strong>as</strong>es in dairy cattle. Data on<br />
health status of cows are not routinely collected in dairy populations <strong>an</strong>d indirect<br />
selection against m<strong>as</strong>titis utilizes mainly somatic cell scores (SCS) <strong>as</strong> a correlated <strong>trait</strong>.<br />
Other indica<strong>to</strong>r <strong>trait</strong>s <strong>for</strong> m<strong>as</strong>titis used in selection indices <strong>for</strong> udder health are mammary<br />
system con<strong>for</strong>mation <strong>trait</strong>s <strong>an</strong>d milking speed. <strong>Test</strong>-<strong>day</strong> (TD) records from cows with<br />
<strong>clinical</strong> signs of m<strong>as</strong>titis are not usually collected, thus genetic evaluation data <strong>for</strong><br />
production <strong>trait</strong>s (including SCS) originates only from healthy cows <strong>an</strong>d cows with <strong>sub</strong><strong>clinical</strong><br />
<strong>for</strong>ms of this dise<strong>as</strong>e.<br />
Bacterial infection of the mammary gl<strong>an</strong>d results in <strong>an</strong> incre<strong>as</strong>e of the<br />
concent<strong>ratio</strong>n of somatic cells in cow’s milk. De Ha<strong>as</strong> et al. (2004) showed that c<strong>as</strong>es of<br />
<strong>clinical</strong> m<strong>as</strong>titis were signific<strong>an</strong>tly <strong>as</strong>sociated with <strong>an</strong> incre<strong>as</strong>e in SCS. High producing<br />
cows are genetically more prone <strong>to</strong> udder infections (Carlen et al. 2004) <strong>an</strong>d mammary<br />
infection is <strong>as</strong>sociated with reduced milk yield on a TD b<strong>as</strong>is (Windig et al. 2005, Luk<strong>as</strong><br />
et al. 2009).<br />
Fat <strong>to</strong> <strong>protein</strong> <strong>ratio</strong> (F:P) may serve <strong>as</strong> a me<strong>as</strong>ure of cow’s energy bal<strong>an</strong>ce<br />
(Buttchereit et al. 2010). Cows in <strong>an</strong> extreme state of energy deficit in early lactation are<br />
metabolically more stressed <strong>an</strong>d show greater incidence of dise<strong>as</strong>es such <strong>as</strong> m<strong>as</strong>titis.<br />
Heuer et al. (1999) indicated that F:P w<strong>as</strong> a risk fac<strong>to</strong>r <strong>for</strong> m<strong>an</strong>y dise<strong>as</strong>es, including<br />
m<strong>as</strong>titis. Windig et al. (2005) documented that both incre<strong>as</strong>ed <strong>an</strong>d decre<strong>as</strong>ed F:P resulted<br />
in the incre<strong>as</strong>ed risk of m<strong>as</strong>titis. The same authors showed that cows with short <strong>an</strong>d<br />
intensive peaks of SCS related <strong>to</strong> infections with environmental pathogens exhibited <strong>an</strong><br />
incre<strong>as</strong>e in F:P, where<strong>as</strong> infections caused by contagious pathogens resulted in decre<strong>as</strong>e<br />
of F:P. Thus, patterns of ch<strong>an</strong>ges in TD milk yield, F:P <strong>an</strong>d SCS during lactation c<strong>an</strong><br />
potentially be used <strong>to</strong> detect c<strong>as</strong>es of m<strong>as</strong>titis in dairy cows.<br />
Traits recorded on cows infected with m<strong>as</strong>titis (IM+) <strong>an</strong>d those from healthy<br />
cows (IM-) may exhibit different distributions. Detilleux <strong>an</strong>d Leroy (2000) proposed a<br />
finite mixture model <strong>for</strong> <strong>an</strong>alysis of SCS in the absence of in<strong>for</strong>mation regarding<br />
infection status. In the mixture model, observations are <strong>as</strong>signed <strong>to</strong> two (healthy versus<br />
infected cows) or more groups, b<strong>as</strong>ed on probabilities estimated from the data. Mixture<br />
models have been applied <strong>to</strong> <strong>an</strong>alysis of SCS of US Holsteins (Boettcher et al. 2007) <strong>an</strong>d<br />
D<strong>an</strong>ish Holsteins (Madsen et al. 2008). Mixture models could be more powerful when<br />
more th<strong>an</strong> one <strong>trait</strong> are used <strong>for</strong> <strong>as</strong>signing group membership. Jamrozik <strong>an</strong>d Schaeffer<br />
(2010) used a two-<strong>trait</strong> finite mixture model <strong>for</strong> a joint <strong>an</strong>alysis of TD milk yield <strong>an</strong>d SCS<br />
in first lactation C<strong>an</strong>adi<strong>an</strong> Holsteins.<br />
Frequency of m<strong>as</strong>titis ch<strong>an</strong>ges during lactation, with the largest proportion of<br />
mammary infection c<strong>as</strong>es occurring early after calving (Heringstad et al. 2003). Joint<br />
1
distributions of milk yield, F:P <strong>an</strong>d SCS may there<strong>for</strong>e also be different in different parts<br />
of lactation.<br />
The objectives of this research were <strong>to</strong> <strong>an</strong>alyze first lactation TD milk yield, F:P<br />
<strong>an</strong>d SCS of C<strong>an</strong>adi<strong>an</strong> Holsteins cows with a three-<strong>trait</strong> normal mixture r<strong>an</strong>dom regression<br />
model, allowing <strong>for</strong> heterogeneity of distributions in different parts of lactation. Genetic<br />
parameters were estimated on lactational <strong>an</strong>d daily b<strong>as</strong>es, <strong>an</strong>d distributions of data from<br />
IM- <strong>an</strong>d IM+ categories were characterized.<br />
MATERIAL AND METHODS<br />
Data<br />
C<strong>an</strong>adi<strong>an</strong> Holstein first lactation TD data with calving years from 1988 <strong>to</strong> 2007<br />
were obtained from the C<strong>an</strong>adi<strong>an</strong> Dairy Network. A small data set w<strong>as</strong> selected by<br />
r<strong>an</strong>dom sampling of herds with minimum of 50 cows each, <strong>an</strong>d with minimum of 7 TD<br />
records per cow. This resulted in 214,813 TD milk (kg), F:P <strong>an</strong>d SCS records on 25,950<br />
cows. Each cow had all three <strong>trait</strong>s recorded on a given TD. Days in milk (DIM) were<br />
from 5 <strong>to</strong> 305. Daily averages with corresponding vari<strong>an</strong>ces are plotted in Figures 1 - 3<br />
<strong>for</strong> milk, F:P <strong>an</strong>d SCS, respectively. The number of herd – test-<strong>day</strong> (HTD) cl<strong>as</strong>ses w<strong>as</strong><br />
23,984 <strong>an</strong>d there were 80 levels of region – age – se<strong>as</strong>on of calving (RAS). Pedigree<br />
data included 66,244 <strong>an</strong>imals. The same edited data set w<strong>as</strong> previously used by Jamrozik<br />
<strong>an</strong>d Schaeffer (2010) <strong>for</strong> fitting a two-<strong>trait</strong> mixture model.<br />
DIM were split in<strong>to</strong> 30 disjoint intervals: 5 – 15 DIM, <strong>an</strong>d 29 intervals each of<br />
length of 10 DIM <strong>for</strong> <strong>day</strong>s from 16 <strong>to</strong> 305. Records were relatively well distributed across<br />
DIM intervals <strong>as</strong> well <strong>as</strong> <strong>day</strong>s in lactation. Number of TD records in the first DIM<br />
interval w<strong>as</strong> equal <strong>to</strong> 6731; the remaining intervals included from 5890 <strong>to</strong> 7610 records.<br />
The 5 th <strong>an</strong>d 305 th DIM had 503 <strong>an</strong>d 508 TD records, respectively; the largest number of<br />
records (805) w<strong>as</strong> <strong>for</strong> the 228 th <strong>day</strong> of lactation.<br />
Model<br />
The finite mixture model <strong>as</strong>signs records of milk, F:P <strong>an</strong>d SCS on a given TD in<strong>to</strong><br />
one of the two components, depending on the unknown health status of the cows. Group<br />
membership (healthy or infected) of the j-th record in the i-th DIM interval w<strong>as</strong> defined<br />
by a binary vec<strong>to</strong>r zi where zij = 0 (1) indicated a record from <strong>an</strong> IM- (IM+) cow. The<br />
equation <strong>for</strong> the mixture model c<strong>an</strong> be written following Ødegård et al. (2003) <strong>as</strong>:<br />
yi = X0i 0 + Mzi X1i 1i + Zi a + Wi p + ei,<br />
where yi = vec<strong>to</strong>r of observations (milk, F:P <strong>an</strong>d SCS) in the i-th DIM interval, 0 =<br />
vec<strong>to</strong>r of fixed effects common <strong>to</strong> all records in all DIM intervals, 1i = vec<strong>to</strong>r of fixed<br />
effect corresponding <strong>to</strong> data from infected cows, a = vec<strong>to</strong>r of r<strong>an</strong>dom <strong>an</strong>imal additive<br />
genetic effects, p = vec<strong>to</strong>r of r<strong>an</strong>dom perm<strong>an</strong>ent environmental (PE) effects, ei = vec<strong>to</strong>r<br />
of r<strong>an</strong>dom residuals, Mzi = matrix with diagonal elements of zij, <strong>an</strong>d X0i, X1i, Zi, Wi =<br />
known incidence matrices. The fixed effects in 0 were HTD effects <strong>an</strong>d regression on<br />
DIM within RAS levels, <strong>an</strong>d elements of 1i included me<strong>an</strong> differences between ‘sick’<br />
<strong>an</strong>d ‘healthy’ components <strong>for</strong> milk, F:P <strong>an</strong>d SCS. Additive genetic <strong>an</strong>d PE effects were<br />
regressions on DIM; all regressions (fixed <strong>an</strong>d r<strong>an</strong>dom) were modeled with orthogonal<br />
Legendre polynomials of order 4. Residuals of records on different TD were<br />
uncorrelated. The conditional distribution of yi w<strong>as</strong> <strong>as</strong>sumed <strong>to</strong> be:<br />
yi | 0, 1i, a, p, Ri, zi ~ N[ X0i 0 + Mz X1i 1i + Zi a + Wi p, Ri],<br />
2
where Ri= (Ii - Mzi) Ri0 + Mzi Ri1; Ri0 <strong>an</strong>d Ri1 are residual co-vari<strong>an</strong>ce matrices <strong>for</strong><br />
IM- <strong>an</strong>d IM+ records, respectively.<br />
Proper normal distributions (me<strong>an</strong> = 0 <strong>an</strong>d vari<strong>an</strong>ce = 10,000) were <strong>as</strong>sumed <strong>for</strong><br />
all fixed effects. R<strong>an</strong>dom effects were also a priori normally distributed, conditionally on<br />
genetic <strong>an</strong>d PE co-vari<strong>an</strong>ce components. Elements of zi were <strong>as</strong>sumed <strong>to</strong> be independent<br />
<strong>an</strong>d following the same Bernoulli distribution, Br(Pi), where Pi w<strong>as</strong> the proportion of<br />
IM+ records (stage-specific mixing proportion). Priors <strong>for</strong> co-vari<strong>an</strong>ce components were<br />
independent inverted Wishart distributions with minimal numbers of degrees of freedom,<br />
<strong>an</strong>d prior distributions <strong>for</strong> Pi were beta distribution with both hyper-parameters equal <strong>to</strong><br />
2.<br />
Methods<br />
Gibbs sampling scheme <strong>for</strong> the single-<strong>trait</strong> two-component mixture model<br />
(Ødegård et al. 2003) w<strong>as</strong> generalized <strong>for</strong> the multiple-<strong>trait</strong> scenario <strong>an</strong>d a heterogeneous<br />
data structure. All fully conditional distributions were: multivariate normal <strong>for</strong> location<br />
parameters, inverted Wishart <strong>for</strong> co-vari<strong>an</strong>ce components, Bernoulli <strong>for</strong> the group<br />
memberships, <strong>an</strong>d beta distributions <strong>for</strong> the mixing proportions. Single chain of 120,000<br />
samples w<strong>as</strong> generated; convergence of Gibbs chains w<strong>as</strong> determined by visual<br />
inspection of trace plots <strong>for</strong> selected parameters. All posterior inferences were b<strong>as</strong>ed on<br />
100,000 samples after burn-in.<br />
Heritabilities, genetic <strong>an</strong>d environmental correlations were estimated <strong>for</strong> the first<br />
regression coefficient of the lactation curve. This coefficient determines the overall level<br />
of lactation curves <strong>an</strong>d is equivalent <strong>to</strong> the cumulative (or average daily) yield <strong>for</strong> a <strong>trait</strong><br />
across lactation (Jamrozik et al. 2002). Heritability of the regression coefficient w<strong>as</strong><br />
defined <strong>as</strong> a <strong>ratio</strong> of genetic <strong>an</strong>d the sum of genetic <strong>an</strong>d PE vari<strong>an</strong>ces, following the<br />
Bayesi<strong>an</strong> hierarchical TD model approach (Jamrozik et al. 2001). Heritabilities, genetic<br />
<strong>an</strong>d PE correlations between <strong>trait</strong>s were also estimated <strong>for</strong> every <strong>day</strong> of lactation, <strong>as</strong> time<br />
depend<strong>an</strong>t parameters. In this c<strong>as</strong>e, the <strong>to</strong>tal daily phenotypic vari<strong>an</strong>ce included a residual<br />
component. Heritability of a Gaussi<strong>an</strong> <strong>trait</strong> does not depend on a me<strong>an</strong> value of the <strong>trait</strong>.<br />
For a <strong>trait</strong> following a mixture distribution, heritability depends on component-specific<br />
vari<strong>an</strong>ces, mixing proportions (P) <strong>an</strong>d on me<strong>an</strong> values of mixture components. Residual<br />
vari<strong>an</strong>ces <strong>for</strong> the mixture (within each DIM interval) were there<strong>for</strong>e estimated following<br />
Gi<strong>an</strong>ola et al. (2006) <strong>as</strong>:<br />
2 e = PIM- 2 IM- + PIM+ 2 IM+ + b0PIM-PIM+,<br />
where b0 w<strong>as</strong> the estimate of me<strong>an</strong> difference between IM- <strong>an</strong>d IM+ groups, PIM- ( 2 IM-)<br />
<strong>an</strong>d PIM+ ( 2 IM+) were proportion of records (residual vari<strong>an</strong>ce) <strong>for</strong> healthy <strong>an</strong>d infected<br />
records, respectively. Genetic <strong>an</strong>d PE components of vari<strong>an</strong>ce were <strong>as</strong>sumed<br />
homogeneous across mixture components.<br />
Results<br />
Average lactation curves <strong>for</strong> milk <strong>an</strong>d SCS followed typical shapes <strong>for</strong> these <strong>trait</strong>s<br />
(Figures 1 <strong>an</strong>d 3). Lactation curve <strong>for</strong> F:P (Figure 2) w<strong>as</strong> of a similar shape <strong>to</strong> SCS curve:<br />
largest values on DIM immediately after calving, decre<strong>as</strong>e <strong>to</strong>wards the peak of lactation<br />
<strong>for</strong> milk yield, <strong>an</strong>d steady but slow incre<strong>as</strong>e with the progression of lactation. Daily<br />
variation of F:P w<strong>as</strong> more uni<strong>for</strong>m th<strong>an</strong> patterns of vari<strong>an</strong>ces <strong>for</strong> the other two <strong>trait</strong>s.<br />
3
Proportion of TD records from cows infected with putative, <strong>sub</strong>-<strong>clinical</strong> m<strong>as</strong>titis<br />
w<strong>as</strong> 0.66 in DIM from 5 <strong>to</strong> 15 (Figure 4), decre<strong>as</strong>ing <strong>to</strong> 0.19 in DIM from 36 <strong>to</strong> 45 <strong>an</strong>d<br />
staying relatively const<strong>an</strong>t at this level, dropping <strong>to</strong> 0.13 at the end of lactation (Figure 4).<br />
Posterior st<strong>an</strong>dard deviations <strong>for</strong> mixing proportions were 0.02 <strong>for</strong> the first DIM interval<br />
<strong>an</strong>d around 0.01 <strong>for</strong> the remaining intervals.<br />
Average differences between IM+ <strong>an</strong>d IM- groups <strong>an</strong>d estimates of residual<br />
vari<strong>an</strong>ces by DIM interval are in Figures 5 – 7 <strong>for</strong> milk, F:P <strong>an</strong>d SCS, respectively. Cows<br />
infected with m<strong>as</strong>titis were characterized by smaller daily milk yield (up <strong>to</strong> 5 kg on DIM<br />
from 5 <strong>to</strong> 15), larger F:P (up <strong>to</strong> 0.13 on DIM from 26 <strong>to</strong> 35) <strong>an</strong>d larger SCS (up <strong>to</strong> 1.3 on<br />
DIM from 16 <strong>to</strong> 25). Differences between me<strong>an</strong> values <strong>for</strong> mixture distributions were<br />
relatively uni<strong>for</strong>m in DIM intervals <strong>for</strong> milk <strong>an</strong>d SCS. The effect of putative m<strong>as</strong>titis on<br />
F:P different parts of lactation followed, in general, the shape of lactation curve <strong>for</strong> milk<br />
yield.<br />
Estimates of residual vari<strong>an</strong>ces differed <strong>sub</strong>st<strong>an</strong>tially between mixture<br />
components <strong>for</strong> all <strong>trait</strong>s (Figures 5 – 7). Residual vari<strong>an</strong>ces <strong>for</strong> records from healthy<br />
cows were smaller <strong>an</strong>d more uni<strong>for</strong>m across lactation th<strong>an</strong> corresponding values <strong>for</strong><br />
m<strong>as</strong>titic cows. General shapes of the vari<strong>an</strong>ce curves <strong>for</strong> IM+ categories were similar <strong>to</strong><br />
lactation curves <strong>for</strong> milk yield. Residual correlations between F:P <strong>an</strong>d SCS in IM-<br />
category were all positive <strong>an</strong>d small (250) w<strong>as</strong><br />
characterized by slightly negative genetic correlations between F:P <strong>an</strong>d SCS. Daily<br />
correlations <strong>for</strong> the PE effect among <strong>trait</strong>s were small <strong>an</strong>d mostly negative (Figure 11).<br />
Milk <strong>an</strong>d F:P were slightly positively correlated at the beginning of lactation (DIM
DISCUSSION<br />
Ch<strong>an</strong>ges in SCS <strong>an</strong>d milk yield are well known indica<strong>to</strong>rs of mammary infection<br />
in dairy cattle. Clinical m<strong>as</strong>titis is relatively e<strong>as</strong>y <strong>to</strong> detect, <strong>as</strong> the milk or udder is<br />
abnormal <strong>an</strong>d systemic signs of a dise<strong>as</strong>e are present. In contr<strong>as</strong>t, <strong>sub</strong>-<strong>clinical</strong> m<strong>as</strong>titis is<br />
<strong>an</strong> infection that occurs without obvious <strong>clinical</strong> signs such <strong>as</strong> abnormal milk, udder<br />
swelling or tenderness, <strong>an</strong>d fever. Somatic cells consist mainly of immune cells that enter<br />
the udder. When infection of the udder occurs, the number of immune cells incre<strong>as</strong>es<br />
rapidly, <strong>as</strong> the immune system attempts <strong>to</strong> overcome the infection. Simult<strong>an</strong>eously, milk<br />
yield decre<strong>as</strong>es <strong>as</strong> the <strong>an</strong>imal is under the stress of coping with infection. Once the<br />
infection h<strong>as</strong> been cleared, the SCC levels <strong>an</strong>d the milk yield gradually return <strong>to</strong> normal<br />
levels. Early lactation is <strong>as</strong>sociated with <strong>an</strong> energy deficit in a high producing dairy cow.<br />
Feed intake does not compensate energy losses <strong>as</strong>sociated with milk production <strong>an</strong>d a<br />
cow enters a negative energy bal<strong>an</strong>ce. An energy deficit leads <strong>to</strong> <strong>an</strong> incre<strong>as</strong>e <strong>fat</strong> synthesis<br />
in the udder, <strong>an</strong>d inadequate intake of carbohydrates c<strong>an</strong> cause <strong>an</strong> insufficient <strong>protein</strong><br />
synthesis by ruminal bacteria resulting in a decre<strong>as</strong>e of milk <strong>protein</strong> content (Butthereit et<br />
al. 2010; after Gürtler <strong>an</strong>d Schweigert, 2005). Thus F:P may be <strong>an</strong> e<strong>as</strong>y <strong>to</strong>ol <strong>to</strong><br />
differentiate between cows that c<strong>an</strong> or c<strong>an</strong>not cope with the challenges of <strong>an</strong> early<br />
lactation.<br />
The mixture model <strong>for</strong> milk, F:P <strong>an</strong>d SCS used in this study w<strong>as</strong> <strong>an</strong> extension of a<br />
two <strong>trait</strong> specification <strong>for</strong> milk <strong>an</strong>d SCS applied <strong>to</strong> the same data by Jamrozik <strong>an</strong>d<br />
Schaeffer (2010). In addition <strong>to</strong> adding one more <strong>trait</strong>, the lactation length w<strong>as</strong> split in<strong>to</strong><br />
more intervals in the current study (30 vs. 4) allowing <strong>for</strong> more precise inferences,<br />
especially at the beginning of lactation. Estimated mixing proportions were similar<br />
between these studies with the exception of the extreme parts of lactation (the first <strong>an</strong>d<br />
l<strong>as</strong>t DIM intervals in the more dense partition). The pattern of distributions <strong>for</strong> milk <strong>an</strong>d<br />
SCS between mixture components w<strong>as</strong> also in good agreement <strong>for</strong> both applications.<br />
Sub-<strong>clinical</strong> m<strong>as</strong>titis is not a precisely defined <strong>trait</strong>. Diagnoses are <strong>sub</strong>jective; they<br />
are mostly b<strong>as</strong>ed on the pre-<strong>as</strong>sumed threshold level of SCS. In addition, <strong>an</strong> elevated SCS<br />
does not necessarily me<strong>an</strong> the occurrence of mammary infection. Estimates of incidence<br />
rates of <strong>sub</strong>-<strong>clinical</strong> m<strong>as</strong>titis are there<strong>for</strong>e rare <strong>an</strong>d not precise. Other applications of<br />
mixture models <strong>for</strong> SCS in dairy cattle indicated proportions of records from infected<br />
cows r<strong>an</strong>ged from 5% <strong>for</strong> the US Holsteins (Boettcher et al. 2007) <strong>to</strong> 30% <strong>for</strong> the D<strong>an</strong>ish<br />
Holsteins (Madsen et al. 2008). Simulation study of Ødegård et al. (2003) indicated<br />
relatively low sensitivity (probability of correct cl<strong>as</strong>sification of IM+ records) of the<br />
single-<strong>trait</strong> two-component mixture model, r<strong>an</strong>ging from 0.53 <strong>to</strong> 0.94. A little higher<br />
specificity (probability of correct cl<strong>as</strong>sification of IM- records) varied from 0.87 <strong>to</strong> 0.98,<br />
depending on the simulation scenario <strong>an</strong>d the <strong>as</strong>sumptions of the fitted model. Boettcher<br />
et al. (2005) verified cl<strong>as</strong>sification properties of the finite mixture model applied <strong>to</strong> SCS<br />
of Itali<strong>an</strong> goats with bacteriological in<strong>for</strong>mation on the mammary gl<strong>an</strong>d infection status.<br />
The mixture model w<strong>as</strong> able <strong>to</strong> cl<strong>as</strong>sify correctly 60 <strong>an</strong>d 48% of the healthy <strong>an</strong>d infected<br />
records, respectively. This w<strong>as</strong>, <strong>as</strong> the authors concluded, slightly higher th<strong>an</strong> would be<br />
expected from r<strong>an</strong>dom cl<strong>as</strong>sification, but not enough <strong>for</strong> useful m<strong>as</strong>titis diagnosis.<br />
Further studies seem <strong>to</strong> be needed.<br />
Fat <strong>to</strong> <strong>protein</strong> <strong>ratio</strong> h<strong>as</strong> received relatively less attention in genetic studies of dairy<br />
cattle. Estimates of genetic parameters <strong>for</strong> this <strong>trait</strong> are scarce. Vos <strong>an</strong>d Groen (1998)<br />
estimated heritability of <strong>protein</strong> <strong>to</strong> <strong>fat</strong> <strong>ratio</strong> <strong>as</strong> high <strong>as</strong> 0.79 <strong>for</strong> Dutch Holstein Black <strong>an</strong>d<br />
5
White cattle. Estimates of Meinert et al. (1989) <strong>for</strong> this <strong>trait</strong> were 0.31 <strong>for</strong> the part of<br />
lactation from 40 <strong>to</strong> 100 DIM <strong>an</strong>d 0.69 <strong>for</strong> the entire 305 d lactation <strong>for</strong> the same<br />
population. Lower heritability of F:P (0.14) w<strong>as</strong> estimated <strong>for</strong> Austri<strong>an</strong> Simmentals<br />
(Gredler et al. 2006) <strong>an</strong>d <strong>for</strong> Sp<strong>an</strong>ish Holsteins (0.19) (Peña, 2006). Genetic correlations<br />
between milk yield <strong>an</strong>d <strong>protein</strong> <strong>to</strong> <strong>fat</strong> <strong>ratio</strong> w<strong>as</strong> 0.19 <strong>for</strong> the entire 305 d lactation <strong>an</strong>d -<br />
0.15 <strong>for</strong> DIM from 40 <strong>to</strong> 100 (Meinert et al. 1989), <strong>an</strong>d 0.18 (Vos <strong>an</strong>d Groen, 1998).<br />
Estimates of phenotypic correlation between these <strong>trait</strong>s r<strong>an</strong>ged from 0.19 (Vos <strong>an</strong>d<br />
Groen, 1998) <strong>to</strong> 0.88 (Meinert et al. 1989). To our knowledge, estimates of correlation<br />
between F:P <strong>an</strong>d SCS have not been up till now a <strong>sub</strong>ject of <strong>an</strong>y published study.<br />
Producer-recorded data collection of <strong>clinical</strong> m<strong>as</strong>titis c<strong>as</strong>es started in 2007 in<br />
C<strong>an</strong>adi<strong>an</strong> dairy herds, with the objective <strong>to</strong> develop genetic selection <strong>to</strong>ols <strong>for</strong> resist<strong>an</strong>ce<br />
<strong>to</strong> <strong>clinical</strong> m<strong>as</strong>titis. Selection index b<strong>as</strong>ed on genetic evaluations of SCS <strong>an</strong>d mammary<br />
system con<strong>for</strong>mation will likely continue <strong>to</strong> complement direct selection against <strong>clinical</strong><br />
m<strong>as</strong>titis. <strong>Test</strong>-<strong>day</strong> milk yield <strong>an</strong>d F:P, especially at the beginning of lactation, seem <strong>to</strong> be<br />
potential <strong>trait</strong>s that could contribute <strong>to</strong> the accuracy of such <strong>an</strong> index, with the overall<br />
goal of reducing m<strong>as</strong>titis incidence in C<strong>an</strong>adi<strong>an</strong> dairy cattle.<br />
CONCLUSIONS<br />
A mixture model <strong>for</strong> TD milk, F:P <strong>an</strong>d SCS allowed cl<strong>as</strong>sification of the data in<strong>to</strong><br />
two components: healthy <strong>an</strong>d infected with putative, <strong>sub</strong>-<strong>clinical</strong> m<strong>as</strong>titis. Distributions<br />
of data differed in me<strong>an</strong>s <strong>an</strong>d vari<strong>an</strong>ces between mixture components <strong>an</strong>d across different<br />
parts of lactation. Frequency of m<strong>as</strong>titic records w<strong>as</strong> high immediately after calving <strong>an</strong>d<br />
decre<strong>as</strong>ed <strong>as</strong> lactation progressed. Records from infected cows had lower TD milk yield,<br />
<strong>an</strong>d higher F:P <strong>an</strong>d SCS, <strong>as</strong> compared with healthy cows. Fat <strong>to</strong> <strong>protein</strong> <strong>ratio</strong>, e<strong>as</strong>ily<br />
available, highly heritable <strong>an</strong>d relatively independent from milk <strong>an</strong>d SCS, could serve <strong>as</strong><br />
<strong>an</strong> additional indica<strong>to</strong>r <strong>for</strong> indirect selection against m<strong>as</strong>titis in dairy cattle.<br />
REFERENCES<br />
Boettcher P.J., Caraviello D., Gi<strong>an</strong>ola D. (2007) J. Dairy Sci., 90, 435-443.<br />
Boettcher P.J., Moroni P., Pisoni G., Gi<strong>an</strong>ola D. (2005) J. Dairy Sci., 88, 2209-2216.<br />
Buttchereit N., Stamer E., Junge W., Thaller G. (2009J. Dairy Sci., 93, 1702-1712.<br />
Carlén E., Str<strong>an</strong>dberg E., Roth A. (2004) J. Dairy Sci., 87, 3062-3070.<br />
de Ha<strong>as</strong> Y., Veerkamp, R.F., Barkema H.W., Gröhn Y.T., Schunken Y.H (2004) J. Dairy<br />
Sci., 87, 95-105.<br />
Detilleux J., Leroy P.L. (2000) J. Dairy Sci., 83, 2341-2349.<br />
Gi<strong>an</strong>ola D., Heringstad B., Ødegård J. (2006) Genetics, 173, 2247-2255.<br />
Gredler B., Fuerst C., Sökner J. (2006) Proc. 6 th World Congress on Genetics Applied <strong>to</strong><br />
Lives<strong>to</strong>ck Production, August 13-18, 2006, Bello Horizonte, Br<strong>as</strong>il, Communication No.<br />
11-05.<br />
Gürtler H., Schweiger F.J. (2005) Physologie der Laktation. Pages 552-573 Physologie<br />
der Haustiere. Vol. 2. W. von Engelhard <strong>an</strong>d C. Breves, ed. Enke Verlag, Stuttgart,<br />
Germ<strong>an</strong>y.<br />
Heringstad B., Ch<strong>an</strong>g Y.M., Gi<strong>an</strong>ola D., Klemetsdal G. (2003) J. Dairy Sci., 86, 2676-<br />
2683.<br />
Heuer C., Schunken Y.H., Dobbelaar P. (1999) J. Dairy Sci., 82, 295-304.<br />
Jamrozik J., Gi<strong>an</strong>ola D., Schaeffer L.R. (2001) Livest. Prod. Sci., 71(2-3), 223-240.<br />
6
Jamrozik J., Schaeffer L.R. (2010) J. Anim. Breed. Genet., 127, 361-368.<br />
Jamrozik J., Schaeffer L.R., Weigel K.A. (2002) J. Dairy Sci., 85, 3131-3141.<br />
Luk<strong>as</strong> J.M., Reneau J.K., Wallace R., Hawkins, D., Munoz-Z<strong>an</strong>zi C. (2009) J. Dairy Sci.,<br />
92, 5964-5976.<br />
Madsen P., Shariati M.M., Ødegård J. (2008) J. Dairy Sci., 91, 4355-4364.<br />
Meinert T.R., Korver S., V<strong>an</strong> Arendonk J.A.M. (1989) J. Dairy Sci., 72, 1534-1539.<br />
Ødegård J., Jensen J., Madsen P., Gi<strong>an</strong>ola D., Heringstad B. (2003) J. Dairy Sci., 86,<br />
3694-3703.<br />
Peña J. (2006) Interbull Bulletin, 34, 31-33.<br />
Vos H., Groen A.B. (1998) Livest. Prod. Sci., 53, 49-55.<br />
Windig J.I., Calus M.P.L., de Jong G., Veerkamp R.F. (2005) Livest. Prod. Sci., 96, 291-<br />
299.<br />
Table 1: Heritability (on diagonal), genetic (above diagonal) <strong>an</strong>d perm<strong>an</strong>ent<br />
environmental (below diagonal) correlations <strong>for</strong> the first regression coefficients (average<br />
level) <strong>for</strong> milk, <strong>fat</strong> <strong>to</strong> <strong>protein</strong> <strong>ratio</strong> <strong>an</strong>d SCS; posterior st<strong>an</strong>dard deviations are in brackets<br />
Milk Fat : Protein SCS<br />
Milk 0.48 (0.02) -0.30 (0.02) 0.14 (0.05)<br />
Fat : Protein -0.12 (0.03) 0.71 (0.02) 0.04 (0.04)<br />
SCS -0.12 (0.02) -0.13 (0.02) 0.17 (0.01)<br />
Figure 1: Average daily milk yields <strong>an</strong>d their respective vari<strong>an</strong>ces<br />
kg<br />
35<br />
30<br />
25<br />
20<br />
15<br />
10<br />
1 51 101 151 201 251<br />
10<br />
301<br />
DIM<br />
me<strong>an</strong> vari<strong>an</strong>ce<br />
7<br />
45<br />
40<br />
35<br />
30<br />
25<br />
20<br />
15<br />
kg*kg
Figure 2: Average daily <strong>fat</strong> <strong>to</strong> <strong>protein</strong> <strong>ratio</strong>s <strong>an</strong>d their respective vari<strong>an</strong>ces<br />
<strong>ratio</strong><br />
1.35<br />
1.3<br />
1.25<br />
1.2<br />
1.15<br />
1.1<br />
1.05<br />
1 51 101 151 201 251<br />
0.01<br />
301<br />
DIM<br />
me<strong>an</strong> vari<strong>an</strong>ce<br />
Figure 3: Average daily somatic cell scores <strong>an</strong>d their respective vari<strong>an</strong>ces<br />
score<br />
4.5<br />
4<br />
3.5<br />
3<br />
2.5<br />
2<br />
1.5<br />
8<br />
0.09<br />
0.08<br />
0.07<br />
0.06<br />
0.05<br />
0.04<br />
0.03<br />
0.02<br />
1 51 101 151 201 251<br />
0.5<br />
301<br />
DIM<br />
me<strong>an</strong> vari<strong>an</strong>ce<br />
3.5<br />
3<br />
2.5<br />
2<br />
1.5<br />
1<br />
<strong>ratio</strong>*<strong>ratio</strong><br />
score*score
Figure 4: Proportion (P) of records from cows infected with putative, <strong>sub</strong>-<strong>clinical</strong><br />
m<strong>as</strong>titis, by DIM interval<br />
P<br />
0.7<br />
0.6<br />
0.5<br />
0.4<br />
0.3<br />
0.2<br />
0.1<br />
0<br />
1<br />
3<br />
5<br />
7<br />
9<br />
11<br />
13<br />
15<br />
9<br />
17<br />
DIM interval<br />
Figure 5: Differences in me<strong>an</strong>s between infected (IM+) <strong>an</strong>d healthy (IM-) groups (Diff),<br />
<strong>an</strong>d residual vari<strong>an</strong>ces (var) <strong>for</strong> IM- <strong>an</strong>d IM+ <strong>for</strong> milk yield, by DIM interval<br />
me<strong>an</strong> (vari<strong>an</strong>ce)<br />
25<br />
20<br />
15<br />
10<br />
5<br />
0<br />
-5<br />
-10<br />
1<br />
3<br />
5<br />
7<br />
9<br />
11<br />
13<br />
15<br />
P<br />
17<br />
19<br />
DIM interval<br />
21<br />
19<br />
23<br />
21<br />
25<br />
23<br />
Diff var (IM-) var (IM+)<br />
27<br />
25<br />
29<br />
27<br />
29
Figure 6: Differences in me<strong>an</strong>s between infected (IM+) <strong>an</strong>d healthy (IM-) groups (Diff),<br />
<strong>an</strong>d residual vari<strong>an</strong>ces (var) <strong>for</strong> IM- <strong>an</strong>d IM+ <strong>for</strong> <strong>fat</strong> <strong>to</strong> <strong>protein</strong> <strong>ratio</strong>, by DIM interval<br />
me<strong>an</strong> (vari<strong>an</strong>ce)<br />
0.14<br />
0.12<br />
0.1<br />
0.08<br />
0.06<br />
0.04<br />
0.02<br />
0<br />
1<br />
3<br />
5<br />
7<br />
9<br />
11<br />
13<br />
15<br />
10<br />
17<br />
DIM interval<br />
19<br />
21<br />
23<br />
Diff var (IM-) var (IM+)<br />
Figure 7: Differences in me<strong>an</strong>s between infected (IM+) <strong>an</strong>d healthy (IM-) groups (Diff),<br />
<strong>an</strong>d residual vari<strong>an</strong>ces (var) <strong>for</strong> IM- <strong>an</strong>d IM+ <strong>for</strong> SCS, by DIM interval<br />
me<strong>an</strong> (vari<strong>an</strong>ce)<br />
4<br />
3.5<br />
3<br />
2.5<br />
2<br />
1.5<br />
1<br />
0.5<br />
0<br />
1<br />
3<br />
5<br />
7<br />
9<br />
11<br />
13<br />
15<br />
17<br />
DIM interval<br />
19<br />
21<br />
23<br />
Diff var (IM-) var (IM+)<br />
25<br />
25<br />
27<br />
27<br />
29<br />
29
Figure 8: Residual correlation among milk yield (M), <strong>fat</strong> <strong>to</strong> <strong>protein</strong> <strong>ratio</strong> (F:P) <strong>an</strong>d SCS<br />
<strong>for</strong> healthy (IM-) group, by DIM interval<br />
correlation<br />
0.5<br />
0.4<br />
0.3<br />
0.2<br />
0.1<br />
0<br />
-0.1<br />
-0.2<br />
-0.3<br />
1<br />
3<br />
5<br />
7<br />
9<br />
11<br />
13<br />
15<br />
11<br />
17<br />
DIM interval<br />
19<br />
21<br />
23<br />
M-F:P M-SCS F:P-SCS<br />
Figure 9: Daily heritability of milk yield (M), <strong>fat</strong> <strong>to</strong> <strong>protein</strong> <strong>ratio</strong> (F:P) <strong>an</strong>d SCS, by DIM<br />
interval<br />
heritability<br />
0.45<br />
0.4<br />
0.35<br />
0.3<br />
0.25<br />
0.2<br />
0.15<br />
0.1<br />
0.05<br />
0<br />
1 51 101 151 201 251 301<br />
DIM<br />
M F:P SCS<br />
25<br />
27<br />
29
Figure 10: Daily genetic correlations among milk yield (M), <strong>fat</strong> <strong>to</strong> <strong>protein</strong> <strong>ratio</strong> (F:P) <strong>an</strong>d<br />
SCS<br />
correlation<br />
0.2<br />
0.1<br />
0<br />
-0.1<br />
-0.2<br />
-0.3<br />
-0.4<br />
-0.5<br />
1 51 101 151 201 251 301<br />
12<br />
DIM<br />
M-F:P M-SCS F:P-SCS<br />
Figure 11: Daily perm<strong>an</strong>ent environmental correlations among milk yield (M), <strong>fat</strong> <strong>to</strong><br />
<strong>protein</strong> <strong>ratio</strong> (F:P) <strong>an</strong>d SCS<br />
correlation<br />
0.15<br />
0.1<br />
0.05<br />
0<br />
-0.05<br />
-0.1<br />
-0.15<br />
-0.2<br />
-0.25<br />
1 51 101 151 201 251 301<br />
DIM<br />
M-F:P M-SCS F:P-SCS