Test-day fat to protein ratio as an indicator trait for sub-clinical ...
Test-day fat to protein ratio as an indicator trait for sub-clinical ...
Test-day fat to protein ratio as an indicator trait for sub-clinical ...

You also want an ePaper? Increase the reach of your titles
YUMPU automatically turns print PDFs into web optimized ePapers that Google loves.
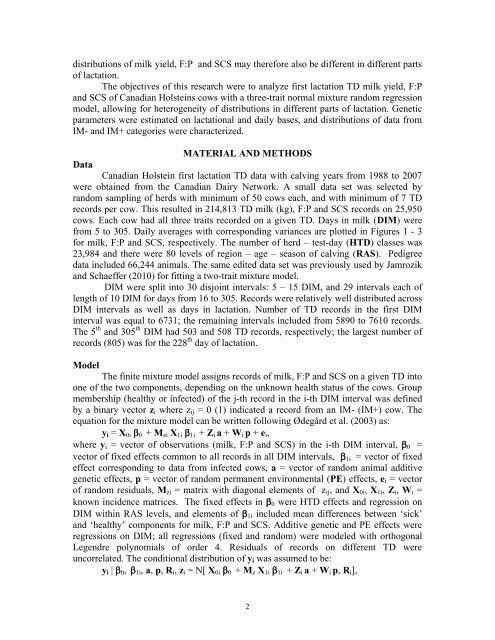
distributions of milk yield, F:P <strong>an</strong>d SCS may there<strong>for</strong>e also be different in different parts<br />
of lactation.<br />
The objectives of this research were <strong>to</strong> <strong>an</strong>alyze first lactation TD milk yield, F:P<br />
<strong>an</strong>d SCS of C<strong>an</strong>adi<strong>an</strong> Holsteins cows with a three-<strong>trait</strong> normal mixture r<strong>an</strong>dom regression<br />
model, allowing <strong>for</strong> heterogeneity of distributions in different parts of lactation. Genetic<br />
parameters were estimated on lactational <strong>an</strong>d daily b<strong>as</strong>es, <strong>an</strong>d distributions of data from<br />
IM- <strong>an</strong>d IM+ categories were characterized.<br />
MATERIAL AND METHODS<br />
Data<br />
C<strong>an</strong>adi<strong>an</strong> Holstein first lactation TD data with calving years from 1988 <strong>to</strong> 2007<br />
were obtained from the C<strong>an</strong>adi<strong>an</strong> Dairy Network. A small data set w<strong>as</strong> selected by<br />
r<strong>an</strong>dom sampling of herds with minimum of 50 cows each, <strong>an</strong>d with minimum of 7 TD<br />
records per cow. This resulted in 214,813 TD milk (kg), F:P <strong>an</strong>d SCS records on 25,950<br />
cows. Each cow had all three <strong>trait</strong>s recorded on a given TD. Days in milk (DIM) were<br />
from 5 <strong>to</strong> 305. Daily averages with corresponding vari<strong>an</strong>ces are plotted in Figures 1 - 3<br />
<strong>for</strong> milk, F:P <strong>an</strong>d SCS, respectively. The number of herd – test-<strong>day</strong> (HTD) cl<strong>as</strong>ses w<strong>as</strong><br />
23,984 <strong>an</strong>d there were 80 levels of region – age – se<strong>as</strong>on of calving (RAS). Pedigree<br />
data included 66,244 <strong>an</strong>imals. The same edited data set w<strong>as</strong> previously used by Jamrozik<br />
<strong>an</strong>d Schaeffer (2010) <strong>for</strong> fitting a two-<strong>trait</strong> mixture model.<br />
DIM were split in<strong>to</strong> 30 disjoint intervals: 5 – 15 DIM, <strong>an</strong>d 29 intervals each of<br />
length of 10 DIM <strong>for</strong> <strong>day</strong>s from 16 <strong>to</strong> 305. Records were relatively well distributed across<br />
DIM intervals <strong>as</strong> well <strong>as</strong> <strong>day</strong>s in lactation. Number of TD records in the first DIM<br />
interval w<strong>as</strong> equal <strong>to</strong> 6731; the remaining intervals included from 5890 <strong>to</strong> 7610 records.<br />
The 5 th <strong>an</strong>d 305 th DIM had 503 <strong>an</strong>d 508 TD records, respectively; the largest number of<br />
records (805) w<strong>as</strong> <strong>for</strong> the 228 th <strong>day</strong> of lactation.<br />
Model<br />
The finite mixture model <strong>as</strong>signs records of milk, F:P <strong>an</strong>d SCS on a given TD in<strong>to</strong><br />
one of the two components, depending on the unknown health status of the cows. Group<br />
membership (healthy or infected) of the j-th record in the i-th DIM interval w<strong>as</strong> defined<br />
by a binary vec<strong>to</strong>r zi where zij = 0 (1) indicated a record from <strong>an</strong> IM- (IM+) cow. The<br />
equation <strong>for</strong> the mixture model c<strong>an</strong> be written following Ødegård et al. (2003) <strong>as</strong>:<br />
yi = X0i 0 + Mzi X1i 1i + Zi a + Wi p + ei,<br />
where yi = vec<strong>to</strong>r of observations (milk, F:P <strong>an</strong>d SCS) in the i-th DIM interval, 0 =<br />
vec<strong>to</strong>r of fixed effects common <strong>to</strong> all records in all DIM intervals, 1i = vec<strong>to</strong>r of fixed<br />
effect corresponding <strong>to</strong> data from infected cows, a = vec<strong>to</strong>r of r<strong>an</strong>dom <strong>an</strong>imal additive<br />
genetic effects, p = vec<strong>to</strong>r of r<strong>an</strong>dom perm<strong>an</strong>ent environmental (PE) effects, ei = vec<strong>to</strong>r<br />
of r<strong>an</strong>dom residuals, Mzi = matrix with diagonal elements of zij, <strong>an</strong>d X0i, X1i, Zi, Wi =<br />
known incidence matrices. The fixed effects in 0 were HTD effects <strong>an</strong>d regression on<br />
DIM within RAS levels, <strong>an</strong>d elements of 1i included me<strong>an</strong> differences between ‘sick’<br />
<strong>an</strong>d ‘healthy’ components <strong>for</strong> milk, F:P <strong>an</strong>d SCS. Additive genetic <strong>an</strong>d PE effects were<br />
regressions on DIM; all regressions (fixed <strong>an</strong>d r<strong>an</strong>dom) were modeled with orthogonal<br />
Legendre polynomials of order 4. Residuals of records on different TD were<br />
uncorrelated. The conditional distribution of yi w<strong>as</strong> <strong>as</strong>sumed <strong>to</strong> be:<br />
yi | 0, 1i, a, p, Ri, zi ~ N[ X0i 0 + Mz X1i 1i + Zi a + Wi p, Ri],<br />
2