Photodegradation of Congo Red catalyzed by nanosized TiO2
Photodegradation of Congo Red catalyzed by nanosized TiO2
Photodegradation of Congo Red catalyzed by nanosized TiO2

You also want an ePaper? Increase the reach of your titles
YUMPU automatically turns print PDFs into web optimized ePapers that Google loves.
Abstract<br />
Journal <strong>of</strong> Molecular Catalysis A: Chemical 242 (2005) 48–56<br />
<strong>Photodegradation</strong> <strong>of</strong> <strong>Congo</strong> <strong>Red</strong> <strong>catalyzed</strong> <strong>by</strong> <strong>nanosized</strong> <strong>TiO2</strong><br />
Rajeev K. Wahi, William W. Yu ∗ , Yunping Liu, Michelle L. Mejia,<br />
Joshua C. Falkner, Whitney Nolte, Vicki L. Colvin<br />
Department <strong>of</strong> Chemistry, Rice University, 6100 Main Street, Houston, TX 77005, USA<br />
Received 6 June 2005; accepted 27 July 2005<br />
Available online 6 September 2005<br />
The effects <strong>of</strong> various physical properties (particle size, shape, surface area, crystal structure, and phase composition) on the photocatalytic<br />
performance <strong>of</strong> <strong>nanosized</strong> <strong>TiO2</strong> were studied through the photodegradation <strong>of</strong> <strong>Congo</strong> <strong>Red</strong>. Kinetic results showed that anatase <strong>TiO2</strong> was a superior<br />
photocatalyst to rutile <strong>TiO2</strong> due to the inherent difference in the two crystal structures. Anatase <strong>TiO2</strong> nanorods with predominantly (1 0 1) surface<br />
exhibited low activity because the non-dissociative adsorption <strong>of</strong> H2O to this surface retarded the generation <strong>of</strong> OH • radicals required for facile<br />
photocatalytic oxidation. It was found for the first time that the shape <strong>of</strong> <strong>TiO2</strong> nanocrystals significantly affected their photocatalytic activities. The<br />
previously reported anatase–rutile synergetic effect in commercialized mixed-phase <strong>TiO2</strong> (Degussa P25) was not observed in this study, perhaps,<br />
due to poor contact between the two phases and the extremely small sizes, as well as the not-optimized phase compositions in the current work.<br />
© 2005 Elsevier B.V. All rights reserved.<br />
Keywords: Photocatalysis; <strong>Congo</strong> <strong>Red</strong>; <strong>TiO2</strong>; Nanoparticle; Catalysis<br />
1. Introduction<br />
Nanoscale materials possess distinctive properties differing<br />
from their molecular and bulk forms, such as quantum confinement<br />
[1,2], superparamagnetism [3], superior catalytic performances<br />
including the high selectivity and high reactivity [4–7].<br />
The use <strong>of</strong> nanocrystalline <strong>TiO2</strong> in the photocatalytic oxidation<br />
<strong>of</strong> organic molecules represents a promising remediation strategy<br />
for wastewater systems. In the past decades, hundreds <strong>of</strong><br />
reports have been published on <strong>TiO2</strong>-mediated destruction <strong>of</strong><br />
organic pollutants such as polychlorobiphenyls, toluene, surfactants,<br />
pesticides and their precursors, herbicides, phenols and<br />
phenolic compounds, carboxylic acids, halogenated hydrocarbons,<br />
aromatic sulfides, and organic dyes [8–17]. Given the<br />
enormous variety <strong>of</strong> organic compounds that can be photocatalytically<br />
degraded <strong>by</strong> <strong>TiO2</strong>, there has naturally been a great<br />
interest in finding ways to improve the efficiency <strong>of</strong> <strong>TiO2</strong> in<br />
such processes.<br />
In general, the efficiency or activity <strong>of</strong> a photocatalyst<br />
increases with its adsorptive capacity and the extent <strong>of</strong> charge<br />
∗ Corresponding author. Tel.: +1 713 348 3489; fax: +1 713 348 2578.<br />
E-mail address: wyu@rice.edu (W.W. Yu).<br />
1381-1169/$ – see front matter © 2005 Elsevier B.V. All rights reserved.<br />
doi:10.1016/j.molcata.2005.07.034<br />
separation upon photoinduced generation <strong>of</strong> electron–hole<br />
(e − /h + ) pairs. Small particle size and high specific surface area<br />
tend to increase the photocatalytic activity <strong>of</strong> <strong>TiO2</strong> due to the<br />
large number <strong>of</strong> surface sites for adsorption and subsequent desorption<br />
<strong>of</strong> reactant molecules, although there might be limits to<br />
this beneficial effect since the recombination rate <strong>of</strong> e − /h + may<br />
be high in extremely small particles [18–21]. Efficient charge<br />
separation is particularly critical since photogenerated holes are<br />
required for oxidation <strong>of</strong> adsorbents, usually through the mediation<br />
<strong>of</strong> an adsorbed OH − group that reacts with a hole to form<br />
the powerful oxidant OH • radical [22].<br />
It is widely accepted that the anatase <strong>TiO2</strong> is a more efficient<br />
photocatalyst than the rutile <strong>TiO2</strong> because <strong>of</strong> the former’s<br />
relatively high adsorptive affinity for organics and the superior<br />
hole-trapping ability [22–27]. However, it has also been shown<br />
that a commercialized mixture <strong>of</strong> the two phases (Degussa P25)<br />
exhibited much superior photocatalytic activity to pure-anatase<br />
and rutile <strong>TiO2</strong> [28–35]. This enhanced activity in mixed-phase<br />
catalysts results from a synergetic effect involving prolonged<br />
separation <strong>of</strong> photogenerated electrons and holes through interfacial<br />
electron transfer from the conduction band <strong>of</strong> rutile phase<br />
to the trapping states <strong>of</strong> anatase phase [33].<br />
Despite the vast body <strong>of</strong> knowledge about the effects <strong>of</strong><br />
<strong>TiO2</strong>’s physical properties on its photocatalytic behavior, a num-
Scheme 1. Molecular structure <strong>of</strong> <strong>Congo</strong> <strong>Red</strong>.<br />
ber <strong>of</strong> ambiguities questions remain. It is unclear that if the<br />
particle size (and therefore, the specific surface area) plays any<br />
effect when anatase is usually a better photocatalyst than rutile<br />
[33]. A second concern is whether the anatase–rutile synergy<br />
for Degussa P25 <strong>TiO2</strong> (particle size ∼ 20 nm) would also be<br />
observed in other mixed-phase <strong>TiO2</strong> systems, especially those<br />
with ultrafine particle sizes (
50 R.K. Wahi et al. / Journal <strong>of</strong> Molecular Catalysis A: Chemical 242 (2005) 48–56<br />
Table 1<br />
Synthesis <strong>of</strong> <strong>nanosized</strong> <strong>TiO2</strong> photocatalysts<br />
Catalyst Precursor (concentration,<br />
mol L −1 )<br />
Solvent Temperature<br />
( ◦ C)<br />
Reaction<br />
time (h)<br />
Particle shape Phase a Average diameter<br />
(nm)<br />
P25 N/A N/A N/A N/A Spherical dot A/R (80/20) 21 50<br />
A1 Ti(OEt)4 (0.02) EtOH 140 2 Spherical dot A 5.5 251<br />
A2 Ti(OEt)4 (0.32) EtOH 150 2 Spherical dot A 10.1 153<br />
A3 Ti(OEt)4 (0.02) EtOH 220 2 Spherical dot A 15.1 83.5<br />
R1 TiCl4 (0.5) H2O 100 2 Spherical dot R 5.4 110<br />
AR1 TiCl4 (0.5) H2O 100 2 Spherical dot A/R (40/60) 5.2 (A) 5.4 (R) 232<br />
AR2 TiCl4 (0.5) H2O 100 2 Spherical dot A/R (70/30) 5.2 (A) 5.0 (R) 123<br />
Rod1b Ti( iOPr)4 (0.76c ) H2O90–100d 6d Short rod A 50e 180–190<br />
94.5<br />
f 5f Rod2 g Ti( i OPr)4 (0.76 c ) H2O 90–100 d 6 d Long rod A 200 e 28.0<br />
180–190 f 5 f<br />
a A: anatase; R: rutile. Mass ratios <strong>of</strong> A/R were listed in the parathesis.<br />
b Synthesized with 0.17 mmol L−1 tetramethylammonium hydroxide (TMAH).<br />
c In the unit <strong>of</strong> mmol L−1 .<br />
d First reaction temperature with 6 h.<br />
e Long axis.<br />
f Following reaction temperature with 5 h.<br />
g Synthesized with 0.91 mmol L−1 TMAH.<br />
2.2.3. Anatase <strong>TiO2</strong> nanorods with different lengths<br />
Anatase <strong>TiO2</strong> nanorods were synthesized with a surfactant<br />
[44]. Briefly, a water solution <strong>of</strong> TMAH (1500 mL) was prepared<br />
in a 2000 mL, three-neck flask and was cooled to 4–5 ◦ C<br />
in an water–ice bath; then a solution <strong>of</strong> titanium(IV) isopropoxide<br />
(3.33 mL, 1.14 mmol) in 2-propanol (100 mL) was poured<br />
into the flask. The resulting turbid white suspension was stirred<br />
at ∼8 ◦ C for 10 min first, and then heated at 90–100 ◦ C for<br />
6 h. Coarsening <strong>of</strong> the <strong>TiO2</strong> nanoparticles to obtain rod-like<br />
nanocrystallites was accomplished <strong>by</strong> heating the suspension for<br />
another 5 h at 180–190 ◦ C. The resulting nanorods were crashed<br />
out <strong>of</strong> the suspension, centrifuged, washed, dialyzed, and dried<br />
as described above. TMAH was completely removed from the<br />
nanorod samples, which was confirmed <strong>by</strong> Fourier Transform<br />
Infrared (FT-IR) spectroscopy (see Fig. 5 and the related discussion).<br />
2.3. Characterization <strong>of</strong> <strong>nanosized</strong> <strong>TiO2</strong> powders<br />
All <strong>TiO2</strong> powders were characterized using X-ray<br />
diffraction (XRD), transmission electron microscopy (TEM),<br />
Brunauer–Emmett–Teller (BET) surface area analysis, and differential<br />
thermal analysis (DTA).<br />
XRD patterns were taken through a Siemens platform-model<br />
general area detector diffraction system (GADDS) with a Cu<br />
K source. The powder samples were run with silicon powder<br />
(as an internal standard) to account for instrumental line broadening<br />
when calculating particle sizes from the <strong>TiO2</strong> linewidths.<br />
Particle sizes were calculated according to the De<strong>by</strong>e–Scherrer<br />
formula with Warren’s correction for instrumental broadening<br />
[45]:<br />
D ( ˚A )= 0.89λ<br />
β cos θB<br />
(1)<br />
Surface area<br />
(m 2 g −1 )<br />
where D is the crystallite size, λ is the X-ray wavelength (1.54 ˚A<br />
for Cu K radiation), and θB is the Bragg angle. The parameter β<br />
is defined as β ≡ (B 2 − b 2 ) 1/2 , where B and b are the linewidths<br />
<strong>of</strong> the most intense <strong>TiO2</strong> reflection ((1 0 1) for anatase, (1 1 0) for<br />
rutile) and the (1 1 1) line <strong>of</strong> the silicon standard, respectively.<br />
Calculation <strong>of</strong> average particle sizes from XRD linewidths was<br />
adapted in the case <strong>of</strong> the anatase dots, the rutile dots, and the<br />
laboratory-synthesized anatase–rutile mixtures. Crystallite sizes<br />
in the other samples with larger than 20 nm was done using TEM<br />
instead.<br />
BET surface areas were measured from N2 adsorption using<br />
a Micromeritics ASAP 2010 apparatus. Samples were degassed<br />
for 5 h prior to the N2 adsorption analysis.<br />
TEM pictures were taken on a JEOL 2010 microscope. TEM<br />
sample was prepared <strong>by</strong> dropping one to two drops <strong>of</strong> sonicated<br />
suspension <strong>of</strong> <strong>TiO2</strong> onto a 300-mesh carbon-coated copper grid<br />
and then evaporated the solvent. The average particle sizes were<br />
obtained <strong>by</strong> measuring 500–1000 individual particles from the<br />
TEM images using Image-Pro Plus 5.0 (Media Cybernetics Inc.)<br />
[3,46].<br />
DTA was performed in air on a Thermal Advantage SDT 2960<br />
apparatus from 25 to 600 ◦ C at a heating rate <strong>of</strong> 20 ◦ C min −1 .<br />
2.4. Photocatalytic degradation <strong>of</strong> <strong>Congo</strong> <strong>Red</strong> with<br />
<strong>nanosized</strong> <strong>TiO2</strong><br />
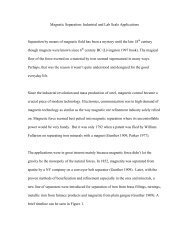
The adsorption isotherms for <strong>Congo</strong> <strong>Red</strong> onto <strong>TiO2</strong> powders<br />
showed that it took considerably long time (>20 h) for <strong>Congo</strong><br />
<strong>Red</strong> to reach adsorption equilibrium onto all the nine self-made<br />
<strong>TiO2</strong> catalysts, while less than 1 h onto P25 (Fig. 1). So, the<br />
water suspensions <strong>of</strong> <strong>Congo</strong> <strong>Red</strong> and <strong>nanosized</strong> <strong>TiO2</strong> powders<br />
was stirred in the dark for 24 h (1 h for Degussa P25) to ensure<br />
the adsorption equilibrium was established prior to irradiation.<br />
Photocatalytic reactions were then carried out inside a Luzchem<br />
model 4-V photoreactor equipped with a magnetic stirrer and
Fig. 1. Adsorption isotherms <strong>of</strong> <strong>Congo</strong> <strong>Red</strong> (72 mol L −1 ) on <strong>nanosized</strong> <strong>TiO2</strong><br />
photocatalysts.<br />
14 UV-A lamps with an emission maximum at λ = 350 nm. In<br />
all cases, the <strong>TiO2</strong> concentration was 1.0 g L−1 and the total<br />
water suspension volume was 10.0 mL. Initial <strong>Congo</strong> <strong>Red</strong> concentrations<br />
varied from 1.0 to 30 mg L−1 . The disappearance <strong>of</strong><br />
<strong>Congo</strong> <strong>Red</strong> was monitored using the UV–vis absorbance feature<br />
at λ = 496 nm as a function <strong>of</strong> irradiation time. <strong>Congo</strong> <strong>Red</strong><br />
concentrations were then calculated from the absorbances <strong>of</strong> the<br />
<strong>Congo</strong> <strong>Red</strong>–<strong>TiO2</strong> suspensions (the contribution <strong>of</strong> <strong>TiO2</strong> to the<br />
UV–vis spectra <strong>of</strong> <strong>Congo</strong> <strong>Red</strong> was subtracted).<br />
The photocatalytic efficiency (activity) <strong>of</strong> each <strong>TiO2</strong> catalyst<br />
for the degradation <strong>of</strong> <strong>Congo</strong> <strong>Red</strong> was quantified in two ways:<br />
measurement <strong>of</strong> <strong>Congo</strong> <strong>Red</strong> half-life time under standard conditions<br />
and Langmuir–Hinshelwood kinetic analysis. In this study,<br />
the <strong>Congo</strong> <strong>Red</strong> half-life time, t1/2, was defined as the amount<br />
<strong>of</strong> time required for photocatalytic degradation <strong>of</strong> 50% <strong>of</strong> the<br />
<strong>Congo</strong> <strong>Red</strong> in a 10 mg L−1 (14 mol L−1 ) aqueous <strong>Congo</strong> <strong>Red</strong><br />
solution when a <strong>TiO2</strong> catalyst was present at a concentration<br />
<strong>of</strong>1gL−1 . Surface <strong>catalyzed</strong> reactions can <strong>of</strong>ten be adequately<br />
described <strong>by</strong> a unimolecular Langmuir–Hinshelwood mechanism,<br />
in which an adsorbed reactant with fractional surface<br />
coverage θ is consumed at an initial rate given <strong>by</strong>:<br />
− dC<br />
dt<br />
<br />
<br />
<br />
0<br />
= r0 = kθ = kKC0<br />
1 + KC0<br />
where k is a rate constant that changes with photocatalytic activity,<br />
K the adsorption equilibrium constant, and C0 is the initial<br />
concentration <strong>of</strong> the reactant (<strong>Congo</strong> <strong>Red</strong> in this case). Inversion<br />
<strong>of</strong> the above rate equation gives:<br />
1<br />
r0<br />
= 1<br />
kK<br />
1<br />
C0<br />
+ 1<br />
k<br />
Thus, a plot <strong>of</strong> r −1<br />
0 against C −1<br />
0 should be a straight line with a<br />
slope <strong>of</strong> (kK) −1 and an intercept <strong>of</strong> k−1 [23]. Such analysis allows<br />
one to quantify the photocatalytic activity <strong>of</strong> a <strong>TiO2</strong> catalyst<br />
through the rate constant k, with larger k values corresponding to<br />
higher photocatalytic activity. Adsorption equilibrium constant<br />
K accounts for the adsorptive ability <strong>of</strong> a <strong>TiO2</strong> catalyst.<br />
It is important to note that the above unimolecular analysis<br />
does not take into account the concentration <strong>of</strong> the<br />
OH• radicals involved in the photocatalytic oxidation. How-<br />
R.K. Wahi et al. / Journal <strong>of</strong> Molecular Catalysis A: Chemical 242 (2005) 48–56 51<br />
(2)<br />
(3)<br />
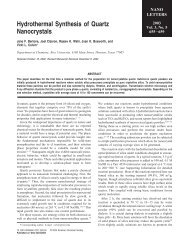
Fig. 2. X-ray diffraction patterns <strong>of</strong> <strong>nanosized</strong> <strong>TiO2</strong> photocatalysts.<br />
ever, one can treat [OH • ] as essentially a constant if [OH • ]<br />
is much larger than C0, and therefore [OH • ], can be left<br />
out <strong>of</strong> the rate expression [47]. As will be seen below, the<br />
unimolecular Langmuir–Hinshelwood analysis was good at<br />
lower initial <strong>Congo</strong> <strong>Red</strong> concentrations (C0) but failed at<br />
higher C0 values in the present study. Although a bimolecular<br />
Langmuir–Hinshelwood analysis would be more appropriate<br />
than the unimolecular analysis at high C0, there is no good way<br />
to quantify the OH • concentration on the <strong>TiO2</strong> surfaces.<br />
3. Results and discussion<br />
3.1. Characterization <strong>of</strong> <strong>nanosized</strong> <strong>TiO2</strong> photocatalyst<br />
powders<br />
Characteristic properties <strong>of</strong> all the <strong>nanosized</strong> <strong>TiO2</strong> photocatalysts<br />
were summarized in Table 1. XRD patterns <strong>of</strong> <strong>TiO2</strong><br />
powders (Fig. 2) indicate that Rod1, Rod2, and A1, A2, and<br />
A3 were pure-anatase structure (A1 and A3 not shown), while<br />
R1 was pure rutile structure. Degussa P25, AR1, and AR2 were<br />
mixed-phase powders with anatase/rutile mass ratios <strong>of</strong> approximately<br />
80/20, 40/60, and 70/30, respectively. Small amounts <strong>of</strong><br />
brookite (
52 R.K. Wahi et al. / Journal <strong>of</strong> Molecular Catalysis A: Chemical 242 (2005) 48–56<br />
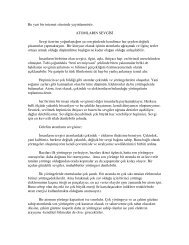
Fig. 3. DTA pr<strong>of</strong>ile <strong>of</strong> A2 <strong>nanosized</strong> <strong>TiO2</strong> photocatalyst. The endothermic peak<br />
near 100 ◦ C corresponds to the evaporation <strong>of</strong> adsorbed water, while the absence<br />
<strong>of</strong> a sharp exothermic peak between 350 and 450 ◦ C indicates the 100% crystallinity<br />
(i.e., no amorphous phase) <strong>of</strong> the <strong>nanosized</strong> <strong>TiO2</strong> powder.<br />
BET surface areas ranged from 28 to 251 m 2 g −1 in the<br />
10 <strong>nanosized</strong> <strong>TiO2</strong> powders studied here. Generally, powder<br />
with smaller particle size had higher surface area. But R1 and<br />
AR2 had only about 50% surface area (110–123 m 2 g −1 )<strong>of</strong>A1<br />
(251 m 2 g −1 ) with similar particle size (∼ 5 nm), largely due to<br />
the extensive aggregation <strong>of</strong> those particles (Fig. 4).<br />
The absence <strong>of</strong> any characteristic TMAH peaks in the FTIR<br />
spectrum <strong>of</strong> anisotropic Rod1 indicated that the TMAH surfactant<br />
was completely removed from the nanocrystal surfaces <strong>by</strong><br />
washing and dialyzing (Fig. 5). The same spectrum as Rod1 was<br />
also observed for Rod2 (not shown).<br />
3.2. Photocatalytic decomposition <strong>of</strong> <strong>Congo</strong> <strong>Red</strong> over<br />
<strong>nanosized</strong> <strong>TiO2</strong> photocatalysts<br />
The photocatalytic activity <strong>of</strong> each <strong>TiO2</strong> catalyst was quantified<br />
using the half-life time (t1/2)fora10mgL −1 (14 mol L −1 )<br />
<strong>Congo</strong> <strong>Red</strong> solution and the Langmuir–Hinshelwood rate constant<br />
(k). The values <strong>of</strong> t1/2 and k were expressed on both a<br />
unit mass basis (t1/2,m, km) and a unit surface area basis (t1/2,s,<br />
ks). Activities evaluated on a unit mass basis reflected largely<br />
Fig. 4. TEM pictures <strong>of</strong> <strong>nanosized</strong> <strong>TiO2</strong> photocatalysts.<br />
Fig. 5. FTIR spectra <strong>of</strong> TMAH and Rod2. The absence <strong>of</strong> characteristic TMAH<br />
resonances in Rod2 confirms that TMAH was completely removed from nanorod<br />
surfaces.<br />
the influence <strong>of</strong> surface area on a catalyst’s performance, while<br />
activities expressed on a unit surface area basis (i.e., specific<br />
activities) reflected the effects <strong>of</strong> physical properties other than<br />
surface area.<br />
The <strong>Congo</strong> <strong>Red</strong> decomposition curves indicate that the A2,<br />
A3 and P25 catalysts had similar activity (t1/2,m = 1.5–3.5 min g)<br />
on a mass basis, while the mixed-phase powders AR1 and AR2<br />
had a little longer half-life time (t1/2,m ∼ = 5 min g) (Fig. 6 and<br />
Table 2). In contrast, the photocatalytic reaction was considerably<br />
slower (t1/2,m = 15–30 min g) over Rod1 and Rod2 anatase<br />
nanorods. And, very slow photodegradations <strong>of</strong> <strong>Congo</strong> <strong>Red</strong><br />
were observed over rutile R1 (t1/2,m = 120 min g). The massbased<br />
activities (t1/2,m) <strong>of</strong> the <strong>TiO2</strong> catalysts increased in the<br />
order R1 < A1 < Rod2 < Rod1 < AR1 ∼ = AR2
Fig. 6. <strong>Photodegradation</strong> <strong>of</strong> <strong>Congo</strong> <strong>Red</strong> catalysed <strong>by</strong> <strong>nanosized</strong> <strong>TiO2</strong>.<br />
to the applicability <strong>of</strong> the Langmuir–Hinshelwood model in<br />
different systems. This can be assessed <strong>by</strong> examining the linearity<br />
<strong>of</strong> a plot <strong>of</strong> r −1<br />
0 versus C −1<br />
0 for each catalyst. Fig. 7<br />
shows curves <strong>of</strong> r0 − C0 (Fig. 7a) and r −1<br />
R.K. Wahi et al. / Journal <strong>of</strong> Molecular Catalysis A: Chemical 242 (2005) 48–56 53<br />
0<br />
− C−1<br />
0 (Fig. 7b) for<br />
two <strong>TiO2</strong> catalysts (AR1 and R1) over a wide range <strong>of</strong> initial<br />
<strong>Congo</strong> <strong>Red</strong> concentrations tested. The concentration ranges over<br />
which the reciprocal plots (Fig. 7c) were linear in accordance<br />
with Langmuir–Hinshelwood model were specified in Table 2.<br />
Langmuir–Hinshelwood model were good over wide ranges for<br />
highly active photocatalysts, e.g., A2, A3, and P25, presumably,<br />
because the generation rates <strong>of</strong> OH • in those <strong>TiO2</strong> catalysts were<br />
fast enough to meet the unimolecular Langmuir–Hinshelwood<br />
model’s assumption <strong>of</strong> a large, essentially constant concentration<br />
<strong>of</strong> OH • relative to the <strong>Congo</strong> <strong>Red</strong> concentration. On the<br />
other hand, low-activity catalysts such as R1 generated OH •<br />
very slowly; the unimolecular Langmuir–Hinshelwood model’s<br />
requirement was only met when C0 was low.<br />
The rate constant k and the adsorption equilibrium constant<br />
K were obtained through linear fits (Fig. 7c). For most <strong>TiO2</strong><br />
catalysts, the order <strong>of</strong> photocatalytic activity quantified <strong>by</strong> rate<br />
constant k was generally in agreement with the order <strong>of</strong> activity<br />
quantified <strong>by</strong> t1/2 (Table 2). In cases where the k value contradicted<br />
the t1/2 result, t1/2 was assumed to be more reliable<br />
measurement <strong>of</strong> photocatalytic activity and used in the follow-<br />
Table 2<br />
Kinetic parameters in <strong>Congo</strong> <strong>Red</strong> photodegradation over <strong>nanosized</strong> <strong>TiO2</strong> photocatalysts<br />
Fig. 7. Langmuir–Hinshelwood analysis <strong>of</strong> <strong>Congo</strong> <strong>Red</strong> photodegradation: (a)<br />
r0 vs. C0 on a unit surface area basis; (b) reciprocal plots on a unit surface<br />
area basis; (c) fitting the linear portions <strong>of</strong> the reciprocal plots to determine the<br />
parameters k and K.<br />
Sample t1/2,m a (min g) t1/2,s b (min m 2 )/10 2 Maximum C0 c (mol L −1 ) km d (mol g −1 min −1 ) ks e (mol m −2 min −1 )/10 −2 K (mol g −1 )<br />
P25 3.5 1.75 30 4.08 8.15 0.235<br />
A1 40 100 – – – –<br />
A2 1.5 2.30 ≥40 5.11 3.34 0.206<br />
A3 1.75 1.46 – – – –<br />
R1 120 – ∼5 1.60 1.46 0.027<br />
AR1 5 11.6 ≥40 3.57 1.54 0.199<br />
AR2 5 6.15 – – 2.5 –<br />
Rod1 15 14.2 15 1.80 1.90 0.068<br />
Rod2 30 8.40 20 0.47 1.67 0.230<br />
a Half-life time expressed on a unit mass basis.<br />
b Half-life time expressed on a surface area basis.<br />
c Maximum initial <strong>Congo</strong> <strong>Red</strong> concentration for unimolecular Langmuir–Hinshelwood analysis applicability.<br />
d Rate constant expressed on a unit mass basis.<br />
e Rate constant expressed on a surface area basis.
54 R.K. Wahi et al. / Journal <strong>of</strong> Molecular Catalysis A: Chemical 242 (2005) 48–56<br />
ing discussion, because the determination <strong>of</strong> t1/2 required fewer<br />
calculations and approximations than the determination <strong>of</strong> k.<br />
3.2.1. Effects <strong>of</strong> particle size and surface area<br />
The kinetic data for the spherical dot-shaped anatase catalysts<br />
(A1, A2, and A3) indicated that particle size and surface<br />
area were the two most important factors influencing the photocatalytic<br />
activity <strong>of</strong> nanocrystalline <strong>TiO2</strong> catalyst (Table 2). The<br />
t1/2,m for the 15.1 nm (A3) and 10.1 nm (A2) nanodots were both<br />
about 1.5 min g, while t1/2,m for the 5.5 nm nanodots (A1) was<br />
40 min g. Thus, 10–15 nm nanodots with low to intermediate surface<br />
areas (80–150 m 2 g −1 ) were about 25 times more active than<br />
5.5 nm nanodots with very high surface area (251 m 2 g −1 ). This<br />
shows that despite the larger number <strong>of</strong> surface sites available<br />
for <strong>Congo</strong> <strong>Red</strong> adsorption onto smaller nanodots, the increased<br />
recombination rate <strong>of</strong> e − /h + in very small particles resulted in<br />
an overall decrease in photocatalytic activity. The 10.1 nm nanodots<br />
<strong>of</strong> A2 (t1/2,m = 1.5 min g) were slightly more active than<br />
the 15.1 nm nanodots <strong>of</strong> A3 (t1/2,m = 1.75 min g), indicating that<br />
A2’s larger surface area contributed more in photocatalytic activity<br />
than electron–hole separation when the particle was big<br />
enough (>10 nm). It appears to be an optimal particle size <strong>of</strong><br />
about 10 nm for a maximum photocatalytic activity <strong>of</strong> anatase<br />
nanodots.<br />
3.2.2. Effect <strong>of</strong> phase composition<br />
3.2.2.1. Single-phase catalysts: anatase versus rutile. The<br />
single-phase anatase catalysts exhibited widely varied activities<br />
that appeared to depend not only on particle size and surface area<br />
but also on the surface (crystal) structure. It can be concluded<br />
from t1/2, data that anatase <strong>TiO2</strong> is a better photocatalyst than<br />
rutile <strong>TiO2</strong>. The t1/2, values for the anatase <strong>TiO2</strong> were found to<br />
be about 2–100 times smaller than that <strong>of</strong> the 5.4 nm R1 rutile<br />
nanodots, indicating that the surface <strong>of</strong> anatase is better to photocatalysis<br />
than the surface <strong>of</strong> rutile. Thus, the generally superior<br />
photocatalytic activity <strong>of</strong> anatase is not merely a result <strong>of</strong> the typically<br />
easy-achieved larger surface areas, but rather a result <strong>of</strong> the<br />
fundamental differences between the anatase and rutile surfaces<br />
(crystal structures). Specifically, the poor activity <strong>of</strong> R1 suggests<br />
that even a moderately high surface area (110 m −2 g −1 ) cannot<br />
compensate for the inefficient hole trapping and low adsorptive<br />
affinity that typically related with rutile’s inherent crystal structure.<br />
The adsorption isotherms in Fig. 1 showed the low adsorptive<br />
affinity <strong>of</strong> rutile <strong>TiO2</strong> for <strong>Congo</strong> <strong>Red</strong>, thus, lowered the<br />
activity <strong>of</strong> R1 in photocatalytic degradation <strong>of</strong> <strong>Congo</strong> <strong>Red</strong>. In<br />
addition, the low apparent adsorption constant K obtained from<br />
Langmuir–Hinshelwood analysis for R1 (K = 0.027) confirms its<br />
low adsorptive affinity.<br />
3.2.2.2. Synergetic effect <strong>of</strong> anatase–rutile mixed-phase <strong>TiO2</strong><br />
catalysts. Our experiments confirmed the strong synergetic<br />
effect in enhancing the photocatalytic activity <strong>of</strong> P25. In the<br />
terms <strong>of</strong> t1/2 and k, it was found that P25, an anatase–rutile mixture<br />
with an intermediate surface area (50 m 2 g −1 ), was more<br />
active than A2, a pure-anatase powder with higher surface area<br />
(153 m 2 g −1 ), <strong>by</strong> a factor <strong>of</strong> 2.5. Thus, it is clear that the pres-<br />
ence <strong>of</strong> two phases in P25 resulted in a remarkable increase in<br />
photocatalytic activity over pure-anatase <strong>TiO2</strong>.<br />
However, this synergetic effect was not apparent in the ultrafine<br />
anatase–rutile mixture AR1 and AR2 (∼5 nm) despite<br />
their high surface areas (123–232 m 2 g −1 ). They were even<br />
less active than pure-anatase A2 and A3. The t1/2 and<br />
Langmuir–Hinshelwood rate constant k supported this observation.<br />
There are several possible reasons for the absence <strong>of</strong> synergetic<br />
effect in our anatase–rutile mixtures. First, the photocatalytic<br />
activity <strong>of</strong> such mixtures depends in part on the relative<br />
amounts <strong>of</strong> these two phases. Bacsa and Kiwi reported that a<br />
highest activity for p-coumaric acid degradation was observed<br />
for an anatase/rutile ratio <strong>of</strong> 70/30 [29]. It is possible that AR1<br />
exhibited low photocatalytic activity because <strong>of</strong> not-optimized<br />
anatase/rutile ratio (40/60). However, AR2 performed almost<br />
the same activity as AR1 even its anatase/rutile ratio (70/30)<br />
was close to that <strong>of</strong> P25 (80/20) and equal to the optimal composition<br />
reported <strong>by</strong> Bacsa and Kiwi.<br />
A more important factor is likely the anatase–rutile interface<br />
in these two catalysts. The enhancement <strong>of</strong> activity in Degussa<br />
P25 has been attributed to efficient electron transfer from rutile<br />
to anatase, which increases the charge separation needed for<br />
efficient photocatalytic reaction at the particle surfaces [33].<br />
Well-contacted interfaces between the anatase and rutile phases<br />
would thus be essential for an appreciable increase in photocatalytic<br />
activity for any mixed-phase catalysts [32,48]. But the<br />
anatase–rutile interfacial contacts in AR1 and AR2 may not be<br />
well controlled as P25. And the smaller size (5 nm) in AR1 and<br />
AR2 may not be good for the electron-hole separation for a high<br />
activity (see Section 3 for A1).<br />
3.2.3. Effect <strong>of</strong> morphology on the activity <strong>of</strong> anatase <strong>TiO2</strong><br />
catalysts<br />
<strong>TiO2</strong> nanorods (Rod1 and Rod2) performed significantly<br />
worse than the anatase nanodots (A2 and A3) (Table 2). Specific<br />
activities, as quantified <strong>by</strong> t1/2, and k, indicated that nanorods<br />
were 5–10 times less active than the 10–15 nm nanodots. FTIR<br />
spectroscopy confirmed the complete removal <strong>of</strong> surfactant from<br />
the nanorods samples prior to the photocatalytic experiments<br />
(Fig. 5), so surfactant poisoning or retarding could be ruled<br />
out as a reason for the poor performance <strong>of</strong> the Rod1 and<br />
Rod2 catalysts. The surface areas accounted partially for the<br />
differences in their per mass activities, but cannot account for<br />
all the activity difference. A (1 0 1) surface dominated <strong>TiO2</strong><br />
was obtained <strong>by</strong> selective binding <strong>of</strong> the tetramethylammonium<br />
cation (N(CH3)4 + ) to the (1 0 1) surface, which inhibited<br />
the growth in the [1 0 1] direction and promoted the growth in<br />
perpendicular directions [44]. The higher the surfactant concentration,<br />
the more pronounced this anisotropic effect. So, the<br />
dominated (1 0 1) surface sites in Rod1 and Rod2 seemed unfavorable<br />
to the photocatalytic activity <strong>of</strong> <strong>TiO2</strong>.<br />
The deleterious effect <strong>of</strong> (1 0 1) surfaces on photocatalytic<br />
activity could be derived from the water adsorption modes to<br />
different anatase surfaces. Theoretical calculations have indicated<br />
that water molecules tend to adsorb dissociatively (i.e., as<br />
H + and OH − ) to anatase (0 0 1) but non-dissociatively (i.e., as
R.K. Wahi et al. / Journal <strong>of</strong> Molecular Catalysis A: Chemical 242 (2005) 48–56 55<br />
H2O) to anatase (1 0 1) facet [49,50]. Thus, in turn, the number<br />
<strong>of</strong> OH • radicals generated from OH − upon irradiation would be<br />
less on (1 0 1) facet. Because OH • radicals are thought to be the<br />
primary oxidizing species in photocatalytic oxidation reactions,<br />
it follows that anatase (1 0 1) surface is less active in such reactions<br />
than (0 0 1) or other surfaces to which water adsorbs in a<br />
primarily dissociative fashion.<br />
4. Summary<br />
The photoinduced decomposition <strong>of</strong> <strong>Congo</strong> <strong>Red</strong> in aqueous<br />
solution over 9 different nanocrystalline <strong>TiO2</strong> photocatalysts<br />
were studied on a series <strong>of</strong> effects, including particle size, surface<br />
area, phase composition, and morphology. Photocatalytic<br />
activity was quantified using both half-life time measurements<br />
(t1/2) and Langmuir–Hinshelwood kinetics (k).<br />
Among the three anatase dots, the maximum photocatalytic<br />
activity was observed in A2 with intermediate particle size <strong>of</strong><br />
∼10 nm, suggesting a best balance between the charge separation<br />
and the surface area. Ultrafine rutile exhibited low activity<br />
despite its high surface area; this could be mainly attributed to<br />
the poor hole trapping ability generally observed in rutile catalysts.<br />
Thus, the superior photocatalytic activity <strong>of</strong> anatase <strong>TiO2</strong><br />
is due to the inherent difference between the crystal structures <strong>of</strong><br />
anatase and rutile, rather than the usually easy-obtained higher<br />
surface area <strong>of</strong> anatase <strong>TiO2</strong>.<br />
The anatase–rutile synergetic effect reported previously for<br />
Degussa P25 was again confirmed; however, this effect was not<br />
observed in our fine (∼5 nm) anatase–rutile mixtures, indicating<br />
that this synergetic effect requires optimal size and perhaps an<br />
optimal phase composition with good contact between the two<br />
phases.<br />
It was also demonstrated for the first time that the photocatalytic<br />
activity <strong>of</strong> anatase greatly depends on particle morphology.<br />
Specifically, both the activities per mass and per surface<br />
area in the anatase nanocrystals with predominant (1 0 1) surface<br />
were lower than those in the isotropic anatase nanoparticles.<br />
This was because the non-dissociative adsorption <strong>of</strong><br />
water to the (1 0 1) surface minimized the number <strong>of</strong> surface<br />
adsorbed hydroxyl groups that were then converted into<br />
hydroxyl radicals—an essential procedure in photocatalytic oxidation<br />
reactions.<br />
Further study on nanocrystalline <strong>TiO2</strong> photocatalysts is<br />
undergoing in the lab, including the size and composition optimizing<br />
<strong>of</strong> the mixed-phase catalyst to get better synergetic effect.<br />
Acknowledgement<br />
This work was supported <strong>by</strong> the National Science Foundation<br />
through Center for Biological and Environmental Nanotechnology<br />
at Rice University (EEC-0118007).<br />
References<br />
[1] W.W. Yu, X. Peng, Angew. Chem. Int. Ed. 41 (2002) 2368.<br />
[2] W.W. Yu, Y.A. Wang, X. Peng, Chem. Mater. 15 (2003) 4300–4308.<br />
[3] W.W. Yu, J.C. Falkner, C.T. Yavuz, V.L. Colvin, Chem. Commun. (2004)<br />
2306–2307.<br />
[4] W. Yu, H. Liu, X. An, J. Mol. Catal. A Chem. 129 (1998) L9–L13.<br />
[5] W. Yu, H. Liu, X. An, X. Ma, Z. Liu, L. Qiang, J. Mol. Catal. A Chem.<br />
147 (1999) 73.<br />
[6] W. Yu, H. Liu, Q. Tao, Chem. Commun. (1996) 1773–1774.<br />
[7] W. Yu, M. Liu, H. Liu, X. An, Z. Liu, X. Ma, J. Mol. Catal. A Chem.<br />
142 (1999) 201–211.<br />
[8] E. De Felip, F. Ferri, C. Lupi, N.M. Trieff, F. Volpi, A. di Domenico,<br />
Chemosphere 33 (1996) 2263–2271.<br />
[9] M.C. Blount, J.L. Falconer, Appl. Catal. B Environ. 39 (2002) 39–<br />
50.<br />
[10] H. Hidaka, J. Zhao, E. Pelizzetti, N.J. Serpone, Phys. Chem. 96 (1992)<br />
2226–2230.<br />
[11] M.K.S. Mak, S.T. Hung, Toxicol. Environ. Chem. 36 (1992) 155–<br />
168.<br />
[12] A. Sclafani, L. Palmisano, M. Schiavello, J. Phys. Chem. 94 (1990)<br />
829–832.<br />
[13] S.-J. Tsai, S. Cheng, Catal. Today 33 (1997) 227–237.<br />
[14] H. Kominami, J. Kato, M. Kohno, Y. Kera, B. Ohtani, Chem. Lett. 1996<br />
(1996) 1051–1052.<br />
[15] C.S. Turchi, D.F. Ollis, J. Catal. 119 (1989) 483–496.<br />
[16] T. Tachikawa, S. Tojo, M. Fujitsuka, T. Majima, J. Phys. Chem. B 108<br />
(2004) 5859–5866.<br />
[17] H. Lachheb, E. Puzenat, A. Houas, M. Ksibi, E. Elaloui, C. Guillard,<br />
J.M. Herrmann, Appl. Catal. B Environ. 39 (2002) 75–90.<br />
[18] M.R. H<strong>of</strong>fmann, S.T. Martin, W. Choi, D.W. Bahnemann, Chem. Rev.<br />
95 (1995) 69–96.<br />
[19] C.-C. Wang, Z. Zhang, J.Y. Ying, Nanostruct. Mater. 9 (1997) 583–586.<br />
[20] L. Cao, A. Huang, F.-J. Spiess, S.L. Suib, J. Catal. 188 (1999) 48–57.<br />
[21] C.B. Almquist, P. Biswas, J. Catal. 212 (2002) 145–156.<br />
[22] A.L. Linsebigler, G.Q. Lu, J.T. Yates, J. Chem. Rev. 95 (1995) 735–758.<br />
[23] M.A. Fox, M.T. Dulay, Chem. Rev. 93 (1993) 341–357.<br />
[24] K.E. Karakitsou, X.E. Verykios, J. Phys. Chem. 97 (1993) 1184–<br />
1189.<br />
[25] K. Tanaka, M.F.V. Capule, T. Hisanaga, Chem. Phys. Lett. 187 (1991)<br />
73–76.<br />
[26] B. Ohtani, S.J. Nishimoto, Phys. Chem. 97 (1993) 920–926.<br />
[27] S.C. Jung, N. Imaishi, Kor. J. Chem. Eng. 18 (2001) 867–872.<br />
[28] R.I. Bickley, T. Gonzalez-Carreno, J.T. Lees, L. Palmisano, R.J.D. Tilley,<br />
J. Solid State Chem. 92 (1991) 178–190.<br />
[29] R.R. Bacsa, J. Kiwi, Appl. Catal. B Environ. 16 (1998) 19–29.<br />
[30] T. Lopez, R. Gomez, E. Sanchez, F. Tzompantzi, L. Vera, J. Sol–Gel<br />
Sci. Technol. 22 (2001) 99–107.<br />
[31] T. Kawahara, Y. Konishi, H. Tada, N. Tohge, J. Nishii, S. Ito, Angew.<br />
Chem. Int. Ed. 41 (2002) 2811–2813.<br />
[32] T. Ohno, K. Tokieda, S. Higashida, M. Matsumura, Appl. Catal. A Gen.<br />
244 (2003) 383–391.<br />
[33] D.C. Hurum, A.G. Agrios, K.A. Gray, T. Rajh, M.C. Thurnauer, J. Phys.<br />
Chem. B 107 (2003) 4545–4549.<br />
[34] B. Sun, P.G. Smirniotis, Catal. Today 88 (2003) 49–59.<br />
[35] G. Balasubramanian, D.D. Dionysiou, M.T. Suidan, I. Baudin, J.-M.<br />
Laine, Appl. Catal. B Environ. 47 (2004) 73–84.<br />
[36] D. Li, H. Haneda, Chemosphere 51 (2003) 129–137.<br />
[37] Y. Yamaguchi, M. Yamazaki, S. Yoshihara, T.J. Shirakashi, Electroanal.<br />
Chem. 442 (1998) 1–3.<br />
[38] Z. Ding, G.Q. Lu, P.F. Greenfield, J. Phys. Chem. B 104 (2000)<br />
4815–4820.<br />
[39] C. Hachem, F. Bocquillon, O. Zahraa, M. Bouchy, Dyes Pigments 49<br />
(2001) 117–125.<br />
[40] C. Guillard, J. Disdier, C. Monnet, J. Dussaud, S. Malato, J. Blanco,<br />
M.I. Maldonado, J.M. Herrmann, Appl. Catal. B Environ. 46 (2003)<br />
319–332.<br />
[41] C. Guillard, H. Lachheb, A. Houas, M. Ksibi, E. Elaloui, J.M. Herrmann,<br />
J. Photochem. Photobiol. A Chem. 158 (2003) 27–36.<br />
[42] E. Puzenat, H. Lachheb, M. Karkmaz, A. Houas, C. Guillard, J.M.<br />
Herrmann, Int. J. Hydrogen Energy 5 (2003) 51–58.<br />
[43] H. Cheng, J. Ma, Z. Zhao, L. Qi, Chem. Mater. 7 (1995) 663–671.
56 R.K. Wahi et al. / Journal <strong>of</strong> Molecular Catalysis A: Chemical 242 (2005) 48–56<br />
[44] A. Chemseddine, T. Moritz, Eur. J. Inorg. Chem. 1999 (1999) 235–245.<br />
[45] H.P. Klug, L.E. Alexander, X-Ray Diffraction Methods for Polycrystalline<br />
and Amorphous Materials, John Wiley and Sons, NY, 1954.<br />
[46] W.W. Yu, J.C. Falkner, B.S. Shih, V.L. Colvin, Chem. Mater. 16 (2004)<br />
3318–3322.<br />
[47] N. Serpone, E. Pelizzetti, Photocatalysis: Fundamentals and Applications,<br />
John Wiley & Sons, NY, 1989.<br />
[48] A.K. Datye, G. Riegel, J.R. Bolton, M. Huang, M.R. Prairie, J. Solid<br />
State Chem. 115 (1995) 236–239.<br />
[49] A. Selloni, A. Vittadini, M. Gratzel, Surf. Sci. 402–404 (1998) 219–<br />
222.<br />
[50] A. Vittadini, A. Selloni, F.P. Rotzinger, M. Gratzel, Phys. Rev. Lett. 81<br />
(1998) 2954–2957.