Wet SEM Analysis of Quantum dot emulsions - Rice University
Wet SEM Analysis of Quantum dot emulsions - Rice University
Wet SEM Analysis of Quantum dot emulsions - Rice University

You also want an ePaper? Increase the reach of your titles
YUMPU automatically turns print PDFs into web optimized ePapers that Google loves.
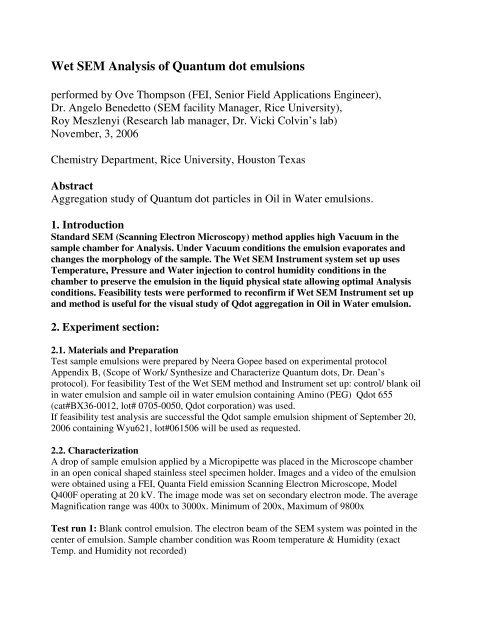
<strong>Wet</strong> <strong>SEM</strong> <strong>Analysis</strong> <strong>of</strong> <strong>Quantum</strong> <strong>dot</strong> <strong>emulsions</strong><br />
performed by Ove Thompson (FEI, Senior Field Applications Engineer),<br />
Dr. Angelo Benedetto (<strong>SEM</strong> facility Manager, <strong>Rice</strong> <strong>University</strong>),<br />
Roy Meszlenyi (Research lab manager, Dr. Vicki Colvin’s lab)<br />
November, 3, 2006<br />
Chemistry Department, <strong>Rice</strong> <strong>University</strong>, Houston Texas<br />
Abstract<br />
Aggregation study <strong>of</strong> <strong>Quantum</strong> <strong>dot</strong> particles in Oil in Water <strong>emulsions</strong>.<br />
1. Introduction<br />
Standard <strong>SEM</strong> (Scanning Electron Microscopy) method applies high Vacuum in the<br />
sample chamber for <strong>Analysis</strong>. Under Vacuum conditions the emulsion evaporates and<br />
changes the morphology <strong>of</strong> the sample. The <strong>Wet</strong> <strong>SEM</strong> Instrument system set up uses<br />
Temperature, Pressure and Water injection to control humidity conditions in the<br />
chamber to preserve the emulsion in the liquid physical state allowing optimal <strong>Analysis</strong><br />
conditions. Feasibility tests were performed to reconfirm if <strong>Wet</strong> <strong>SEM</strong> Instrument set up<br />
and method is useful for the visual study <strong>of</strong> Q<strong>dot</strong> aggregation in Oil in Water emulsion.<br />
2. Experiment section:<br />
2.1. Materials and Preparation<br />
Test sample <strong>emulsions</strong> were prepared by Neera Gopee based on experimental protocol<br />
Appendix B, (Scope <strong>of</strong> Work/ Synthesize and Characterize <strong>Quantum</strong> <strong>dot</strong>s, Dr. Dean’s<br />
protocol). For feasibility Test <strong>of</strong> the <strong>Wet</strong> <strong>SEM</strong> method and Instrument set up: control/ blank oil<br />
in water emulsion and sample oil in water emulsion containing Amino (PEG) Q<strong>dot</strong> 655<br />
(cat#BX36-0012, lot# 0705-0050, Q<strong>dot</strong> corporation) was used.<br />
If feasibility test analysis are successful the Q<strong>dot</strong> sample emulsion shipment <strong>of</strong> September 20,<br />
2006 containing Wyu621, lot#061506 will be used as requested.<br />
2.2. Characterization<br />
A drop <strong>of</strong> sample emulsion applied by a Micropipette was placed in the Microscope chamber<br />
in an open conical shaped stainless steel specimen holder. Images and a video <strong>of</strong> the emulsion<br />
were obtained using a FEI, Quanta Field emission Scanning Electron Microscope, Model<br />
Q400F operating at 20 kV. The image mode was set on secondary electron mode. The average<br />
Magnification range was 400x to 3000x. Minimum <strong>of</strong> 200x, Maximum <strong>of</strong> 9800x<br />
Test run 1: Blank control emulsion. The electron beam <strong>of</strong> the <strong>SEM</strong> system was pointed in the<br />
center <strong>of</strong> emulsion. Sample chamber condition was Room temperature & Humidity (exact<br />
Temp. and Humidity not recorded)
Test run 2: Q<strong>dot</strong> emulsion. The electron beam <strong>of</strong> the <strong>SEM</strong> system was pointed in the center <strong>of</strong><br />
emulsion. Sample chamber condition was Room temperature & Humidity (exact Temp. and<br />
Humidity not recorded)<br />
Test run 3: Blank control emulsion: The electron beam <strong>of</strong> the <strong>SEM</strong> system was pointed close<br />
to edge <strong>of</strong> the sample. Sample chamber condition was:<br />
Pre-conditioning: This step is necessary to ensure optimal humidity conditions Starting<br />
Condition Temperature 275 K= 2º C, 100% Humidity, 8 Torr Pressure<br />
Room temp.: Temperature increase to 295k= 22º C, ~30% Humidity, 8.1 Torr Pressure. Hold<br />
chamber conditions. Characterization <strong>Analysis</strong> phase <strong>of</strong> emulsion.<br />
Drying: Temperature decrease to 273 K= 0º C, ~ 100% Humidity, 2.44 Torr Pressure. Apply<br />
Vacuum to dry sample. Morphology <strong>Analysis</strong> <strong>of</strong> emulsion.<br />
Room temp.: Temperature increase to 293 K= 22º C, ~30% Humidity???, 2.44 Torr Pressure.<br />
Hold chamber conditions. Check Morphology.<br />
Test run 4: Q<strong>dot</strong> emulsion: The electron beam <strong>of</strong> the <strong>SEM</strong> system was pointed close to edge<br />
<strong>of</strong> the sample. Sample chamber condition was :<br />
Preconditioning: Starting Condition Temperature 3º C, 100% Humidity, 7 Torr Pressure<br />
Room temp.: Temperature increase to 22º C, ~30% Humidity, 5.7 Torr Pressure. Hold<br />
chamber conditions. Characterization <strong>Analysis</strong> phase <strong>of</strong> emulsion: visual study <strong>of</strong> Q<strong>dot</strong><br />
aggregation.<br />
Drying: Temperature decrease to 0º C, ~ 100% Humidity, 5.6 Torr Pressure. Apply Vacuum to<br />
dry sample. Morphology <strong>Analysis</strong> <strong>of</strong> emulsion. Apply Humidity: Rehydration phase <strong>of</strong><br />
emulsion.<br />
Room temp.: Temperature increase to 22º C, ~30% Humidity, 4.95 Torr Pressure. Hold<br />
chamber conditions. .Check Morphology <strong>of</strong> rehydrated emulsion<br />
40º C: Temperature increase to 40º C, low Humidity, 1.9 Torr Pressure. Hold chamber<br />
conditions. .Check Morphology at higher Temperature condition<br />
60º C: Temperature increase to 60º C, low Humidity (probably dried out), 1.9 Torr Pressure.<br />
Hold chamber conditions. .Check Morphology at higher Temperature condition<br />
At the end images were taken <strong>of</strong> the dried Q<strong>dot</strong> sample in secondary electron mode and Back<br />
scattering mode. In secondary electron mode an Energy Dispersive X-Ray Spectroscopy (EDS)<br />
was performed and X-ray energy emission spectrum was taken to obtain Elemental <strong>Analysis</strong><br />
data.<br />
4. Results and discussion<br />
Test run 1: If the electron beam is pointed in the center <strong>of</strong> Blank/ control emulsion the heat<br />
<strong>of</strong> beam causes bubbles. The gray background is the surface <strong>of</strong> the Emulsion. Except for the<br />
bubbles which appear on the surface <strong>of</strong> emulsion occasionally no detailed morphology <strong>of</strong> the<br />
emulsion or can be obtained in this experimental set up. To download video (use Micros<strong>of</strong>t<br />
Media player) please go to we blink:
Test run 2: The effect is the same as in Test run 1. If the electron beam is pointed in the<br />
center <strong>of</strong> the Q<strong>dot</strong> emulsion the heat <strong>of</strong> beam causes bubbles. The gray background is the<br />
surface <strong>of</strong> the Emulsion. Except for the bubbles which appeared on the surface <strong>of</strong> the emulsion<br />
occasionally no detailed morphology <strong>of</strong> the emulsion or Aggregation <strong>of</strong> Q<strong>dot</strong>s can be obtained<br />
in this experimental set up. To download video (use Micros<strong>of</strong>t Media player) please go to we<br />
blink:<br />
Test run 3: To download video (use Micros<strong>of</strong>t Media player) please go to we blink:<br />
No useful data could be obtained from Test run 1 & 2. In this experimental set up the electron<br />
beam was pointed close to the edge <strong>of</strong> the stainless steel sample holder (see video). The edge<br />
<strong>of</strong> the sample holder served as reference point to help visualize the <strong>emulsions</strong> Interface to the<br />
holder. The following Pre-conditioning, Room temperature, Drying steps were applied to the<br />
Blank/ control emulsion to develop optimal experimental conditions to visualize details <strong>of</strong><br />
Q<strong>dot</strong> Aggregation in the subsequent Test run 4.<br />
Pre-conditioning: This step is necessary to ensure optimal humidity condition to preserve<br />
In this phase the Interface between emulsion to the left <strong>of</strong> the video (gray background, bubbles)<br />
and the sample Holder to the right (bright white area with ripples) can be clearly distinguished.<br />
Room temp.: This is the desired Characterization condition (Room temp. and humidity) for<br />
<strong>Analysis</strong>. In this phase violent bubbling (Popcorn effect) <strong>of</strong> the emulsion (left gray region) can<br />
be observed probably caused by the heat <strong>of</strong> the electron beam as it scans along the Interface.<br />
Zooming into the emulsion region revealed forming <strong>of</strong> the bubbles and the surface morphology<br />
<strong>of</strong> the emulsion droplets turned from a smooth gray surface (observed in Test run 1 & 2) into a<br />
“Strawberry” type shape. No details other than bubble forming could be obtained.<br />
Drying: This step was performed to check if the dried form <strong>of</strong> the emulsion reveals more <strong>of</strong><br />
the emulsion details. Temperature decrease to 273 K= 0º C, ~ 100% Humidity, 2.44 Torr<br />
Pressure. Apply Vacuum to dry sample. Morphology <strong>Analysis</strong> <strong>of</strong> emulsion. . In this phase<br />
enhanced violent bubbling <strong>of</strong> the emulsion (left gray region) can be observed probably caused<br />
by the vacuum and the heat <strong>of</strong> the electron beam as it scans along the Interface.<br />
Room temp. The “dried emulsion” was put back on Room temperature to check emulsion<br />
behavior. As the electron beam scans along the sample the “Strawberry” type <strong>of</strong> emulsion<br />
droplets developed and additional micro bubbles on the surface <strong>of</strong> droplets. No details other<br />
than additional bubble forming could be obtained.<br />
Test run 4: To download video (use Micros<strong>of</strong>t Media player) please go to we blink:<br />
The sample chamber conditions in Test run 3 were applied to the emulsion containing Q<strong>dot</strong>s in<br />
the hope that the different steps would visualize Q<strong>dot</strong>s and Aggregation <strong>of</strong> Q<strong>dot</strong>s in the<br />
emulsion.<br />
Pre-conditioning: This step is necessary to ensure optimal humidity condition to preserve<br />
In this phase the Interface between emulsion to the left <strong>of</strong> the video (gray Background,<br />
bubbles) and the sample Holder to the right (bright white area with ripples) can be clearly<br />
distinguished.<br />
Room temp.: This phase is the desired Characterization condition (Room temp. and humidity)<br />
for <strong>Analysis</strong>. Much less bubbling (Popcorn effect) <strong>of</strong> the emulsion (left gray region). More like<br />
a “Moon surface visual effect” can be observed probably caused by the heat <strong>of</strong> the electron<br />
beam as it scans along the Interface. Zooming into the emulsion region revealed forming <strong>of</strong>
ubbles. The surface morphology <strong>of</strong> the emulsion droplets turns from a smooth gray surface<br />
into bubbles with much smoother surface than observed in Test run 3. No formation <strong>of</strong><br />
“Strawberry” type shape droplets like observed in Test run 3. No details other than bubble<br />
formation could be obtained.<br />
Drying: This step was performed to check if the dried form <strong>of</strong> the emulsion reveals more <strong>of</strong><br />
the emulsion details. Apply Vacuum to dry sample. Morphology <strong>Analysis</strong> <strong>of</strong> emulsion.. In this<br />
phase the emulsion seems to be stable and no enhanced violent bubbling <strong>of</strong> the emulsion like in<br />
Test run 3 (left gray region) could be observed probably caused by the vacuum and the heat <strong>of</strong><br />
the electron beam as it scans along the Interface. No details <strong>of</strong> Q<strong>dot</strong> aggregation could be<br />
obtained<br />
Rehydration: This step was added in this Test run. The rehydration was performed after the<br />
drying step.<br />
Room temp.: The Rehydrated emulsion was put back on Room temperature to check emulsion<br />
behavior. Emulsion seems to be stable: As the electron beam scans along the sample the no<br />
building <strong>of</strong> “Strawberry” type <strong>of</strong> emulsion droplets or development <strong>of</strong> additional micro bubbles<br />
on the surface <strong>of</strong> droplets could be observed. No details <strong>of</strong> Q<strong>dot</strong> aggregation could be obtained.<br />
40º C: This step was added in this Test run to simulate the Temperature conditions in the<br />
emulsion Preparation protocol (See Appendix B, Dr. Dean’s protocol). The Temperature was<br />
increased to 40º C to investigate what effect on the emulsion it has. The morphology started to<br />
reveal probably the “waxy” part 1 (Polyglyceryl-3 distearate + Cetearyla alcohol + mineral oil)<br />
<strong>of</strong> the emulsion.<br />
60º C: This step was added in this Test run to simulate the Temperature conditions in the<br />
emulsion Preparation protocol (See Appendix B, Dr. Dean’s protocol). The Temperature was<br />
increased to 60º C to investigate what effect on the emulsion it has. The morphology we<br />
believe reconfirmed the “waxy” part 1 (Polyglyceryl-3 distearate + Cetearyla alcohol + mineral<br />
oil) <strong>of</strong> the emulsion: We suspect that the emulsion breaks down to a fluid (mineral oil) and<br />
white colored spheres started to appear which might be crystals <strong>of</strong> the buffer used to prepare<br />
emulsion..<br />
At the end images <strong>of</strong> the Q<strong>dot</strong> sample were taken in secondary electron mode (see Figure 1)<br />
and Back scattering mode (see Figure 2 and 3). In secondary electron mode an Energy<br />
Dispersive X-Ray Spectroscopy (EDS) was performed and X-ray energy emission spectrum<br />
was taken to obtain Elemental <strong>Analysis</strong> data. (shown in Figure 4 and 5)
Figure 1. <strong>SEM</strong> micrograph <strong>of</strong> Q<strong>dot</strong> emulsion in secondary electron mode (20 kV, 1250x<br />
magnification)<br />
Figure 2. <strong>SEM</strong> micrograph <strong>of</strong> Q<strong>dot</strong> emulsion in back scattering Image mode (20 kV, 9822x<br />
magnification)
Figure 3. <strong>SEM</strong> micrograph <strong>of</strong> Q<strong>dot</strong> emulsion in back scattering Image mode (20 kV, 1250x<br />
magnification)<br />
Figure 4. Energy Dispersive X-Ray Spectroscopy (EDS) <strong>of</strong> Blank/ control emulsion: X-Ray<br />
Energy emission spectra, Elemental <strong>Analysis</strong>, <strong>SEM</strong> secondary electron mode.
The three last Peaks: Cr, Fe, Ni are probably from the stainless steel sample <strong>SEM</strong> holder. The<br />
rest <strong>of</strong> the Peaks are from the emulsion and contamination traces <strong>of</strong> the Water (cleaning sample<br />
Holder with Water).<br />
Figure 5. Energy Dispersive X-Ray Spectroscopy (EDS) <strong>of</strong> Q<strong>dot</strong> emulsion: X-Ray Energy<br />
emission spectra, Elemental <strong>Analysis</strong>, <strong>SEM</strong> secondary electron mode. The last peak Cr was<br />
probably from the stainless steel sample <strong>SEM</strong> holder. The Detector picked up Cd and Se<br />
Signals which reconfirmed that emulsion contained CdSe Q<strong>dot</strong>s. The rest <strong>of</strong> the Peaks are from<br />
the emulsion and contamination traces <strong>of</strong> the Water (cleaning sample Holder with Water).<br />
3. Conclusion<br />
Test run 1 and 2 showed that no useful data can be obtained with the electron beam pointed in<br />
the middle <strong>of</strong> the <strong>emulsions</strong>. Test run 3 and 4 demonstrated that if the electron beam is<br />
pointed at the edge <strong>of</strong> the sample holder that this area plays an important factor as a Interface<br />
reference point in visualizing the <strong>emulsions</strong> surface. The different chamber conditions in Test<br />
run 4 did not visualize the Q<strong>dot</strong> aggregation in the emulsion. However interesting visual<br />
effects in the morphological behavior <strong>of</strong> the surface <strong>of</strong> the emulsion exposed to the different<br />
sample chamber condition could be observed and were described in the Experimental section<br />
<strong>of</strong> this report: The Q<strong>dot</strong> emulsion seemed to be much more stable regarding the bubble “Pop<br />
corn” and “Strawberry” droplet visual effects. One hypotheses might explain the better<br />
physical stability <strong>of</strong> the Q<strong>dot</strong> emulsion when exposed to the heat generated by the electron<br />
beam: The CdSe might act as a kind <strong>of</strong> conductor conduit guiding the beam right through the<br />
emulsion to the bottom like a lightning rod the lightning to the ground. Whereas the blank/<br />
Control without the electrical conductor is longer exposed to the heat <strong>of</strong> the beam causing<br />
violent bubbling. The second more likely and reasonable hypotheses is simply by comparing<br />
the blank/ control emulsion to the Q<strong>dot</strong> emulsion by eye: The Q<strong>dot</strong> emulsion seemed to appear
in the delivered Micro centrifuge tube more viscose than the blank/ control which might<br />
explain the more stable behavior when exposed to the electron beam. Video, secondary<br />
electron and backscattering Image mode pictures have been possible to make but give no<br />
useful visual data about Q<strong>dot</strong> Aggregation. The X ray energy emission spectra could be<br />
obtained. Due to the nature <strong>of</strong> the emulsion mixture and trace contaminations (from cleaning<br />
Water etc.) quantitative <strong>Analysis</strong> has to evaluated cautiously and the data shown should be<br />
treated as preliminary Test results.<br />
Qualitative Elemental <strong>Analysis</strong>: Cd and Se signals most probably from the Q<strong>dot</strong>s have been<br />
picked up by the detection system.<br />
<strong>Wet</strong> <strong>SEM</strong> Method evaluation:<br />
1. The <strong>Wet</strong> <strong>SEM</strong> Instrument system (FEI, Quanta Field emission Scanning Electron<br />
Microscope, Model Q400F) used in this experiment with the standard set up with open conical<br />
sample holder is not useful for the study <strong>of</strong> <strong>Quantum</strong> <strong>dot</strong> aggregations in <strong>Quantum</strong> <strong>dot</strong> oil in<br />
Water <strong>emulsions</strong>.<br />
2. A different, closed Quantomix sample holder with membrane system using the<br />
backscattering Image mode for <strong>Analysis</strong> might give more useful data results. For a concept to<br />
this Technology please visit Quantomix Web home<br />
page:http://www.quantomix.com/tecnology02.html<br />
For detailed description <strong>of</strong> the sample cell: Click on QX-Capsule movie Icon.<br />
3. A new “cutting edge” Instrument system is under development by the FEI Microcoscope<br />
Company and might be a breakthrough method for <strong>Analysis</strong> <strong>of</strong> oil in Water <strong>emulsions</strong>:<br />
<strong>Wet</strong> STEM (Scanning Transmission Electron microscopy). This system uses the Transmission<br />
Electron Microscopy (TEM) technique and will be able to scan the sample like <strong>SEM</strong> under<br />
humidity controlled conditions. Instead <strong>of</strong> surface scanning the electron beam will scan<br />
through the emulsion and might give useful <strong>Analysis</strong> data about Q<strong>dot</strong> aggregation. Scattering<br />
effects <strong>of</strong> the emulsion and cross section diameter (certain drop sample size limitations) <strong>of</strong> the<br />
emulsion might be factors which may interfere and limit the <strong>Analysis</strong>. Test <strong>Analysis</strong> can be<br />
performed with a Microscope prototype system which will be available in the United States in<br />
January 2007.<br />
4. The next generation <strong>of</strong> Microscope system which might be useful for emulsion sample<br />
<strong>Analysis</strong> will be the <strong>Wet</strong> Cryo STEM system. It is the same Technology like the <strong>Wet</strong> STEM<br />
described above. The major advantage <strong>of</strong> this system will be 3 dimensional Images <strong>of</strong> cross<br />
sections <strong>of</strong> the frozen sample. This system is still under development and will be available in<br />
the near future. The disadvantage <strong>of</strong> this instrument will be the high purchasing cost.