Single-Crystal Colloidal Multilayers of Controlled Thickness
Single-Crystal Colloidal Multilayers of Controlled Thickness
Single-Crystal Colloidal Multilayers of Controlled Thickness

You also want an ePaper? Increase the reach of your titles
YUMPU automatically turns print PDFs into web optimized ePapers that Google loves.
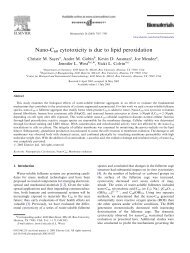
2132 Chem. Mater. 1999, 11, 2132-2140<br />
<strong>Single</strong>-<strong>Crystal</strong> <strong>Colloidal</strong> <strong>Multilayers</strong> <strong>of</strong> <strong>Controlled</strong><br />
<strong>Thickness</strong><br />
P. Jiang, J. F. Bertone, K. S. Hwang, and V. L. Colvin*<br />
Department <strong>of</strong> Chemistry and Center for Nanoscale Science and Technology, Rice University,<br />
MS-60, 6100 Main Street, Houston, Texas 77005<br />
Received February 5, 1999. Revised Manuscript Received April 19, 1999<br />
Materials whose dielectric constant varies spatially with submicrometer periodicity exhibit<br />
diffractive optical properties which are potentially valuable in a number <strong>of</strong> existing and<br />
emerging applications. Here, such systems are fabricated by exploiting the spontaneous<br />
crystallization <strong>of</strong> monodisperse silica spheres into close-packed arrays. By reliance on a<br />
vertical deposition technique to pack the spherical colloids into close-packed silica-air arrays,<br />
high quality samples can be prepared with thicknesses up to 50 µm. These samples are<br />
planar and thus suitable for optical characterization. Scanning electron microscopy (SEM)<br />
<strong>of</strong> these materials illustrates the close-packed ordering <strong>of</strong> the spherical colloids in planes<br />
parallel to the substrate; cross-sectional SEM micrographs <strong>of</strong> the arrays as well as optical<br />
methods are used to measure sample thickness and uniformity. Normal-incidence transmission<br />
spectra in the visible and near-infrared regions show distinct peaks due to diffraction<br />
from the colloidal layers. While these basic optical characteristics are similar to thicker and<br />
polycrystalline gravity-sedimented colloidal crystals, the systematic control over the number<br />
<strong>of</strong> colloidal layers allows the effect <strong>of</strong> sample thickness on the optical spectrum to be studied<br />
for the first time.<br />
Introduction<br />
Many novel properties can be engineered in periodic<br />
dielectric materials by controlling the symmetry and<br />
length scale <strong>of</strong> a sample’s microstructure. 1-6 This idea<br />
has been used to engineer microwave optics, 4 and<br />
recently these dielectric structures have been termed<br />
“photonic band gap” materials. The exciting potential<br />
<strong>of</strong> these structured materials for optical applications has<br />
motivated efforts to shrink the length scale <strong>of</strong> the<br />
periodicity to submicrometer sizes. 7-16 Lithographically<br />
* To whom correspondence should be addressed. E-mail: colvin@<br />
rice.edu.<br />
(1) Petrov, E. P.; Bogomolov, V. N.; Kalosha, I. I.; Gaponenko, S.<br />
V. Phys. Rev. Lett. 1998, 81, 77.<br />
(2) Lin, S. Y.; Fleming, J. G.; Hetherington, D. L.; Smith, B. K.;<br />
Biswas, R.; Ho, K. M.; Sigalas, M. M.; Zubrzycki, W.; Kurtz, S. R.; Bur,<br />
J. Nature 1998, 394, 251.<br />
(3) Gupta, S.; Tuttle, G.; Sigalas, M.; Ho, K. M. Appl. Phys. Lett.<br />
1997, 71, 2412.<br />
(4) Lin, S. Y.; Chow, E.; Hietala, V.; Villeneuve, P. R.; Joannopoulos,<br />
J. D. Science 1998, 282, 274.<br />
(5) Holtz, J. H.; Asher, S. A. Nature 1997, 389, 829.<br />
(6) Lin, V. S. Y.; Motesharei, K.; Dancil, K. P. S.; Sailor, M. J.;<br />
Ghadiri, M. R. Science 1997, 278, 840.<br />
(7) Velev, O. D.; Jede, T. A.; Lobo, R. F.; Lenh<strong>of</strong>f, A. M. Nature 1997,<br />
389, 447.<br />
(8) Zakhidov, A. A.; Baughman, R. H.; Iqbal, Z.; Cui, C.; Khayrullin,<br />
I.; Dantas, S. O.; Marti, J.; Ralchenko, V. G. Science 1998, 282, 897.<br />
(9) Holland, B. T.; Blanford, C. F.; Stein, A. Science 1998, 281, 538.<br />
(10) Davis, S. A.; Burkett, S. L.; Mendelson, N. H.; Mann, S. Nature<br />
1997, 385, 420.<br />
(11) Imh<strong>of</strong>, A.; Pine, D. J. Nature 1997, 389, 948.<br />
(12) Yablonovitch, E. J. Opt. Soc. Am. B 1993, 10, 283.<br />
(13) Wijnhoven, J. E. G.; Vos, W. L. Science 1998, 281, 802.<br />
(14) Pan, G.; Kesavamoorthy, R.; Asher, S. A. J. Am. Chem. Soc.<br />
1998, 120, 6525.<br />
(15) Joannopoulos, J. D.; Meade, R. D.; Winn, J. N. Photonic<br />
<strong>Crystal</strong>s: Molding the Flow <strong>of</strong> Light; Princeton University Press:<br />
Princeton, NJ, 1995.<br />
prepared arrays <strong>of</strong> alumina rods, for example, were<br />
recently used as a planar waveguide device operating<br />
in the gigahertz region; 4 alternating layers <strong>of</strong> AlGaAs<br />
and AlAs deposited through chemical vapor provide a<br />
stacked dielectric cavity used in distributed feedback<br />
lasers. 17 While these methods for creating dielectric<br />
structures have found use in commercial products, the<br />
potential applications <strong>of</strong> photonic band gap materials<br />
at optical wavelengths have been limited by the difficulty<br />
in fabricating three-dimensionally periodic materials<br />
with nanometer-scale structures.<br />
Recently, colloidal crystals have received renewed<br />
attention as an avenue to achieving controlled dielectric<br />
periodicity. 18-21 <strong>Colloidal</strong> crystals are regular crystalline<br />
arrays <strong>of</strong> highly monodisperse spheres <strong>of</strong> dielectric<br />
materials such as silica or polymers. 22 These materials<br />
have been the subject <strong>of</strong> study for several decades due<br />
to their unusual optical 23-28 and thermodynamic<br />
(16) Joannopoulos, J. D.; Villeneuve, P. R.; Fan, S. Nature 1997,<br />
386, 143.<br />
(17) Tanaka, K.; Nakamura, T.; Takamatsu, W.; Yamanishi, M.;<br />
Lee, Y.; Ishihara, T. Phys. Rev. Lett. 1995, 74, 3380.<br />
(18) Asher, S. A.; Holtz, J.; Weissman, J.; Pan, G. MRS Bull. 1998,<br />
October, 44.<br />
(19) Miguez, H.; Meseguer, F.; Lopez, C.; Blanco, A.; Moya, J. S.;<br />
Requena, J.; Mifsud, A.; Fornes, V. Adv. Mater. 1998, 10, 480.<br />
(20) Bogomolov, V. N.; Prok<strong>of</strong>′ev, A. V.; Shelykh, A. I. Phys. Solid<br />
State 1998, 40, 594.<br />
(21) Lidorikis, E.; Li., Q.; Soukoulis, C. M. Phys. Rev. E 1997, 55,<br />
3613.<br />
(22) Pieranski, P. Contemp. Phys. 1983, 24, 25.<br />
(23) Yoshiyama, T.; Sogami, I. Phys. Rev. Lett. 1984, 53, 2153.<br />
(24) Sanders, J. V. Acta <strong>Crystal</strong>logr. 1968, A24, 427.<br />
(25) Goodwin, J. W.; Ottewil, R. H.; Parentich, A. J. Phys. Chem.<br />
1980, 84, 1580.<br />
(26) Krieger, I. M.; O’Neill, F. M. J. Am. Chem. Soc. 1968, 90, 613.<br />
(27) Hiltner, P. A.; Krieger, I. M. J. Phys. Chem. 1969, 73, 2386.<br />
(28) Monovoukas, Y.; Gast, A. P. Langmuir 1991, 7, 460.<br />
10.1021/cm990080+ CCC: $18.00 © 1999 American Chemical Society<br />
Published on Web 07/15/1999
<strong>Single</strong>-<strong>Crystal</strong> <strong>Colloidal</strong> <strong>Multilayers</strong> Chem. Mater., Vol. 11, No. 8, 1999 2133<br />
properties. 29-35 <strong>Colloidal</strong> crystals <strong>of</strong>fer a starting point<br />
for the fabrication <strong>of</strong> periodic dielectric materials created<br />
through self-assembly rather than lithographic means.<br />
Here, one has the potential to create samples with full<br />
three-dimensional ordering, a feature important for<br />
engineering larger and more complete photonic band<br />
gaps. Also, self-assembly methods can create thicker<br />
materials than those made using lithography. While the<br />
role <strong>of</strong> sample thickness in the optical properties <strong>of</strong><br />
colloidal crystals has not been investigated, it is clear<br />
that control over this important parameter would be<br />
quite valuable in materials engineering. In addition,<br />
self-assembly methods are not limited in their length<br />
scale, and it is feasible to create materials that are<br />
active in the ultraviolet and even the s<strong>of</strong>t X-ray range<br />
using colloids with smaller diameters. Finally, as has<br />
been demonstrated recently, colloidal crystals provide<br />
an ideal scaffold for the creation <strong>of</strong> both polymeric<br />
and inorganic samples with complex porous<br />
structures. 7-9,13,36-40 Such samples may exhibit more<br />
complete photonic band gaps than silica-air crystals as<br />
higher index contrasts are possible; in addition, they<br />
also may find applications in catalysis and separation<br />
technologies. The success <strong>of</strong> these nonlithographic routes<br />
to the formation <strong>of</strong> periodic dielectric structures requires<br />
the development <strong>of</strong> robust methods for creating high<br />
quality, uniform, and mechanically stable colloidal<br />
crystals.<br />
A popular method for creating colloidal crystals is the<br />
gravity sedimentation <strong>of</strong> colloids from dispersions; 19,22,32,41<br />
recent progress in the area has focused on strategies<br />
for strengthening the crystals and generating sample<br />
formats well suited for optical testing. In one instance,<br />
silica colloids were crystallized between parallel plates,<br />
and the solvent was then polymerized so as to trap their<br />
crystalline order. 42-44 This stabilization comes at a cost,<br />
however, as the matrix material has a refractive index<br />
closely matched to that <strong>of</strong> the colloids, thus reducing<br />
their diffractive properties. In other work, silica colloids<br />
were crystallized in capillaries, and the solvent was<br />
allowed to evaporate. The resulting silica-air structures<br />
have strong diffractive properties, and transmission<br />
(29) Hartl, W.; Klemp, R.; Versmold, H. Phase Transitions 1990,<br />
21, 229.<br />
(30) Smits, C.; van Duijneveldt, J. S.; Dhont, J. K.; Lekkerkerker,<br />
H. N. W. Phase Transitions 1990, 21, 157.<br />
(31) Aastuen, D. J. W.; Clark, N. A.; Swindal, J. C.; Muzny, C. D.<br />
Phase Transitions 1990, 21, 139.<br />
(32) Davis, K. E.; Russel, W. B.; Glantschnig, W. J. J. Chem. Soc.,<br />
Faraday Trans. 1991, 87, 411.<br />
(33) Imh<strong>of</strong>, A.; van Blaaderen, A.; Maret, G.; Mellema, J.; Dhont,<br />
J. K. G. J. Chem. Phys. 1994, 100, 2170.<br />
(34) Kesavamoorthy, R.; Super, M. S.; Asher, S. A. J. Appl. Phys.<br />
1992, 71, 1116.<br />
(35) Rundquist, P. A.; Jagannathan, S.; Kesavamoorthy, R.; Brnardic,<br />
C.; Xu, S.; Asher, S. A. J. Chem. Phys. 1991, 94, 711.<br />
(36) Velev, O. D.; Jede, T. A.; Lobo, R. F.; Lenh<strong>of</strong>f, A. M. Chem.<br />
Mater. 1998, 10, 3597.<br />
(37) Park, S. H.; Xia, Y. Adv. Mater. 1998, 10, 1045.<br />
(38) Park, S. H.; Xia, Y. Chem. Mater. 1998, 10, 1745.<br />
(39) Jiang, P.; Hwang, K. S.; Mittleman, D. M.; Bertone, J. F.;<br />
Colvin, V. L. J. Am. Chem. Soc., submitted for publication.<br />
(40) Johnson, S. A.; Ollivier, P. J.; Mallouk, T. E. Science 1999, 283,<br />
963.<br />
(41) Mayoral, R.; Requena, J.; Moya, J. S.; Lopez, C.; Cintas, A.;<br />
Miguez, H.; Meseguer, F.; Vazquez, L.; Holgado, M.; Blanco, A. Adv.<br />
Mater. 1997, 9, 257.<br />
(42) Jethmalani, J. M.; Ford, W. T. Chem. Mater. 1996, 8, 2138.<br />
(43) Jethmalani, J. M.; Sunkara, H. B.; Ford, W. T.; Willoughby,<br />
S. L.; Ackerson, B. J. Langmuir 1997, 13, 2633.<br />
(44) Jethmalani, J. M.; Ford, W. T.; Beaucage, G. Langmuir 1997,<br />
13, 3338.<br />
spectra can be collected over some regions. 45 Nonetheless,<br />
gravity-sedimented samples generally contain<br />
polycrystalline domains <strong>of</strong> unknown sizes. 46,47 In addition,<br />
during the gravity sedimentation method, crystal<br />
formation can only occur at specific volume fractions <strong>of</strong><br />
colloids. 22 As a result, array growth is difficult to adjust,<br />
and thus film thickness is not easily controlled.<br />
Other methods for ordering colloids into arrays have<br />
been explored by investigators seeking to make dense<br />
monolayer films <strong>of</strong> close-packed colloids for nonoptical<br />
applications. Under the right conditions, colloid solutions<br />
that are spun-coated onto surfaces provide high<br />
quality monolayers. 48-52 Convective self-assembly <strong>of</strong><br />
wetting solutions is also a route for making ordered<br />
monolayers and structures <strong>of</strong> nanocrystals on a variety<br />
<strong>of</strong> substrates. 53 Another method applied to polymer<br />
colloids uses the flow <strong>of</strong> solvent through micromachined<br />
channels to create dense colloidal arrays <strong>of</strong> multiple<br />
layers. 37,38,54,55 Finally, recent work by Nagayama et<br />
al. 56-65 has exploited capillary forces to drive the assembly<br />
<strong>of</strong> larger (d > 1 µm) polystyrene colloids on flat<br />
surfaces. This method, which is conceptually similar to<br />
the Langmuir-Blodgett methods for film deposition,<br />
creates ordered monolayer films on nearly any vertical<br />
surface. Under the appropriate solvent and colloid<br />
conditions Nagayama et al. showed that patches <strong>of</strong> biand<br />
trilayer arrays could also be formed. All <strong>of</strong> these<br />
methods have the advantage <strong>of</strong> producing well-ordered<br />
films on planar surfaces quite rapidly; however, in most<br />
instances the deposition techniques have been optimized<br />
for the formation <strong>of</strong> monolayer films.<br />
In this paper a self-assembly technique which relies<br />
on capillary forces to organize colloids is used to<br />
fabricate colloidal crystal multilayers. These arrays are<br />
ordered over long (∼1 cm) length scales and can be<br />
fabricated with thicknesses ranging from two layers to<br />
several hundred layers. Moreover, the thickness <strong>of</strong> the<br />
resulting sample can be precisely dictated through<br />
(45) Vos, W. L.; Sprik, R.; van Blaaderen, A.; Imh<strong>of</strong>, A.; Lagendijk,<br />
A.; Wegdam, G. H. Phys. Rev. B 1996, 53, 16231.<br />
(46) Clark, N. A.; Hurd, A. J.; Ackerson, B. J. Nature 1979, 281,<br />
57.<br />
(47) Okubo, T. Langmuir 1994, 10, 1695.<br />
(48) Deckman, H. W.; Dunsmuir, J. H. Appl. Phys. Lett. 1982, 41,<br />
377.<br />
(49) Winzer, M.; Kleiber, M.; Dix, N.; Wiesendanger, R. Appl. Phys.<br />
A 1996, 63, 617.<br />
(50) Burmeister, F.; Schafle, C.; Keilh<strong>of</strong>er, B.; Bechinger, C.;<br />
Boneberg, J.; Leiderer, P. Adv. Mater. 1998, 10, 495.<br />
(51) Deckman, H. W.; Dunsmuir, J. H. J. Vac. Sci. Technol. B 1983,<br />
1, 1109.<br />
(52) Hulteen, J. C.; Van Duyne, R. P. J. Vac. Sci. Technol. 1995,<br />
13, 1553.<br />
(53) O’hara, P. C.; Leff, D. V.; Heath, J. R.; Gelbart, W. M. Phys.<br />
Rev. Lett. 1995, 75, 3466.<br />
(54) Park, S. H.; Qin, D.; Xia, Y. Adv. Mater. 1998, 10, 1028.<br />
(55) Park, S. H.; Xia, Y. Langmuir 1999, 15, 266.<br />
(56) Denkov, N. D.; Velev, O. D.; Kralchevsky, P. A.; Ivanov, I. B.;<br />
Yoshimura, H.; Nagayama, K. Nature 1993, 361, 26.<br />
(57) Dimitrov, A. S.; Nagayama, K. Langmuir 1996, 12, 1303.<br />
(58) Nagayama, K. Phase Transitions 1993, 45, 185.<br />
(59) Dimitrov, A. S.; Dushkin, C. D.; Yoshimura, H.; Nagayama,<br />
K. Langmuir 1994, 10, 432.<br />
(60) Dushkin, C. D.; Nagayama, K.; Miwa, T.; Kralchevsky, P. A.<br />
Langmuir 1993, 9, 3695.<br />
(61) Adachi, E.; Dimitrov, A. S.; Nagayama, K. Langmuir 1995, 11,<br />
1057.<br />
(62) Nagayama, K. Colloids Surf. A 1996, 109, 363.<br />
(63) Dimitrov, A. S.; Nagayama, K. Chem. Phys. Lett. 1995, 243,<br />
462.<br />
(64) Denkov, N. D.; Velev, O. D.; Kralchevsky, P. A.; Ivanov, I. B.;<br />
Yoshimura, H.; Nagayama, K. Langmuir 1992, 8, 3183.<br />
(65) Yamaki, M.; Higo, J.; Nagayama, K. Langmuir 1995, 11, 2975.
2134 Chem. Mater., Vol. 11, No. 8, 1999 Jiang et al.<br />
control <strong>of</strong> sphere size and concentration in solution. This<br />
deposition behavior can be adequately simulated using<br />
existing models <strong>of</strong> film formation developed for monolayer<br />
samples. The resulting planar colloidal crystals<br />
are highly ordered, and evaporation <strong>of</strong> the solvent leaves<br />
a silica-air array with good optical contrast and mechanical<br />
stability. The optical properties <strong>of</strong> these samples<br />
are measured at normal incidence and their qualitative<br />
features and trends compared to gravity sedimented<br />
colloidal crystals.<br />
Experimental Methods<br />
Materials and Substrates. All solvents and chemicals are<br />
<strong>of</strong> reagent quality and filtered by 0.22 µm syringe filters<br />
(Gelman) except for tetraethoxysilane (99%, Alfa) and 3-(trimethoxysilyl)propyl<br />
methacrylate (TPM, 98%, Aldrich) which<br />
are freshly vacuum distilled before use. The 200 pro<strong>of</strong> ethanol<br />
is obtained from Pharmaco Products, and 29.6% ammonium<br />
hydroxide is purchased from Fisher. Ultrapure water (18.2<br />
MΩcm-1 ) is used directly from a Milli-Q water system.<br />
Microslides (75 × 25 × 1 mm, Fisher) are cut into two equal<br />
halves along the long sides and are used as substrates. Glass<br />
scintillation vials (20 mL, Fisher) are used as experimental<br />
cells.<br />
Instrumentation. Scanning electron microscopy is carried<br />
out on a s<strong>of</strong>tware-controlled LEO 440 SEM designed specifically<br />
for electron-beam lithography. Transmission spectra are<br />
obtained using an Ocean Optics ST2000 fiber optic UV-near-<br />
IR spectrometer. A Coulter N4 Plus laser dynamic light<br />
scattering (DLS) instrument is used to size the particles. A<br />
CrC-100 sputtering system is used to sputter a thin layer (3-4<br />
nm) <strong>of</strong> gold on samples before SEM analysis.<br />
Colloid Synthesis and Purification. Monodisperse SiO2<br />
nanospheres are synthesized following the Stober-Fink-Bohn<br />
method. 66 Nanospheres with diameters ranging from 200 to<br />
700 nm and relative standard deviations smaller than 7% are<br />
obtained through strict control <strong>of</strong> the reaction conditions. 67 The<br />
sizes and size distributions <strong>of</strong> these samples are obtained from<br />
SEM and DLS measurements. Over 200 spheres are sized<br />
using SEM in order to arrive at the reported diameters. Before<br />
deposition, the silica alcosols are washed with 200 pro<strong>of</strong><br />
ethanol by repeated centrifugation and ultrasonic dispersion<br />
cycles in order to remove impurities, such as ammonia, water,<br />
and unreacted tetraethoxysilane. Six cycles are usually performed.<br />
3-(trimethoxysilyl)propyl methacrylate (TPM) coated<br />
silica is synthesized using a published method68 and purified<br />
as above. All microscopy data presented in this work, however,<br />
are from particles without TPM coating. The solvent <strong>of</strong><br />
deposition, rather than the coating surface, is the key parameter<br />
in controlling film deposition.<br />
Experimental Apparatus and Procedures. Prior to use<br />
all microslides and scintillation vials are soaked in a chromicsulfuric<br />
acid cleaning solution overnight, rinsed well with<br />
ultrapure water from a Milli-Q water system, and dried in a<br />
stream <strong>of</strong> nitrogen. A clean microslide is then placed into 15<br />
mL <strong>of</strong> purified silica alcosol in a clean scintillation vial. The<br />
vial is covered by a 1200 mL crystallizing dish to keep out<br />
external airflow and contamination. The entire apparatus is<br />
placed on a vibration-free bench in a temperature-controlled<br />
laboratory (22 ( 1 °C). For the preparation <strong>of</strong> these multilayer<br />
samples, no substrate withdrawl is necessary. The volume<br />
fractions <strong>of</strong> different samples are determined by drying 6 mL<br />
<strong>of</strong> purified silica alcosol in 80 °C vacuum oven overnight and<br />
then weighing the residual solid. 2.04 g/mL is used as the<br />
density <strong>of</strong> silica, 67 though its actual density may be somewhat<br />
lower. Then, the samples are diluted or concentrated using a<br />
centrifuge-redisperse cycle to the required volume fractions.<br />
(66) Stober, W.; Fink, A.; Bohn, E. J. Colloid Interface Sci. 1968,<br />
26, 62.<br />
(67) Bogush, G. H.; Tracy, M. A.; Zukoski IV, C. F. J. Non-Cryst.<br />
Solids 1988, 104, 95.<br />
(68) Philipse, A. P.; Vrij, A. J. Colloid Interface Sci. 1989, 128, 121.<br />
For evaluation <strong>of</strong> the role <strong>of</strong> sphere size on film formation,<br />
six samples (215.2 (3.9%), 298.6 (3.8%), 324.1 (7.2%), 396.6<br />
(5.4%), 437.4 (4.2%), and 508.6 nm (4.3%)) were used. Numbers<br />
in parentheses following the sphere diameters refer to the<br />
relative standard deviation <strong>of</strong> the measured diameters. All the<br />
samples were placed under the same crystallizing dish to<br />
ensure identical ethanol evaporation rates. Samples with<br />
volume fractions <strong>of</strong> 0.1%, 0.5%, 1.0%, 1.5%, 2.0%, and 3.0%<br />
and the same particle size (298.6 nm (3.8%)) were used to<br />
determine the effect <strong>of</strong> volume fraction on the film thickness.<br />
Samples (215.2 (3.9%) and 279.2 nm (4.6%)) with volume<br />
fractions <strong>of</strong> 1% were used to determine the effect <strong>of</strong> solvent<br />
evaporation rate on the film thickness. Duplicates <strong>of</strong> each<br />
sample were tested under three different evaporation conditions:<br />
open to ambient atmosphere, covered in a crystallizing<br />
dish, and covered in a crystallizing dish with a small amount<br />
<strong>of</strong> ethanol (20 mL in a 50 mL beaker). One <strong>of</strong> the duplicates<br />
was used to determine the evaporation rate by weighing the<br />
vial on a digital analytical balance. The typical solvent<br />
evaporation rate, given in units <strong>of</strong> volume per time, was found<br />
to be 9 × 10 -4 cm 3 /min.<br />
Thicker films are fabricated by successive dip coatings. After<br />
each single coating is deposited, the film is air-dried for at least<br />
24 h and dipped again into another purified silica alcosol with<br />
the same particle size. The coating and drying cycle can be<br />
repeated to systematically increase film thickness.<br />
Characterization <strong>of</strong> <strong>Colloidal</strong> <strong>Crystal</strong> Films. Scanning<br />
electron microscopy (SEM) is used to determine the film<br />
thickness. A thin layer <strong>of</strong> gold is sputtered onto the samples<br />
prior to imaging. To reveal an edge appropriate for crosssectional<br />
analysis, samples are scraped using a sharp razor<br />
blade. By tilting the specimen 30-40°, it is possible to image<br />
this edge and quantify film thickness; 10 random locations<br />
from the center square centimeter <strong>of</strong> the sample are analyzed<br />
for thickness. Optical properties <strong>of</strong> the silica colloidal singlecrystal<br />
films are evaluated by measuring their transmission<br />
spectra at normal incidence, using an Ocean Optics ST2000<br />
fiber optic UV-near-IR spectrometer.<br />
Results<br />
<strong>Crystal</strong>line quality is among the most important<br />
parameters in determining the performance <strong>of</strong> colloidal<br />
crystals in optical applications. The formation <strong>of</strong> point<br />
defects or domains can have an enormous impact on the<br />
diffraction properties. Figure 1A shows a typical SEM<br />
image <strong>of</strong> a single crystal <strong>of</strong> colloidal silica with a 298.6<br />
nm diameter, grown using the methods described above.<br />
This sample exhibits an ordered close-packed arrangement<br />
<strong>of</strong> silica colloids over a sample area <strong>of</strong> 10 µm which<br />
extends over an even larger area; this can be illustrated<br />
by the two-dimensional Fourier transform <strong>of</strong> a lowmagnification<br />
SEM image. Such data is shown in the<br />
inset <strong>of</strong> Figure 1A. The sharp peaks confirm the presence<br />
<strong>of</strong> long-range crystalline order, extending over the<br />
largest length scales (40 × 40 µm 2 ) accessible in a single<br />
low-magnification image. Perfectly ordered films can be<br />
made for a variety <strong>of</strong> sphere diameters. Parts A and B<br />
<strong>of</strong> Figure 4 show SEM images <strong>of</strong> two crystals with<br />
different particle sizes (206.4 and 437.4 nm, respectively).<br />
As in Figure 1A, long-range order is confirmed<br />
by Fourier transform <strong>of</strong> low magnification images<br />
(insets to Figure 4).<br />
It is a challenge to use microscopy for pro<strong>of</strong> <strong>of</strong> sample<br />
order over centimeter distances. Lower magnification<br />
images do not have the spatial resolution needed to<br />
identify distinct colloids; one approach is to compare<br />
micrographs <strong>of</strong> 40 µm 2 areas collected as a sequence<br />
during the translation <strong>of</strong> the sample. If domain boundaries<br />
are observed during this movement, then the
<strong>Single</strong>-<strong>Crystal</strong> <strong>Colloidal</strong> <strong>Multilayers</strong> Chem. Mater., Vol. 11, No. 8, 1999 2135<br />
Figure 1. (A) Typical scanning electron micrograph (SEM)<br />
<strong>of</strong> a sample (top view) showing spheres <strong>of</strong> 298.6 nm diameter.<br />
The inset shows a Fourier transform <strong>of</strong> a 40 × 40 µm 2 region.<br />
(B) Typical SEM side view <strong>of</strong> the same sample at the same<br />
magnification (×12 000), showing a perspective view <strong>of</strong> the<br />
cleaved face and the underlying substrate.<br />
hexagonal registry <strong>of</strong> the images evident in their FFTs<br />
will not be aligned. Figure 2 shows such data for four<br />
representative images taken at the edges <strong>of</strong> a4mm<br />
square. The alignment <strong>of</strong> the spots in all four images<br />
illustrates the registry <strong>of</strong> the array lattice over these<br />
long length scales. Morevoer, analysis <strong>of</strong> many intermediate<br />
images also showed perfect alignment and no<br />
evidence <strong>of</strong> any grain boundaries.<br />
While order within the plane parallel to the glass<br />
substrate is important for the optical properties <strong>of</strong> the<br />
films, especially when they are evaluated away from<br />
normal incidence, the stacking <strong>of</strong> close-packed layers<br />
perpendicular to the substrate is responsible for the<br />
diffraction observed in normal-incidence transmission<br />
measurements. To evaluate this issue, colloid films can<br />
be abraded to reveal their stacking perpendicular to the<br />
substrate as shown in Figure 1B. This cross-section<br />
shows that the close-packed structure extends uniformly<br />
over the 15 layers shown; Figure 8B shows a thicker<br />
50 layer sample which also exhibits a regular arrangement<br />
from the top surface to the bottom surface. The<br />
visual appearance <strong>of</strong> the samples (see Figure 3) is a<br />
testament to this high crystalline quality and the<br />
uniform thickness <strong>of</strong> these films.<br />
To form high quality planar crystals, particle size<br />
distribution (S.D.) is a crucial factor. This is illustrated<br />
in Figure 5, which shows SEM images <strong>of</strong> two samples<br />
with different size distributions (3.8% and 14.2% relative<br />
standard deviations, respectively). The sample with<br />
Figure 2. Fourier transforms (FFT) <strong>of</strong> four 11.75 × 11.75 µm 2<br />
regions <strong>of</strong> a1cm 2 colloidal silica single crystal. These images<br />
were part <strong>of</strong> a series taken every 50 µm overa4× 4mm<br />
square region; they represent the four corners and image c<br />
was closest to the edge <strong>of</strong> the sample. The four parallel dashed<br />
lines indicate one reference direction, and demonstrate that<br />
the four images are roughly <strong>of</strong> the same orientation, as were<br />
all intermediate images. Within a 4 × 4 mm 2 region, the<br />
largest deviation from this orientation is ∼1.6 degrees, represented<br />
in image c. This demonstrates that the crystallographic<br />
orientation <strong>of</strong> the sample is preserved over this entire<br />
region.<br />
a narrow size distribution exhibits order over a long<br />
length scale and sharp peaks in the Fourier transform<br />
<strong>of</strong> a low-magnification SEM image; the polydisperse<br />
sample has only short-range order and exhibits rings<br />
in the Fourier transform. Films that lack crystalline<br />
quality, such as the one shown in Figure 5B, even when<br />
relatively thin, are white and opaque. This is in sharp<br />
contrast to the brilliant color and transparency apparent<br />
in more ordered films (Figure 3). Data collected from<br />
over 20 samples suggest that when this method is used,<br />
colloids must have a size distribution with relative<br />
standard deviation less than 8% (on the diameter) in<br />
order to form high quality close-packed crystals and<br />
thus good optical samples.<br />
For this deposition process, two parameters allow for<br />
control <strong>of</strong> film thickness (or number <strong>of</strong> colloidal layers):<br />
particle diameter (d) and particle volume fraction (V.F.).<br />
Figure 6 shows how film thickness varies with these<br />
two parameters. For these measurements layer thickness<br />
is determined using cross-sectional SEM images<br />
<strong>of</strong> the types shown in Figures 1B, 7, and 8. Particle size<br />
affects the film thickness in a systematic way: for the<br />
same volume fraction, a solution <strong>of</strong> larger particles<br />
yields fewer layers. Two examples are shown in Figure<br />
7, and the relationship is quantified in Figure 6A.<br />
Particle volume fraction also affects film thickness<br />
(Figure 6B); more concentrated colloidal solutions leave<br />
thicker multilayer deposits (Figure 8). Because film<br />
uniformity degrades significantly when colloidal solutions<br />
<strong>of</strong> more than 4% volume fraction are used, the<br />
formation <strong>of</strong> thicker films requires multiple coating. In<br />
this approach, samples are allowed to dry and then are
2136 Chem. Mater., Vol. 11, No. 8, 1999 Jiang et al.<br />
Figure 3. (A) Photograph <strong>of</strong> three samples with different<br />
sphere diameters (307.2, 353.0, and 383.7 nm, from left to<br />
right). The samples are clear and highly uniform. (B) Photograph<br />
<strong>of</strong> the same samples illuminated with white light.<br />
reimmersed in the colloidal solutions; new colloidal<br />
multilayers form easily on top <strong>of</strong> the original ones and<br />
the process can be repeated many times with the<br />
thickness increasing linearly after each deposition.<br />
Figure 9 shows a scanning electron micrograph <strong>of</strong> a<br />
portion <strong>of</strong> a multicoated sample.<br />
The optical properties <strong>of</strong> these films can be evaluated<br />
using visible-near-IR transmission in normal incidence.<br />
Figure 10 shows scaled absorption spectra vs particle<br />
size for a wide range <strong>of</strong> colloidal sphere diameters. Two<br />
notable features <strong>of</strong> the spectra are sharp peaks due to<br />
the Bragg diffraction <strong>of</strong> visible light from the ordered<br />
spheres and a background rising at shorter wavelengths.<br />
The systematic change in color seen in transmission<br />
and reflection <strong>of</strong> uniform films <strong>of</strong> different<br />
particle sizes (see Figure 3) is due to Bragg diffraction.<br />
Figure 11 shows the changes in the optical transmission<br />
spectra <strong>of</strong> films <strong>of</strong> different thickness made using equal<br />
sized particles. The background has been subtracted in<br />
these data so that they can be compared easily. The<br />
intensity <strong>of</strong> the diffracted peak increases approximately<br />
linearly with the number <strong>of</strong> layers, although this is not<br />
evident in Figure 11 because the data have been scaled<br />
to uniform height. Also, the peak widths narrow as<br />
sample thickness is increased. Finally, Fabry-Perot<br />
fringes (indicated by the arrows in Figure 11) become<br />
smaller and more closely spaced in thicker samples.<br />
Discussion<br />
<strong>Crystal</strong> Structure <strong>of</strong> Planar Arrays. SEM images<br />
<strong>of</strong> the top view <strong>of</strong> these samples show that the colloids<br />
are arranged in a close-packed fashion, with each sphere<br />
Figure 4. SEM images <strong>of</strong> two samples with different particle<br />
diameters (×12 000 magnification). The insets show Fourier<br />
transforms <strong>of</strong> 40 × 40 µm 2 regions. Key: (A) d ) 206.4 nm;<br />
(B) d ) 437.4 nm.<br />
touching six others in one layer (Figures 1 and 4). This<br />
close-packing arrangement is well-known in crystals<br />
comprised <strong>of</strong> colloids, such as these silica spheres, whose<br />
ionic interactions are minimal. 69,70 In this close-packed<br />
geometry, whether the structure is face-centered cubic<br />
(ABCABC...), hexagonal close-packed (ABABAB...), or<br />
randomly stacked, these images illustrate that the<br />
samples are oriented with their (111) axes parallel to<br />
the substrate.<br />
Exact characterization <strong>of</strong> the crystal structure <strong>of</strong> these<br />
samples from SEM micrographs alone is problematic.<br />
Though images such as these confirm a regular closepacked<br />
arrangement (Figures 1B, 7, and 8), they cannot<br />
be used to distinguish between the fcc and hcp structures.<br />
This is because it is difficult to determine the<br />
exact angle <strong>of</strong> the cross-sectional view, which in turn<br />
makes it difficult to assess which crystal face is visualized<br />
in these images. Confocal microscopy <strong>of</strong> gravity<br />
sedimented colloidal crystals 71 has indicated that the<br />
stacking between (111) planes is neither fcc nor hcp but<br />
is instead a random arrangement. Theoretical calculations,<br />
though, have indicated that the fcc structure is<br />
stabilized slightly even with completely noninteracting<br />
spheres. 72,73 In future studies, where the transmission<br />
(69) Tsunekawa, S.; Barnakov, Y. A.; Poborchii, V. V.; Smoilovich,<br />
S. M.; Kasuya, A.; Nishina, Y. Microporous Mater. 1996, 8, 275.<br />
(70) Miguez, H.; Meseguer, F.; Lopez, C.; Mifsud, A.; Moya, J. S.;<br />
Vazquez, L. Langmuir 1997, 13, 6009.<br />
(71) van Blaaderen, A.; Ruel, R.; Wiltzius, P. Nature 1997, 385, 321.<br />
(72) Woodcock, L. V. Nature 1997, 385, 141.
<strong>Single</strong>-<strong>Crystal</strong> <strong>Colloidal</strong> <strong>Multilayers</strong> Chem. Mater., Vol. 11, No. 8, 1999 2137<br />
Figure 5. SEM images <strong>of</strong> two samples with different particle<br />
size distributions (S.D.) (×12 000 magnification). The insets<br />
show Fourier transforms <strong>of</strong> 40 × 40 µm 2 regions. (A) S.D. )<br />
3.8%; (B) S.D. ) 14.2%.<br />
Figure 6. (A, top) Number <strong>of</strong> layers vs the inverse <strong>of</strong> the<br />
particle diameter, for samples grown from a 1% V.F. solution.<br />
(B, bottom) Number <strong>of</strong> layers vs the particle volume fraction,<br />
d ) 298.6 nm.<br />
is investigated as a function <strong>of</strong> angle away from the<br />
normal, the exact nature <strong>of</strong> the crystal structure will<br />
be a more important issue. 26,27<br />
(73) Bruce, A. D.; Wilding, N. B.; Ackland, G. J. Phys. Rev. Lett.<br />
1997, 79, 3002.<br />
Figure 7. SEM cross-sectional images <strong>of</strong> two samples with<br />
different particle diameters, grown from solutions with the<br />
same volume fraction (0.5%). The 206.4 nm particle size<br />
produced a film with 14 layers (A), and a 396.6 nm particle<br />
size produced a film with 7 layers (B).<br />
Domain Size <strong>of</strong> Planar Arrays. An important<br />
feature <strong>of</strong> these samples is their long-range order within<br />
the plane parallel to the substrate. In gravity-sedimented<br />
colloidal crystals, there can be some preferential<br />
alignment <strong>of</strong> the crystal axes with the capillary sidewalls;<br />
however, such samples are multicolored under<br />
white light illumination 74 and are thought to contain<br />
colloidal crystal domains whose (111) axes are not<br />
aligned. In contrast, the multilayer samples described<br />
here are deposited onto a flat substrate which forces<br />
their (111) axes to be aligned over distances <strong>of</strong> millimeters<br />
(Figure 2). For this reason, when viewed at a<br />
variety <strong>of</strong> angles, the color <strong>of</strong> the entire film is uniform<br />
(Figure 3). Thus, unlike the gravity-sedimented colloidal<br />
crystals which are polycrystalline in most instances, 46,47<br />
these samples consist <strong>of</strong> a single crystalline close-packed<br />
array. 75 We note that in this work when samples with<br />
slightly broader size distributions (>8%) are deposited,<br />
grain boundaries in the plane parallel to the substrate<br />
are observed; similarly, Nagayama et al. observed grain<br />
boundaries in monolayers <strong>of</strong> colloids with 10-15%<br />
distributions in size. 57 This suggests that the monodispersity<br />
<strong>of</strong> the colloids, rather than the deposition process<br />
itself, is responsible for their long-range ordering.<br />
Perfection <strong>of</strong> <strong>Colloidal</strong> <strong>Crystal</strong>s. Though these<br />
samples are single crystals, they are not perfect crystals<br />
(74) Gast, A. P.; Russel, W. B. Phys. Today 1998, 51 (12), 24.<br />
(75) Parker, S. P. Dictionary <strong>of</strong> Scientific and Technical Terms, 4th<br />
ed.; McGraw-Hill Book Company: New York, 1989.
2138 Chem. Mater., Vol. 11, No. 8, 1999 Jiang et al.<br />
Figure 8. SEM cross-sectional images <strong>of</strong> two samples grown<br />
from solutions with different particle volume fractions. In both<br />
parts A and B, the spheres are 298.6 nm in diameter. (A)<br />
V.F. ) 0.8%, 18 layers; (B) V.F. ) 3.0%, ∼50 layers.<br />
Figure 9. Typical SEM image <strong>of</strong> a sample (d ) 279.2 nm)<br />
deposited with four successive coatings. Each deposition<br />
provides 12 colloidal monolayers.<br />
as is clear from the SEM photographs. Two types <strong>of</strong><br />
defects are observed routinely in the SEM images <strong>of</strong><br />
these samples. The first is sphere vacancies that appear<br />
every ∼10 µm on average. The second is vertical cracks<br />
in the crystal, perpendicular to the glass substrate.<br />
Examples may be seen in Figures 7A and 8A. Cracks<br />
are typically observed every 10 µm in most samples and<br />
unlike a classic grain boundary, the registry <strong>of</strong> the<br />
hexagonal packing is preserved across these features.<br />
One explanation for the cracking is that the deposition<br />
<strong>of</strong> metal and the subsequent exposure <strong>of</strong> films to the<br />
Figure 10. Normal incidence transmission spectra (optical<br />
density) <strong>of</strong> samples with different sphere diameters, determined<br />
using SEM analysis. These curves have been scaled to<br />
a constant height, and vertically <strong>of</strong>fset for clarity. The arrows<br />
indicate the expected positions <strong>of</strong> the peaks for each curve,<br />
calculated using Bragg’s law at normal incidence and the<br />
diameters shown. Typically at the peak maximum only 10-<br />
20% <strong>of</strong> the incident light is transmitted.<br />
Figure 11. Normal incidence transmission spectra (optical<br />
density) <strong>of</strong> three samples (d ) 279.2 nm) with increasing film<br />
thickness. These curves have been scaled to a constant height,<br />
and vertically <strong>of</strong>fset for clarity. Thicker samples exhibit more<br />
closely spaced (and smaller) Fabry-Perot fringes. The arrows<br />
indicate local maxima, λp, chosen for thickness analysis, with<br />
the longest wavelength as p ) 0 (see supplemental Figures 1<br />
and 2). In addition, a rising background apparent in the data<br />
<strong>of</strong> Figure 10 has been subtracted from these data; for samples<br />
<strong>of</strong> more than 20 layers, this background contributes at most<br />
20% <strong>of</strong> the rejection <strong>of</strong> light at the peak maximum.<br />
high vacuum <strong>of</strong> the SEM damages their structure and<br />
induces cracking; to evaluate this issue, atomic force<br />
microscopy (AFM) <strong>of</strong> the same materials was performed<br />
under ambient conditions on the as-prepared surfaces.<br />
Though cracks were still observed, they were fewer in<br />
number and typically found every 100 µm. The drying<br />
tension in thin colloidal films is well-known to cause
<strong>Single</strong>-<strong>Crystal</strong> <strong>Colloidal</strong> <strong>Multilayers</strong> Chem. Mater., Vol. 11, No. 8, 1999 2139<br />
cracking <strong>of</strong> much thinner deposits; 76 it is likely that such<br />
drying-induced shrinkage is responsible for this problem<br />
as well. Strategies for minimizing this effect include the<br />
addition <strong>of</strong> surfactants, and better control over the<br />
drying conditions.<br />
Controlling Film <strong>Thickness</strong>. One <strong>of</strong> the great<br />
advantages <strong>of</strong> this method <strong>of</strong> colloidal crystal formation<br />
is its ability to create samples with precisely controlled<br />
thickness. By controlling such parameters as colloidal<br />
concentration and sphere size, it is possible to vary the<br />
thickness <strong>of</strong> the films from a few layers to hundreds <strong>of</strong><br />
layers. The representative images in Figures 7 and 8<br />
suggest that film thickness, T, is related to the deposition<br />
parameters in a systematic way. Figure 6 illustrates<br />
the quantitative relationships between the<br />
number <strong>of</strong> colloidal layers, k, and the deposition parameters<br />
(volume fraction <strong>of</strong> colloids in solution) and<br />
d (colloid diameter).<br />
These trends can be understood using a model developed<br />
by Nagayama et al. 56-65 for the self-assembly <strong>of</strong><br />
monolayer colloidal films. In his experiments, which are<br />
reminiscent <strong>of</strong> Langmuir-Blodgett methods for selfassembly,<br />
a vertical or slanted substrate is withdrawn<br />
from a solution <strong>of</strong> polystyrene colloids at a constant rate.<br />
A meniscus region is formed on the substrate due to<br />
wetting by the solution; evaporation <strong>of</strong> the solvent out<br />
<strong>of</strong> this thin meniscus leads to a constant solution influx,<br />
which draws colloids into the area <strong>of</strong> film formation.<br />
During the solvent evaporation these colloids experience<br />
interparticle capillary forces which organize them into<br />
close-packed arrays. The resulting thickness is then<br />
entirely dependent on the flux <strong>of</strong> particles into the<br />
meniscus, and mass balance can be used to derive a<br />
simple formula for array thickness.<br />
The film formation conditions used by Nagayama et<br />
al. were optimized for the production <strong>of</strong> uniform colloidal<br />
monolayers; however, it is possible to adapt this formalism<br />
to the formation <strong>of</strong> multilayer films. To create thick<br />
films, the array growth rate, which is a balance <strong>of</strong> the<br />
solvent evaporation and substrate withdrawal rates,<br />
must be as small as possible. Thus, the slowest possible<br />
array growth results when the substrate is not mechanically<br />
withdrawn. Under this circumstance the<br />
array growth rate and the solvent evaporation rate are<br />
equal. This leads to a prediction that the final multilayer<br />
thickness depends on the deposition parameters according<br />
to 77<br />
k )<br />
L<br />
0.605d(1 - )<br />
(1)<br />
where k is the number <strong>of</strong> layers, L is the meniscus<br />
height, is the ratio between the velocity <strong>of</strong> a particle<br />
in solution and the fluid velocity and is taken to be 1, d<br />
is the particle diameter, and is the particle volume<br />
fraction in solution. The data shown in Figure 6 clearly<br />
demonstrate that the basic trends predicted by this<br />
equation are valid. A surprising result from the model<br />
is that the final array thickness is not dependent on the<br />
(76) Bergna, H. E. The Colloid Chemistry <strong>of</strong> Silica; Bergna, H. E.,<br />
Ed.; American Chemical Society: Washington, DC, 1994; Vol. 234, p<br />
376.<br />
(77) This equation was derived from eq 7 from Nagayama et al. 57<br />
by allowing the evaporation rate, je, to be equal to the array growth<br />
rate, vc.<br />
solvent evaporation rate. This is because, while faster<br />
solvent evaporation does lead to faster array formation,<br />
it also leads to increased solution influx into the array<br />
growth region. This increased influx <strong>of</strong> silica colloids<br />
balances the faster growth rate, leading to a film<br />
thickness independent <strong>of</strong> evaporation rate. This prediction<br />
was verified experimentally by creating multilayer<br />
samples under different evaporation conditions. While<br />
film uniformity was somewhat dependent on evaporation<br />
rate, film thickness was not. In addition, film<br />
thickness was insensitive to the surface derivatization<br />
<strong>of</strong> the colloids.<br />
An important issue in this method is the role that the<br />
solvent plays in controlling the deposition <strong>of</strong> colloidal<br />
multilayers. The solvent enters into the model through<br />
the parameter L that is defined as the height <strong>of</strong> the<br />
meniscus over which evaporation occurs. In the case <strong>of</strong><br />
the ethanolic solutions used in this work, this parameter<br />
can be extracted from linear fits to the data shown in<br />
Figure 6. Assuming a <strong>of</strong> 1, the data in Figure 6A<br />
provides an L value <strong>of</strong> 316 µm while the data in Figure<br />
6B gives an L value <strong>of</strong> 301 µm. Similar evaporation<br />
lengths, on the order <strong>of</strong> 200 µm, were reported for the<br />
growth <strong>of</strong> polystyrene colloidal monolayers from water. 63<br />
While this parameter cannot be exactly computed, an<br />
upper limit for its value can be found by considering<br />
the meniscus height <strong>of</strong> ethanol on a flat glass surface.<br />
Using the surface tension <strong>of</strong> ethanol and its contact<br />
angle for wetting glass, it is possible to calculate a<br />
meniscus height <strong>of</strong> 3500 µm. 78 As expected, the observed<br />
meniscus height <strong>of</strong> ∼310 µm is smaller than the value<br />
for a flat substrate as the film must wet a rough surface<br />
<strong>of</strong> colloids. This analysis suggests that solvents such as<br />
water, which have large surface tensions and even lower<br />
contact angles, should deposit thicker films than the<br />
corresponding ethanolic solutions. Attempts to deposit<br />
silica colloids from aqueous solutions did lead to thicker<br />
films, but these samples had poor uniformity.<br />
Measuring Multilayer <strong>Thickness</strong> Using Optical<br />
Techniques. Multilayer thickness is an important<br />
parameter for quantitative assessment <strong>of</strong> sample optical<br />
properties. While scanning electron microscopy (SEM)<br />
provides a measure <strong>of</strong> this parameter, it is a destructive<br />
method as it requires the deposition <strong>of</strong> a thin gold<br />
coating on the sample. A less time-consuming and<br />
nondestructive method is an optical technique which<br />
uses the Fabry-Perot (FP) fringe 79 positions to analyze<br />
for film thickness. These fringes result from interference<br />
between reflections from the top and bottom surfaces<br />
<strong>of</strong> the sample and are indicated by the arrows in Figure<br />
11. An analysis, using Bragg’s law, <strong>of</strong> the spectral<br />
positions <strong>of</strong> these local maxima permits an accurate<br />
determination <strong>of</strong> sample thickness (Supporting Figure<br />
1). The thickness determined from this optical technique<br />
is in excellent agreement with thickness found from<br />
cross-sectional SEM (Supporting Figure 2).<br />
<strong>Thickness</strong> Uniformity in Multilayer Samples. An<br />
important feature <strong>of</strong> this deposition method is that it<br />
allows for the systematic control over multilayer thickness<br />
(Figure 6). Indeed, the preparation <strong>of</strong> such well-<br />
(78) Hiemenz, P. C. Principles <strong>of</strong> Colloid and Surface Chemistry;<br />
Marcel Dekker: New York, 1984; p 278.<br />
(79) Hecht, E. Optics, 2nd ed.; Addison-Wesley Publishing Company:<br />
Reading, MA, 1987.
2140 Chem. Mater., Vol. 11, No. 8, 1999 Jiang et al.<br />
controlled materials now makes it possible to evaluate<br />
many thickness-dependent properties <strong>of</strong> these systems.<br />
For this work to proceed, however, it is important to<br />
assess the uniformity <strong>of</strong> the film thickness over the<br />
entire area <strong>of</strong> the sample. One way to characterize the<br />
thickness distribution is to rely on the statistical<br />
analysis <strong>of</strong> cross-sectional SEM images. Films are<br />
typically abraded along a diagonal, and it is possible to<br />
collect cross-sectional data at many points over the<br />
entire central region (∼5 mm) <strong>of</strong> the sample. The<br />
standard deviation found for thickness in these measurements<br />
is on the order <strong>of</strong> 10%. A complementary<br />
method for analyzing film thickness uniformity is to rely<br />
on the optical techniques to assess film thickness<br />
(Supporting Figures 1 and 2). Simulations <strong>of</strong> the interference<br />
effect indicate that if the thickness <strong>of</strong> the sample<br />
in the optical path varies by more than (10%, then welldefined<br />
maxima and minima will not be observed. Thus,<br />
the observation <strong>of</strong> well-defined fringes (Figure 11)<br />
demonstrates that film thickness deviates less than 10%<br />
on average.<br />
The Optical Properties <strong>of</strong> <strong>Colloidal</strong> <strong>Crystal</strong> <strong>Multilayers</strong>.<br />
The basic features <strong>of</strong> the normal incidence<br />
optical spectrum <strong>of</strong> these colloidal crystal multilayers<br />
are in good agreement with those observed for gravitysedimented<br />
samples. Figure 10 shows how the peak in<br />
the optical spectum depends on sphere diameter. When<br />
the wavelength <strong>of</strong> incident light satisfies the Bragg<br />
condition, it is diffracted away from the propagation<br />
axis, leading to a decrease in the transmission and thus<br />
a peak in the absorption spectrum. The position <strong>of</strong> this<br />
peak can be related to the sphere diameter and the<br />
effective refractive index <strong>of</strong> the medium using λmax )<br />
2neffd111, where d111 is the interlayer spacing. 80 The<br />
arrows that are shown in Figure 10 are peak positions<br />
predicted from this equation using sphere sizes as<br />
determined from SEM; agreement with experimental<br />
data is quite good.<br />
While this simple diffraction theory can predict the<br />
peak positions, it is unable to provide a quantitative<br />
explanation for any <strong>of</strong> the other features in the spectra.<br />
Recently, several groups have attempted to adapt the<br />
dynamical theory <strong>of</strong> X-ray diffraction to this<br />
purpose. 42,43,45,81-83 However, this theory is based on the<br />
approximation that the refractive index contrast between<br />
the scattering centers and the interstitial medium<br />
is quite small, on the order <strong>of</strong> 10 -4 , an approximation<br />
not valid for these silica-air crystals. For this reason,<br />
a detailed analysis <strong>of</strong> the shapes and intensities <strong>of</strong> the<br />
optical transmission function must rely on more com-<br />
(80) For close-packed spheres, the interlayer spacing is related to<br />
the sphere diameter, D, by d111 ) (2/3) 1/2 D.<br />
(81) Monovoukas, Y.; Fuller, G. G.; Gast, A. P. J. Chem. Phys. 1990,<br />
93, 8294.<br />
(82) Rundquist, P. A.; Photinos, P.; Jagannathan, S.; Asher, S. A.<br />
J. Chem. Phys. 1989, 91, 4932.<br />
(83) Sunkara, H. B.; Jethmalani, J. M.; Ford, W. T. Hybrid<br />
Organic-Inorganic Composites; Mark, J. E., Lee, C. Y.-C., Bianconi,<br />
P. A., Ed.; American Chemical Society: Washington, DC, 1995; Vol.<br />
585, p 181.<br />
plete treatments <strong>of</strong> scattering from periodic dielectrics.<br />
Theories <strong>of</strong> the optical properties <strong>of</strong> photonic band gap<br />
materials provide an avenue for this understanding; this<br />
issue has been explored more fully elsewhere. 84<br />
An important feature <strong>of</strong> these spectra is the rising<br />
background that grows at shorter wavelengths; this<br />
causes the samples to look slightly hazy and could place<br />
limits on their use in many optical applications. This<br />
background has been observed, but rarely discussed, in<br />
gravity-sedimented crystals as well, and its origins<br />
remain obscure. While it does not clearly fit the λ -4<br />
dependence expected for Rayleigh scattering, defects or<br />
sphere surface roughness could give rise to this phenomenon.<br />
Alternatively, it may represent the collective<br />
effect <strong>of</strong> diffraction <strong>of</strong>f <strong>of</strong> all <strong>of</strong> the lattice planes other<br />
than the (111) planes. 85 If so, it is an intrinsic property<br />
<strong>of</strong> any periodic array <strong>of</strong> spheres, not merely <strong>of</strong> selfassembled<br />
colloidal crystals.<br />
An interesting feature <strong>of</strong> the optical spectra is the<br />
increase in peak width as sample thickness is decreased<br />
(Figure 11). This effect is similar to the Debye-Scherrer<br />
broadening <strong>of</strong> X-ray diffraction peaks in small crystallites;<br />
86 however, the widths reach a limiting value <strong>of</strong><br />
only ∼40 nm in thick samples. A full treatment <strong>of</strong> the<br />
thickness-dependent optical effects <strong>of</strong> these samples is<br />
the subject <strong>of</strong> a forthcoming publication. 87<br />
Conclusion<br />
Using a simple method, it is possible to deposit planar<br />
single crystals <strong>of</strong> nanosphere arrays on a wide variety<br />
<strong>of</strong> substrates. Scanning electron microscopy (SEM) <strong>of</strong><br />
the samples shows a close-packed structure and singlecrystal<br />
quality throughout the film. The number <strong>of</strong><br />
nanospheres deposited can be widely varied with this<br />
method; film thicknesses ranging from single monolayers<br />
to 100 layers are easily created through control over<br />
the particle volume fraction and sphere size. The planar<br />
format and uniformity <strong>of</strong> these materials make them<br />
ideally suited for optical characterization. The qualitative<br />
features <strong>of</strong> their spectra are in good agreement with<br />
simple models <strong>of</strong> diffraction.<br />
Acknowledgment. The authors would like to acknowledge<br />
funding from the NSF (CHE-9702520) and<br />
the Welch Foundation (C-1342). V.L.C. would like to<br />
thank D. M. Mittleman for many useful discussions<br />
concerning the optical properties <strong>of</strong> these materials.<br />
Supporting Information Available: Figures showing an<br />
analysis, using Bragg’s law, <strong>of</strong> sample thickness (Supporting<br />
Figure 1) and correlation <strong>of</strong> SEM with Bragg’s Law thickness<br />
(Supporting Figure 2). This material is available free <strong>of</strong> charge<br />
via the Internet at http://pubs.acs.org.<br />
CM990080+<br />
(84) Mittleman, D. M.; Bertone, J. F.; Jiang, P.; Hwang, K. S.;<br />
Colvin, V. L. J. Chem. Phys. 1999, 111, 345.<br />
(85) Liu, L.; Li, P.; Asher, S. A. J. Am. Chem. Soc. 1997, 119, 2729.<br />
(86) Cullity, B. D. Elements <strong>of</strong> X-ray Diffraction, 2nd ed.; Addison-<br />
Wesley Publishing Company, Inc.: Reading, MA, 1978.<br />
(87) Bertone, J. F.; Jiang, P.; Hwang, K. S.; Mittleman, D. M.;<br />
Colvin, V. L. Phys. Rev. Lett., in press.