Single-Crystal Colloidal Multilayers of Controlled Thickness
Single-Crystal Colloidal Multilayers of Controlled Thickness
Single-Crystal Colloidal Multilayers of Controlled Thickness

Create successful ePaper yourself
Turn your PDF publications into a flip-book with our unique Google optimized e-Paper software.
<strong>Single</strong>-<strong>Crystal</strong> <strong>Colloidal</strong> <strong>Multilayers</strong> Chem. Mater., Vol. 11, No. 8, 1999 2135<br />
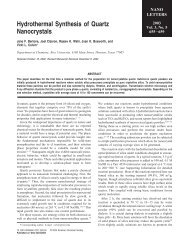
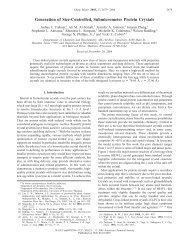
Figure 1. (A) Typical scanning electron micrograph (SEM)<br />
<strong>of</strong> a sample (top view) showing spheres <strong>of</strong> 298.6 nm diameter.<br />
The inset shows a Fourier transform <strong>of</strong> a 40 × 40 µm 2 region.<br />
(B) Typical SEM side view <strong>of</strong> the same sample at the same<br />
magnification (×12 000), showing a perspective view <strong>of</strong> the<br />
cleaved face and the underlying substrate.<br />
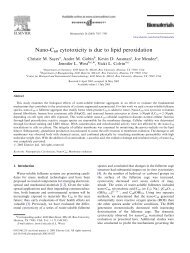
hexagonal registry <strong>of</strong> the images evident in their FFTs<br />
will not be aligned. Figure 2 shows such data for four<br />
representative images taken at the edges <strong>of</strong> a4mm<br />
square. The alignment <strong>of</strong> the spots in all four images<br />
illustrates the registry <strong>of</strong> the array lattice over these<br />
long length scales. Morevoer, analysis <strong>of</strong> many intermediate<br />
images also showed perfect alignment and no<br />
evidence <strong>of</strong> any grain boundaries.<br />
While order within the plane parallel to the glass<br />
substrate is important for the optical properties <strong>of</strong> the<br />
films, especially when they are evaluated away from<br />
normal incidence, the stacking <strong>of</strong> close-packed layers<br />
perpendicular to the substrate is responsible for the<br />
diffraction observed in normal-incidence transmission<br />
measurements. To evaluate this issue, colloid films can<br />
be abraded to reveal their stacking perpendicular to the<br />
substrate as shown in Figure 1B. This cross-section<br />
shows that the close-packed structure extends uniformly<br />
over the 15 layers shown; Figure 8B shows a thicker<br />
50 layer sample which also exhibits a regular arrangement<br />
from the top surface to the bottom surface. The<br />
visual appearance <strong>of</strong> the samples (see Figure 3) is a<br />
testament to this high crystalline quality and the<br />
uniform thickness <strong>of</strong> these films.<br />
To form high quality planar crystals, particle size<br />
distribution (S.D.) is a crucial factor. This is illustrated<br />
in Figure 5, which shows SEM images <strong>of</strong> two samples<br />
with different size distributions (3.8% and 14.2% relative<br />
standard deviations, respectively). The sample with<br />
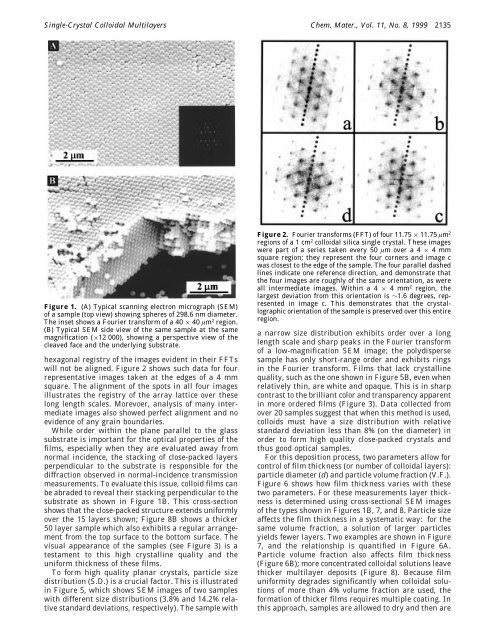
Figure 2. Fourier transforms (FFT) <strong>of</strong> four 11.75 × 11.75 µm 2<br />
regions <strong>of</strong> a1cm 2 colloidal silica single crystal. These images<br />
were part <strong>of</strong> a series taken every 50 µm overa4× 4mm<br />
square region; they represent the four corners and image c<br />
was closest to the edge <strong>of</strong> the sample. The four parallel dashed<br />
lines indicate one reference direction, and demonstrate that<br />
the four images are roughly <strong>of</strong> the same orientation, as were<br />
all intermediate images. Within a 4 × 4 mm 2 region, the<br />
largest deviation from this orientation is ∼1.6 degrees, represented<br />
in image c. This demonstrates that the crystallographic<br />
orientation <strong>of</strong> the sample is preserved over this entire<br />
region.<br />
a narrow size distribution exhibits order over a long<br />
length scale and sharp peaks in the Fourier transform<br />
<strong>of</strong> a low-magnification SEM image; the polydisperse<br />
sample has only short-range order and exhibits rings<br />
in the Fourier transform. Films that lack crystalline<br />
quality, such as the one shown in Figure 5B, even when<br />
relatively thin, are white and opaque. This is in sharp<br />
contrast to the brilliant color and transparency apparent<br />
in more ordered films (Figure 3). Data collected from<br />
over 20 samples suggest that when this method is used,<br />
colloids must have a size distribution with relative<br />
standard deviation less than 8% (on the diameter) in<br />
order to form high quality close-packed crystals and<br />
thus good optical samples.<br />
For this deposition process, two parameters allow for<br />
control <strong>of</strong> film thickness (or number <strong>of</strong> colloidal layers):<br />
particle diameter (d) and particle volume fraction (V.F.).<br />
Figure 6 shows how film thickness varies with these<br />
two parameters. For these measurements layer thickness<br />
is determined using cross-sectional SEM images<br />
<strong>of</strong> the types shown in Figures 1B, 7, and 8. Particle size<br />
affects the film thickness in a systematic way: for the<br />
same volume fraction, a solution <strong>of</strong> larger particles<br />
yields fewer layers. Two examples are shown in Figure<br />
7, and the relationship is quantified in Figure 6A.<br />
Particle volume fraction also affects film thickness<br />
(Figure 6B); more concentrated colloidal solutions leave<br />
thicker multilayer deposits (Figure 8). Because film<br />
uniformity degrades significantly when colloidal solutions<br />
<strong>of</strong> more than 4% volume fraction are used, the<br />
formation <strong>of</strong> thicker films requires multiple coating. In<br />
this approach, samples are allowed to dry and then are