Single-Crystal Colloidal Multilayers of Controlled Thickness
Single-Crystal Colloidal Multilayers of Controlled Thickness
Single-Crystal Colloidal Multilayers of Controlled Thickness

Create successful ePaper yourself
Turn your PDF publications into a flip-book with our unique Google optimized e-Paper software.
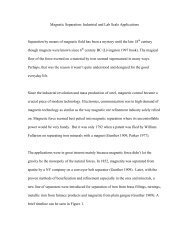
2132 Chem. Mater. 1999, 11, 2132-2140<br />
<strong>Single</strong>-<strong>Crystal</strong> <strong>Colloidal</strong> <strong>Multilayers</strong> <strong>of</strong> <strong>Controlled</strong><br />
<strong>Thickness</strong><br />
P. Jiang, J. F. Bertone, K. S. Hwang, and V. L. Colvin*<br />
Department <strong>of</strong> Chemistry and Center for Nanoscale Science and Technology, Rice University,<br />
MS-60, 6100 Main Street, Houston, Texas 77005<br />
Received February 5, 1999. Revised Manuscript Received April 19, 1999<br />
Materials whose dielectric constant varies spatially with submicrometer periodicity exhibit<br />
diffractive optical properties which are potentially valuable in a number <strong>of</strong> existing and<br />
emerging applications. Here, such systems are fabricated by exploiting the spontaneous<br />
crystallization <strong>of</strong> monodisperse silica spheres into close-packed arrays. By reliance on a<br />
vertical deposition technique to pack the spherical colloids into close-packed silica-air arrays,<br />
high quality samples can be prepared with thicknesses up to 50 µm. These samples are<br />
planar and thus suitable for optical characterization. Scanning electron microscopy (SEM)<br />
<strong>of</strong> these materials illustrates the close-packed ordering <strong>of</strong> the spherical colloids in planes<br />
parallel to the substrate; cross-sectional SEM micrographs <strong>of</strong> the arrays as well as optical<br />
methods are used to measure sample thickness and uniformity. Normal-incidence transmission<br />
spectra in the visible and near-infrared regions show distinct peaks due to diffraction<br />
from the colloidal layers. While these basic optical characteristics are similar to thicker and<br />
polycrystalline gravity-sedimented colloidal crystals, the systematic control over the number<br />
<strong>of</strong> colloidal layers allows the effect <strong>of</strong> sample thickness on the optical spectrum to be studied<br />
for the first time.<br />
Introduction<br />
Many novel properties can be engineered in periodic<br />
dielectric materials by controlling the symmetry and<br />
length scale <strong>of</strong> a sample’s microstructure. 1-6 This idea<br />
has been used to engineer microwave optics, 4 and<br />
recently these dielectric structures have been termed<br />
“photonic band gap” materials. The exciting potential<br />
<strong>of</strong> these structured materials for optical applications has<br />
motivated efforts to shrink the length scale <strong>of</strong> the<br />
periodicity to submicrometer sizes. 7-16 Lithographically<br />
* To whom correspondence should be addressed. E-mail: colvin@<br />
rice.edu.<br />
(1) Petrov, E. P.; Bogomolov, V. N.; Kalosha, I. I.; Gaponenko, S.<br />
V. Phys. Rev. Lett. 1998, 81, 77.<br />
(2) Lin, S. Y.; Fleming, J. G.; Hetherington, D. L.; Smith, B. K.;<br />
Biswas, R.; Ho, K. M.; Sigalas, M. M.; Zubrzycki, W.; Kurtz, S. R.; Bur,<br />
J. Nature 1998, 394, 251.<br />
(3) Gupta, S.; Tuttle, G.; Sigalas, M.; Ho, K. M. Appl. Phys. Lett.<br />
1997, 71, 2412.<br />
(4) Lin, S. Y.; Chow, E.; Hietala, V.; Villeneuve, P. R.; Joannopoulos,<br />
J. D. Science 1998, 282, 274.<br />
(5) Holtz, J. H.; Asher, S. A. Nature 1997, 389, 829.<br />
(6) Lin, V. S. Y.; Motesharei, K.; Dancil, K. P. S.; Sailor, M. J.;<br />
Ghadiri, M. R. Science 1997, 278, 840.<br />
(7) Velev, O. D.; Jede, T. A.; Lobo, R. F.; Lenh<strong>of</strong>f, A. M. Nature 1997,<br />
389, 447.<br />
(8) Zakhidov, A. A.; Baughman, R. H.; Iqbal, Z.; Cui, C.; Khayrullin,<br />
I.; Dantas, S. O.; Marti, J.; Ralchenko, V. G. Science 1998, 282, 897.<br />
(9) Holland, B. T.; Blanford, C. F.; Stein, A. Science 1998, 281, 538.<br />
(10) Davis, S. A.; Burkett, S. L.; Mendelson, N. H.; Mann, S. Nature<br />
1997, 385, 420.<br />
(11) Imh<strong>of</strong>, A.; Pine, D. J. Nature 1997, 389, 948.<br />
(12) Yablonovitch, E. J. Opt. Soc. Am. B 1993, 10, 283.<br />
(13) Wijnhoven, J. E. G.; Vos, W. L. Science 1998, 281, 802.<br />
(14) Pan, G.; Kesavamoorthy, R.; Asher, S. A. J. Am. Chem. Soc.<br />
1998, 120, 6525.<br />
(15) Joannopoulos, J. D.; Meade, R. D.; Winn, J. N. Photonic<br />
<strong>Crystal</strong>s: Molding the Flow <strong>of</strong> Light; Princeton University Press:<br />
Princeton, NJ, 1995.<br />
prepared arrays <strong>of</strong> alumina rods, for example, were<br />
recently used as a planar waveguide device operating<br />
in the gigahertz region; 4 alternating layers <strong>of</strong> AlGaAs<br />
and AlAs deposited through chemical vapor provide a<br />
stacked dielectric cavity used in distributed feedback<br />
lasers. 17 While these methods for creating dielectric<br />
structures have found use in commercial products, the<br />
potential applications <strong>of</strong> photonic band gap materials<br />
at optical wavelengths have been limited by the difficulty<br />
in fabricating three-dimensionally periodic materials<br />
with nanometer-scale structures.<br />
Recently, colloidal crystals have received renewed<br />
attention as an avenue to achieving controlled dielectric<br />
periodicity. 18-21 <strong>Colloidal</strong> crystals are regular crystalline<br />
arrays <strong>of</strong> highly monodisperse spheres <strong>of</strong> dielectric<br />
materials such as silica or polymers. 22 These materials<br />
have been the subject <strong>of</strong> study for several decades due<br />
to their unusual optical 23-28 and thermodynamic<br />
(16) Joannopoulos, J. D.; Villeneuve, P. R.; Fan, S. Nature 1997,<br />
386, 143.<br />
(17) Tanaka, K.; Nakamura, T.; Takamatsu, W.; Yamanishi, M.;<br />
Lee, Y.; Ishihara, T. Phys. Rev. Lett. 1995, 74, 3380.<br />
(18) Asher, S. A.; Holtz, J.; Weissman, J.; Pan, G. MRS Bull. 1998,<br />
October, 44.<br />
(19) Miguez, H.; Meseguer, F.; Lopez, C.; Blanco, A.; Moya, J. S.;<br />
Requena, J.; Mifsud, A.; Fornes, V. Adv. Mater. 1998, 10, 480.<br />
(20) Bogomolov, V. N.; Prok<strong>of</strong>′ev, A. V.; Shelykh, A. I. Phys. Solid<br />
State 1998, 40, 594.<br />
(21) Lidorikis, E.; Li., Q.; Soukoulis, C. M. Phys. Rev. E 1997, 55,<br />
3613.<br />
(22) Pieranski, P. Contemp. Phys. 1983, 24, 25.<br />
(23) Yoshiyama, T.; Sogami, I. Phys. Rev. Lett. 1984, 53, 2153.<br />
(24) Sanders, J. V. Acta <strong>Crystal</strong>logr. 1968, A24, 427.<br />
(25) Goodwin, J. W.; Ottewil, R. H.; Parentich, A. J. Phys. Chem.<br />
1980, 84, 1580.<br />
(26) Krieger, I. M.; O’Neill, F. M. J. Am. Chem. Soc. 1968, 90, 613.<br />
(27) Hiltner, P. A.; Krieger, I. M. J. Phys. Chem. 1969, 73, 2386.<br />
(28) Monovoukas, Y.; Gast, A. P. Langmuir 1991, 7, 460.<br />
10.1021/cm990080+ CCC: $18.00 © 1999 American Chemical Society<br />
Published on Web 07/15/1999
<strong>Single</strong>-<strong>Crystal</strong> <strong>Colloidal</strong> <strong>Multilayers</strong> Chem. Mater., Vol. 11, No. 8, 1999 2133<br />
properties. 29-35 <strong>Colloidal</strong> crystals <strong>of</strong>fer a starting point<br />
for the fabrication <strong>of</strong> periodic dielectric materials created<br />
through self-assembly rather than lithographic means.<br />
Here, one has the potential to create samples with full<br />
three-dimensional ordering, a feature important for<br />
engineering larger and more complete photonic band<br />
gaps. Also, self-assembly methods can create thicker<br />
materials than those made using lithography. While the<br />
role <strong>of</strong> sample thickness in the optical properties <strong>of</strong><br />
colloidal crystals has not been investigated, it is clear<br />
that control over this important parameter would be<br />
quite valuable in materials engineering. In addition,<br />
self-assembly methods are not limited in their length<br />
scale, and it is feasible to create materials that are<br />
active in the ultraviolet and even the s<strong>of</strong>t X-ray range<br />
using colloids with smaller diameters. Finally, as has<br />
been demonstrated recently, colloidal crystals provide<br />
an ideal scaffold for the creation <strong>of</strong> both polymeric<br />
and inorganic samples with complex porous<br />
structures. 7-9,13,36-40 Such samples may exhibit more<br />
complete photonic band gaps than silica-air crystals as<br />
higher index contrasts are possible; in addition, they<br />
also may find applications in catalysis and separation<br />
technologies. The success <strong>of</strong> these nonlithographic routes<br />
to the formation <strong>of</strong> periodic dielectric structures requires<br />
the development <strong>of</strong> robust methods for creating high<br />
quality, uniform, and mechanically stable colloidal<br />
crystals.<br />
A popular method for creating colloidal crystals is the<br />
gravity sedimentation <strong>of</strong> colloids from dispersions; 19,22,32,41<br />
recent progress in the area has focused on strategies<br />
for strengthening the crystals and generating sample<br />
formats well suited for optical testing. In one instance,<br />
silica colloids were crystallized between parallel plates,<br />
and the solvent was then polymerized so as to trap their<br />
crystalline order. 42-44 This stabilization comes at a cost,<br />
however, as the matrix material has a refractive index<br />
closely matched to that <strong>of</strong> the colloids, thus reducing<br />
their diffractive properties. In other work, silica colloids<br />
were crystallized in capillaries, and the solvent was<br />
allowed to evaporate. The resulting silica-air structures<br />
have strong diffractive properties, and transmission<br />
(29) Hartl, W.; Klemp, R.; Versmold, H. Phase Transitions 1990,<br />
21, 229.<br />
(30) Smits, C.; van Duijneveldt, J. S.; Dhont, J. K.; Lekkerkerker,<br />
H. N. W. Phase Transitions 1990, 21, 157.<br />
(31) Aastuen, D. J. W.; Clark, N. A.; Swindal, J. C.; Muzny, C. D.<br />
Phase Transitions 1990, 21, 139.<br />
(32) Davis, K. E.; Russel, W. B.; Glantschnig, W. J. J. Chem. Soc.,<br />
Faraday Trans. 1991, 87, 411.<br />
(33) Imh<strong>of</strong>, A.; van Blaaderen, A.; Maret, G.; Mellema, J.; Dhont,<br />
J. K. G. J. Chem. Phys. 1994, 100, 2170.<br />
(34) Kesavamoorthy, R.; Super, M. S.; Asher, S. A. J. Appl. Phys.<br />
1992, 71, 1116.<br />
(35) Rundquist, P. A.; Jagannathan, S.; Kesavamoorthy, R.; Brnardic,<br />
C.; Xu, S.; Asher, S. A. J. Chem. Phys. 1991, 94, 711.<br />
(36) Velev, O. D.; Jede, T. A.; Lobo, R. F.; Lenh<strong>of</strong>f, A. M. Chem.<br />
Mater. 1998, 10, 3597.<br />
(37) Park, S. H.; Xia, Y. Adv. Mater. 1998, 10, 1045.<br />
(38) Park, S. H.; Xia, Y. Chem. Mater. 1998, 10, 1745.<br />
(39) Jiang, P.; Hwang, K. S.; Mittleman, D. M.; Bertone, J. F.;<br />
Colvin, V. L. J. Am. Chem. Soc., submitted for publication.<br />
(40) Johnson, S. A.; Ollivier, P. J.; Mallouk, T. E. Science 1999, 283,<br />
963.<br />
(41) Mayoral, R.; Requena, J.; Moya, J. S.; Lopez, C.; Cintas, A.;<br />
Miguez, H.; Meseguer, F.; Vazquez, L.; Holgado, M.; Blanco, A. Adv.<br />
Mater. 1997, 9, 257.<br />
(42) Jethmalani, J. M.; Ford, W. T. Chem. Mater. 1996, 8, 2138.<br />
(43) Jethmalani, J. M.; Sunkara, H. B.; Ford, W. T.; Willoughby,<br />
S. L.; Ackerson, B. J. Langmuir 1997, 13, 2633.<br />
(44) Jethmalani, J. M.; Ford, W. T.; Beaucage, G. Langmuir 1997,<br />
13, 3338.<br />
spectra can be collected over some regions. 45 Nonetheless,<br />
gravity-sedimented samples generally contain<br />
polycrystalline domains <strong>of</strong> unknown sizes. 46,47 In addition,<br />
during the gravity sedimentation method, crystal<br />
formation can only occur at specific volume fractions <strong>of</strong><br />
colloids. 22 As a result, array growth is difficult to adjust,<br />
and thus film thickness is not easily controlled.<br />
Other methods for ordering colloids into arrays have<br />
been explored by investigators seeking to make dense<br />
monolayer films <strong>of</strong> close-packed colloids for nonoptical<br />
applications. Under the right conditions, colloid solutions<br />
that are spun-coated onto surfaces provide high<br />
quality monolayers. 48-52 Convective self-assembly <strong>of</strong><br />
wetting solutions is also a route for making ordered<br />
monolayers and structures <strong>of</strong> nanocrystals on a variety<br />
<strong>of</strong> substrates. 53 Another method applied to polymer<br />
colloids uses the flow <strong>of</strong> solvent through micromachined<br />
channels to create dense colloidal arrays <strong>of</strong> multiple<br />
layers. 37,38,54,55 Finally, recent work by Nagayama et<br />
al. 56-65 has exploited capillary forces to drive the assembly<br />
<strong>of</strong> larger (d > 1 µm) polystyrene colloids on flat<br />
surfaces. This method, which is conceptually similar to<br />
the Langmuir-Blodgett methods for film deposition,<br />
creates ordered monolayer films on nearly any vertical<br />
surface. Under the appropriate solvent and colloid<br />
conditions Nagayama et al. showed that patches <strong>of</strong> biand<br />
trilayer arrays could also be formed. All <strong>of</strong> these<br />
methods have the advantage <strong>of</strong> producing well-ordered<br />
films on planar surfaces quite rapidly; however, in most<br />
instances the deposition techniques have been optimized<br />
for the formation <strong>of</strong> monolayer films.<br />
In this paper a self-assembly technique which relies<br />
on capillary forces to organize colloids is used to<br />
fabricate colloidal crystal multilayers. These arrays are<br />
ordered over long (∼1 cm) length scales and can be<br />
fabricated with thicknesses ranging from two layers to<br />
several hundred layers. Moreover, the thickness <strong>of</strong> the<br />
resulting sample can be precisely dictated through<br />
(45) Vos, W. L.; Sprik, R.; van Blaaderen, A.; Imh<strong>of</strong>, A.; Lagendijk,<br />
A.; Wegdam, G. H. Phys. Rev. B 1996, 53, 16231.<br />
(46) Clark, N. A.; Hurd, A. J.; Ackerson, B. J. Nature 1979, 281,<br />
57.<br />
(47) Okubo, T. Langmuir 1994, 10, 1695.<br />
(48) Deckman, H. W.; Dunsmuir, J. H. Appl. Phys. Lett. 1982, 41,<br />
377.<br />
(49) Winzer, M.; Kleiber, M.; Dix, N.; Wiesendanger, R. Appl. Phys.<br />
A 1996, 63, 617.<br />
(50) Burmeister, F.; Schafle, C.; Keilh<strong>of</strong>er, B.; Bechinger, C.;<br />
Boneberg, J.; Leiderer, P. Adv. Mater. 1998, 10, 495.<br />
(51) Deckman, H. W.; Dunsmuir, J. H. J. Vac. Sci. Technol. B 1983,<br />
1, 1109.<br />
(52) Hulteen, J. C.; Van Duyne, R. P. J. Vac. Sci. Technol. 1995,<br />
13, 1553.<br />
(53) O’hara, P. C.; Leff, D. V.; Heath, J. R.; Gelbart, W. M. Phys.<br />
Rev. Lett. 1995, 75, 3466.<br />
(54) Park, S. H.; Qin, D.; Xia, Y. Adv. Mater. 1998, 10, 1028.<br />
(55) Park, S. H.; Xia, Y. Langmuir 1999, 15, 266.<br />
(56) Denkov, N. D.; Velev, O. D.; Kralchevsky, P. A.; Ivanov, I. B.;<br />
Yoshimura, H.; Nagayama, K. Nature 1993, 361, 26.<br />
(57) Dimitrov, A. S.; Nagayama, K. Langmuir 1996, 12, 1303.<br />
(58) Nagayama, K. Phase Transitions 1993, 45, 185.<br />
(59) Dimitrov, A. S.; Dushkin, C. D.; Yoshimura, H.; Nagayama,<br />
K. Langmuir 1994, 10, 432.<br />
(60) Dushkin, C. D.; Nagayama, K.; Miwa, T.; Kralchevsky, P. A.<br />
Langmuir 1993, 9, 3695.<br />
(61) Adachi, E.; Dimitrov, A. S.; Nagayama, K. Langmuir 1995, 11,<br />
1057.<br />
(62) Nagayama, K. Colloids Surf. A 1996, 109, 363.<br />
(63) Dimitrov, A. S.; Nagayama, K. Chem. Phys. Lett. 1995, 243,<br />
462.<br />
(64) Denkov, N. D.; Velev, O. D.; Kralchevsky, P. A.; Ivanov, I. B.;<br />
Yoshimura, H.; Nagayama, K. Langmuir 1992, 8, 3183.<br />
(65) Yamaki, M.; Higo, J.; Nagayama, K. Langmuir 1995, 11, 2975.
2134 Chem. Mater., Vol. 11, No. 8, 1999 Jiang et al.<br />
control <strong>of</strong> sphere size and concentration in solution. This<br />
deposition behavior can be adequately simulated using<br />
existing models <strong>of</strong> film formation developed for monolayer<br />
samples. The resulting planar colloidal crystals<br />
are highly ordered, and evaporation <strong>of</strong> the solvent leaves<br />
a silica-air array with good optical contrast and mechanical<br />
stability. The optical properties <strong>of</strong> these samples<br />
are measured at normal incidence and their qualitative<br />
features and trends compared to gravity sedimented<br />
colloidal crystals.<br />
Experimental Methods<br />
Materials and Substrates. All solvents and chemicals are<br />
<strong>of</strong> reagent quality and filtered by 0.22 µm syringe filters<br />
(Gelman) except for tetraethoxysilane (99%, Alfa) and 3-(trimethoxysilyl)propyl<br />
methacrylate (TPM, 98%, Aldrich) which<br />
are freshly vacuum distilled before use. The 200 pro<strong>of</strong> ethanol<br />
is obtained from Pharmaco Products, and 29.6% ammonium<br />
hydroxide is purchased from Fisher. Ultrapure water (18.2<br />
MΩcm-1 ) is used directly from a Milli-Q water system.<br />
Microslides (75 × 25 × 1 mm, Fisher) are cut into two equal<br />
halves along the long sides and are used as substrates. Glass<br />
scintillation vials (20 mL, Fisher) are used as experimental<br />
cells.<br />
Instrumentation. Scanning electron microscopy is carried<br />
out on a s<strong>of</strong>tware-controlled LEO 440 SEM designed specifically<br />
for electron-beam lithography. Transmission spectra are<br />
obtained using an Ocean Optics ST2000 fiber optic UV-near-<br />
IR spectrometer. A Coulter N4 Plus laser dynamic light<br />
scattering (DLS) instrument is used to size the particles. A<br />
CrC-100 sputtering system is used to sputter a thin layer (3-4<br />
nm) <strong>of</strong> gold on samples before SEM analysis.<br />
Colloid Synthesis and Purification. Monodisperse SiO2<br />
nanospheres are synthesized following the Stober-Fink-Bohn<br />
method. 66 Nanospheres with diameters ranging from 200 to<br />
700 nm and relative standard deviations smaller than 7% are<br />
obtained through strict control <strong>of</strong> the reaction conditions. 67 The<br />
sizes and size distributions <strong>of</strong> these samples are obtained from<br />
SEM and DLS measurements. Over 200 spheres are sized<br />
using SEM in order to arrive at the reported diameters. Before<br />
deposition, the silica alcosols are washed with 200 pro<strong>of</strong><br />
ethanol by repeated centrifugation and ultrasonic dispersion<br />
cycles in order to remove impurities, such as ammonia, water,<br />
and unreacted tetraethoxysilane. Six cycles are usually performed.<br />
3-(trimethoxysilyl)propyl methacrylate (TPM) coated<br />
silica is synthesized using a published method68 and purified<br />
as above. All microscopy data presented in this work, however,<br />
are from particles without TPM coating. The solvent <strong>of</strong><br />
deposition, rather than the coating surface, is the key parameter<br />
in controlling film deposition.<br />
Experimental Apparatus and Procedures. Prior to use<br />
all microslides and scintillation vials are soaked in a chromicsulfuric<br />
acid cleaning solution overnight, rinsed well with<br />
ultrapure water from a Milli-Q water system, and dried in a<br />
stream <strong>of</strong> nitrogen. A clean microslide is then placed into 15<br />
mL <strong>of</strong> purified silica alcosol in a clean scintillation vial. The<br />
vial is covered by a 1200 mL crystallizing dish to keep out<br />
external airflow and contamination. The entire apparatus is<br />
placed on a vibration-free bench in a temperature-controlled<br />
laboratory (22 ( 1 °C). For the preparation <strong>of</strong> these multilayer<br />
samples, no substrate withdrawl is necessary. The volume<br />
fractions <strong>of</strong> different samples are determined by drying 6 mL<br />
<strong>of</strong> purified silica alcosol in 80 °C vacuum oven overnight and<br />
then weighing the residual solid. 2.04 g/mL is used as the<br />
density <strong>of</strong> silica, 67 though its actual density may be somewhat<br />
lower. Then, the samples are diluted or concentrated using a<br />
centrifuge-redisperse cycle to the required volume fractions.<br />
(66) Stober, W.; Fink, A.; Bohn, E. J. Colloid Interface Sci. 1968,<br />
26, 62.<br />
(67) Bogush, G. H.; Tracy, M. A.; Zukoski IV, C. F. J. Non-Cryst.<br />
Solids 1988, 104, 95.<br />
(68) Philipse, A. P.; Vrij, A. J. Colloid Interface Sci. 1989, 128, 121.<br />
For evaluation <strong>of</strong> the role <strong>of</strong> sphere size on film formation,<br />
six samples (215.2 (3.9%), 298.6 (3.8%), 324.1 (7.2%), 396.6<br />
(5.4%), 437.4 (4.2%), and 508.6 nm (4.3%)) were used. Numbers<br />
in parentheses following the sphere diameters refer to the<br />
relative standard deviation <strong>of</strong> the measured diameters. All the<br />
samples were placed under the same crystallizing dish to<br />
ensure identical ethanol evaporation rates. Samples with<br />
volume fractions <strong>of</strong> 0.1%, 0.5%, 1.0%, 1.5%, 2.0%, and 3.0%<br />
and the same particle size (298.6 nm (3.8%)) were used to<br />
determine the effect <strong>of</strong> volume fraction on the film thickness.<br />
Samples (215.2 (3.9%) and 279.2 nm (4.6%)) with volume<br />
fractions <strong>of</strong> 1% were used to determine the effect <strong>of</strong> solvent<br />
evaporation rate on the film thickness. Duplicates <strong>of</strong> each<br />
sample were tested under three different evaporation conditions:<br />
open to ambient atmosphere, covered in a crystallizing<br />
dish, and covered in a crystallizing dish with a small amount<br />
<strong>of</strong> ethanol (20 mL in a 50 mL beaker). One <strong>of</strong> the duplicates<br />
was used to determine the evaporation rate by weighing the<br />
vial on a digital analytical balance. The typical solvent<br />
evaporation rate, given in units <strong>of</strong> volume per time, was found<br />
to be 9 × 10 -4 cm 3 /min.<br />
Thicker films are fabricated by successive dip coatings. After<br />
each single coating is deposited, the film is air-dried for at least<br />
24 h and dipped again into another purified silica alcosol with<br />
the same particle size. The coating and drying cycle can be<br />
repeated to systematically increase film thickness.<br />
Characterization <strong>of</strong> <strong>Colloidal</strong> <strong>Crystal</strong> Films. Scanning<br />
electron microscopy (SEM) is used to determine the film<br />
thickness. A thin layer <strong>of</strong> gold is sputtered onto the samples<br />
prior to imaging. To reveal an edge appropriate for crosssectional<br />
analysis, samples are scraped using a sharp razor<br />
blade. By tilting the specimen 30-40°, it is possible to image<br />
this edge and quantify film thickness; 10 random locations<br />
from the center square centimeter <strong>of</strong> the sample are analyzed<br />
for thickness. Optical properties <strong>of</strong> the silica colloidal singlecrystal<br />
films are evaluated by measuring their transmission<br />
spectra at normal incidence, using an Ocean Optics ST2000<br />
fiber optic UV-near-IR spectrometer.<br />
Results<br />
<strong>Crystal</strong>line quality is among the most important<br />
parameters in determining the performance <strong>of</strong> colloidal<br />
crystals in optical applications. The formation <strong>of</strong> point<br />
defects or domains can have an enormous impact on the<br />
diffraction properties. Figure 1A shows a typical SEM<br />
image <strong>of</strong> a single crystal <strong>of</strong> colloidal silica with a 298.6<br />
nm diameter, grown using the methods described above.<br />
This sample exhibits an ordered close-packed arrangement<br />
<strong>of</strong> silica colloids over a sample area <strong>of</strong> 10 µm which<br />
extends over an even larger area; this can be illustrated<br />
by the two-dimensional Fourier transform <strong>of</strong> a lowmagnification<br />
SEM image. Such data is shown in the<br />
inset <strong>of</strong> Figure 1A. The sharp peaks confirm the presence<br />
<strong>of</strong> long-range crystalline order, extending over the<br />
largest length scales (40 × 40 µm 2 ) accessible in a single<br />
low-magnification image. Perfectly ordered films can be<br />
made for a variety <strong>of</strong> sphere diameters. Parts A and B<br />
<strong>of</strong> Figure 4 show SEM images <strong>of</strong> two crystals with<br />
different particle sizes (206.4 and 437.4 nm, respectively).<br />
As in Figure 1A, long-range order is confirmed<br />
by Fourier transform <strong>of</strong> low magnification images<br />
(insets to Figure 4).<br />
It is a challenge to use microscopy for pro<strong>of</strong> <strong>of</strong> sample<br />
order over centimeter distances. Lower magnification<br />
images do not have the spatial resolution needed to<br />
identify distinct colloids; one approach is to compare<br />
micrographs <strong>of</strong> 40 µm 2 areas collected as a sequence<br />
during the translation <strong>of</strong> the sample. If domain boundaries<br />
are observed during this movement, then the
<strong>Single</strong>-<strong>Crystal</strong> <strong>Colloidal</strong> <strong>Multilayers</strong> Chem. Mater., Vol. 11, No. 8, 1999 2135<br />
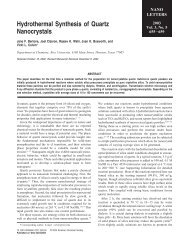
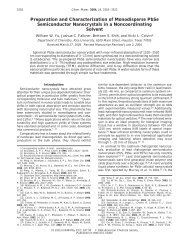
Figure 1. (A) Typical scanning electron micrograph (SEM)<br />
<strong>of</strong> a sample (top view) showing spheres <strong>of</strong> 298.6 nm diameter.<br />
The inset shows a Fourier transform <strong>of</strong> a 40 × 40 µm 2 region.<br />
(B) Typical SEM side view <strong>of</strong> the same sample at the same<br />
magnification (×12 000), showing a perspective view <strong>of</strong> the<br />
cleaved face and the underlying substrate.<br />
hexagonal registry <strong>of</strong> the images evident in their FFTs<br />
will not be aligned. Figure 2 shows such data for four<br />
representative images taken at the edges <strong>of</strong> a4mm<br />
square. The alignment <strong>of</strong> the spots in all four images<br />
illustrates the registry <strong>of</strong> the array lattice over these<br />
long length scales. Morevoer, analysis <strong>of</strong> many intermediate<br />
images also showed perfect alignment and no<br />
evidence <strong>of</strong> any grain boundaries.<br />
While order within the plane parallel to the glass<br />
substrate is important for the optical properties <strong>of</strong> the<br />
films, especially when they are evaluated away from<br />
normal incidence, the stacking <strong>of</strong> close-packed layers<br />
perpendicular to the substrate is responsible for the<br />
diffraction observed in normal-incidence transmission<br />
measurements. To evaluate this issue, colloid films can<br />
be abraded to reveal their stacking perpendicular to the<br />
substrate as shown in Figure 1B. This cross-section<br />
shows that the close-packed structure extends uniformly<br />
over the 15 layers shown; Figure 8B shows a thicker<br />
50 layer sample which also exhibits a regular arrangement<br />
from the top surface to the bottom surface. The<br />
visual appearance <strong>of</strong> the samples (see Figure 3) is a<br />
testament to this high crystalline quality and the<br />
uniform thickness <strong>of</strong> these films.<br />
To form high quality planar crystals, particle size<br />
distribution (S.D.) is a crucial factor. This is illustrated<br />
in Figure 5, which shows SEM images <strong>of</strong> two samples<br />
with different size distributions (3.8% and 14.2% relative<br />
standard deviations, respectively). The sample with<br />
Figure 2. Fourier transforms (FFT) <strong>of</strong> four 11.75 × 11.75 µm 2<br />
regions <strong>of</strong> a1cm 2 colloidal silica single crystal. These images<br />
were part <strong>of</strong> a series taken every 50 µm overa4× 4mm<br />
square region; they represent the four corners and image c<br />
was closest to the edge <strong>of</strong> the sample. The four parallel dashed<br />
lines indicate one reference direction, and demonstrate that<br />
the four images are roughly <strong>of</strong> the same orientation, as were<br />
all intermediate images. Within a 4 × 4 mm 2 region, the<br />
largest deviation from this orientation is ∼1.6 degrees, represented<br />
in image c. This demonstrates that the crystallographic<br />
orientation <strong>of</strong> the sample is preserved over this entire<br />
region.<br />
a narrow size distribution exhibits order over a long<br />
length scale and sharp peaks in the Fourier transform<br />
<strong>of</strong> a low-magnification SEM image; the polydisperse<br />
sample has only short-range order and exhibits rings<br />
in the Fourier transform. Films that lack crystalline<br />
quality, such as the one shown in Figure 5B, even when<br />
relatively thin, are white and opaque. This is in sharp<br />
contrast to the brilliant color and transparency apparent<br />
in more ordered films (Figure 3). Data collected from<br />
over 20 samples suggest that when this method is used,<br />
colloids must have a size distribution with relative<br />
standard deviation less than 8% (on the diameter) in<br />
order to form high quality close-packed crystals and<br />
thus good optical samples.<br />
For this deposition process, two parameters allow for<br />
control <strong>of</strong> film thickness (or number <strong>of</strong> colloidal layers):<br />
particle diameter (d) and particle volume fraction (V.F.).<br />
Figure 6 shows how film thickness varies with these<br />
two parameters. For these measurements layer thickness<br />
is determined using cross-sectional SEM images<br />
<strong>of</strong> the types shown in Figures 1B, 7, and 8. Particle size<br />
affects the film thickness in a systematic way: for the<br />
same volume fraction, a solution <strong>of</strong> larger particles<br />
yields fewer layers. Two examples are shown in Figure<br />
7, and the relationship is quantified in Figure 6A.<br />
Particle volume fraction also affects film thickness<br />
(Figure 6B); more concentrated colloidal solutions leave<br />
thicker multilayer deposits (Figure 8). Because film<br />
uniformity degrades significantly when colloidal solutions<br />
<strong>of</strong> more than 4% volume fraction are used, the<br />
formation <strong>of</strong> thicker films requires multiple coating. In<br />
this approach, samples are allowed to dry and then are
2136 Chem. Mater., Vol. 11, No. 8, 1999 Jiang et al.<br />
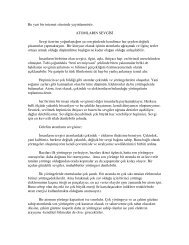
Figure 3. (A) Photograph <strong>of</strong> three samples with different<br />
sphere diameters (307.2, 353.0, and 383.7 nm, from left to<br />
right). The samples are clear and highly uniform. (B) Photograph<br />
<strong>of</strong> the same samples illuminated with white light.<br />
reimmersed in the colloidal solutions; new colloidal<br />
multilayers form easily on top <strong>of</strong> the original ones and<br />
the process can be repeated many times with the<br />
thickness increasing linearly after each deposition.<br />
Figure 9 shows a scanning electron micrograph <strong>of</strong> a<br />
portion <strong>of</strong> a multicoated sample.<br />
The optical properties <strong>of</strong> these films can be evaluated<br />
using visible-near-IR transmission in normal incidence.<br />
Figure 10 shows scaled absorption spectra vs particle<br />
size for a wide range <strong>of</strong> colloidal sphere diameters. Two<br />
notable features <strong>of</strong> the spectra are sharp peaks due to<br />
the Bragg diffraction <strong>of</strong> visible light from the ordered<br />
spheres and a background rising at shorter wavelengths.<br />
The systematic change in color seen in transmission<br />
and reflection <strong>of</strong> uniform films <strong>of</strong> different<br />
particle sizes (see Figure 3) is due to Bragg diffraction.<br />
Figure 11 shows the changes in the optical transmission<br />
spectra <strong>of</strong> films <strong>of</strong> different thickness made using equal<br />
sized particles. The background has been subtracted in<br />
these data so that they can be compared easily. The<br />
intensity <strong>of</strong> the diffracted peak increases approximately<br />
linearly with the number <strong>of</strong> layers, although this is not<br />
evident in Figure 11 because the data have been scaled<br />
to uniform height. Also, the peak widths narrow as<br />
sample thickness is increased. Finally, Fabry-Perot<br />
fringes (indicated by the arrows in Figure 11) become<br />
smaller and more closely spaced in thicker samples.<br />
Discussion<br />
<strong>Crystal</strong> Structure <strong>of</strong> Planar Arrays. SEM images<br />
<strong>of</strong> the top view <strong>of</strong> these samples show that the colloids<br />
are arranged in a close-packed fashion, with each sphere<br />
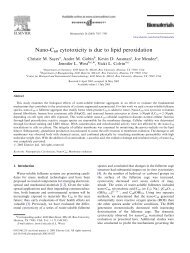
Figure 4. SEM images <strong>of</strong> two samples with different particle<br />
diameters (×12 000 magnification). The insets show Fourier<br />
transforms <strong>of</strong> 40 × 40 µm 2 regions. Key: (A) d ) 206.4 nm;<br />
(B) d ) 437.4 nm.<br />
touching six others in one layer (Figures 1 and 4). This<br />
close-packing arrangement is well-known in crystals<br />
comprised <strong>of</strong> colloids, such as these silica spheres, whose<br />
ionic interactions are minimal. 69,70 In this close-packed<br />
geometry, whether the structure is face-centered cubic<br />
(ABCABC...), hexagonal close-packed (ABABAB...), or<br />
randomly stacked, these images illustrate that the<br />
samples are oriented with their (111) axes parallel to<br />
the substrate.<br />
Exact characterization <strong>of</strong> the crystal structure <strong>of</strong> these<br />
samples from SEM micrographs alone is problematic.<br />
Though images such as these confirm a regular closepacked<br />
arrangement (Figures 1B, 7, and 8), they cannot<br />
be used to distinguish between the fcc and hcp structures.<br />
This is because it is difficult to determine the<br />
exact angle <strong>of</strong> the cross-sectional view, which in turn<br />
makes it difficult to assess which crystal face is visualized<br />
in these images. Confocal microscopy <strong>of</strong> gravity<br />
sedimented colloidal crystals 71 has indicated that the<br />
stacking between (111) planes is neither fcc nor hcp but<br />
is instead a random arrangement. Theoretical calculations,<br />
though, have indicated that the fcc structure is<br />
stabilized slightly even with completely noninteracting<br />
spheres. 72,73 In future studies, where the transmission<br />
(69) Tsunekawa, S.; Barnakov, Y. A.; Poborchii, V. V.; Smoilovich,<br />
S. M.; Kasuya, A.; Nishina, Y. Microporous Mater. 1996, 8, 275.<br />
(70) Miguez, H.; Meseguer, F.; Lopez, C.; Mifsud, A.; Moya, J. S.;<br />
Vazquez, L. Langmuir 1997, 13, 6009.<br />
(71) van Blaaderen, A.; Ruel, R.; Wiltzius, P. Nature 1997, 385, 321.<br />
(72) Woodcock, L. V. Nature 1997, 385, 141.
<strong>Single</strong>-<strong>Crystal</strong> <strong>Colloidal</strong> <strong>Multilayers</strong> Chem. Mater., Vol. 11, No. 8, 1999 2137<br />
Figure 5. SEM images <strong>of</strong> two samples with different particle<br />
size distributions (S.D.) (×12 000 magnification). The insets<br />
show Fourier transforms <strong>of</strong> 40 × 40 µm 2 regions. (A) S.D. )<br />
3.8%; (B) S.D. ) 14.2%.<br />
Figure 6. (A, top) Number <strong>of</strong> layers vs the inverse <strong>of</strong> the<br />
particle diameter, for samples grown from a 1% V.F. solution.<br />
(B, bottom) Number <strong>of</strong> layers vs the particle volume fraction,<br />
d ) 298.6 nm.<br />
is investigated as a function <strong>of</strong> angle away from the<br />
normal, the exact nature <strong>of</strong> the crystal structure will<br />
be a more important issue. 26,27<br />
(73) Bruce, A. D.; Wilding, N. B.; Ackland, G. J. Phys. Rev. Lett.<br />
1997, 79, 3002.<br />
Figure 7. SEM cross-sectional images <strong>of</strong> two samples with<br />
different particle diameters, grown from solutions with the<br />
same volume fraction (0.5%). The 206.4 nm particle size<br />
produced a film with 14 layers (A), and a 396.6 nm particle<br />
size produced a film with 7 layers (B).<br />
Domain Size <strong>of</strong> Planar Arrays. An important<br />
feature <strong>of</strong> these samples is their long-range order within<br />
the plane parallel to the substrate. In gravity-sedimented<br />
colloidal crystals, there can be some preferential<br />
alignment <strong>of</strong> the crystal axes with the capillary sidewalls;<br />
however, such samples are multicolored under<br />
white light illumination 74 and are thought to contain<br />
colloidal crystal domains whose (111) axes are not<br />
aligned. In contrast, the multilayer samples described<br />
here are deposited onto a flat substrate which forces<br />
their (111) axes to be aligned over distances <strong>of</strong> millimeters<br />
(Figure 2). For this reason, when viewed at a<br />
variety <strong>of</strong> angles, the color <strong>of</strong> the entire film is uniform<br />
(Figure 3). Thus, unlike the gravity-sedimented colloidal<br />
crystals which are polycrystalline in most instances, 46,47<br />
these samples consist <strong>of</strong> a single crystalline close-packed<br />
array. 75 We note that in this work when samples with<br />
slightly broader size distributions (>8%) are deposited,<br />
grain boundaries in the plane parallel to the substrate<br />
are observed; similarly, Nagayama et al. observed grain<br />
boundaries in monolayers <strong>of</strong> colloids with 10-15%<br />
distributions in size. 57 This suggests that the monodispersity<br />
<strong>of</strong> the colloids, rather than the deposition process<br />
itself, is responsible for their long-range ordering.<br />
Perfection <strong>of</strong> <strong>Colloidal</strong> <strong>Crystal</strong>s. Though these<br />
samples are single crystals, they are not perfect crystals<br />
(74) Gast, A. P.; Russel, W. B. Phys. Today 1998, 51 (12), 24.<br />
(75) Parker, S. P. Dictionary <strong>of</strong> Scientific and Technical Terms, 4th<br />
ed.; McGraw-Hill Book Company: New York, 1989.
2138 Chem. Mater., Vol. 11, No. 8, 1999 Jiang et al.<br />
Figure 8. SEM cross-sectional images <strong>of</strong> two samples grown<br />
from solutions with different particle volume fractions. In both<br />
parts A and B, the spheres are 298.6 nm in diameter. (A)<br />
V.F. ) 0.8%, 18 layers; (B) V.F. ) 3.0%, ∼50 layers.<br />
Figure 9. Typical SEM image <strong>of</strong> a sample (d ) 279.2 nm)<br />
deposited with four successive coatings. Each deposition<br />
provides 12 colloidal monolayers.<br />
as is clear from the SEM photographs. Two types <strong>of</strong><br />
defects are observed routinely in the SEM images <strong>of</strong><br />
these samples. The first is sphere vacancies that appear<br />
every ∼10 µm on average. The second is vertical cracks<br />
in the crystal, perpendicular to the glass substrate.<br />
Examples may be seen in Figures 7A and 8A. Cracks<br />
are typically observed every 10 µm in most samples and<br />
unlike a classic grain boundary, the registry <strong>of</strong> the<br />
hexagonal packing is preserved across these features.<br />
One explanation for the cracking is that the deposition<br />
<strong>of</strong> metal and the subsequent exposure <strong>of</strong> films to the<br />
Figure 10. Normal incidence transmission spectra (optical<br />
density) <strong>of</strong> samples with different sphere diameters, determined<br />
using SEM analysis. These curves have been scaled to<br />
a constant height, and vertically <strong>of</strong>fset for clarity. The arrows<br />
indicate the expected positions <strong>of</strong> the peaks for each curve,<br />
calculated using Bragg’s law at normal incidence and the<br />
diameters shown. Typically at the peak maximum only 10-<br />
20% <strong>of</strong> the incident light is transmitted.<br />
Figure 11. Normal incidence transmission spectra (optical<br />
density) <strong>of</strong> three samples (d ) 279.2 nm) with increasing film<br />
thickness. These curves have been scaled to a constant height,<br />
and vertically <strong>of</strong>fset for clarity. Thicker samples exhibit more<br />
closely spaced (and smaller) Fabry-Perot fringes. The arrows<br />
indicate local maxima, λp, chosen for thickness analysis, with<br />
the longest wavelength as p ) 0 (see supplemental Figures 1<br />
and 2). In addition, a rising background apparent in the data<br />
<strong>of</strong> Figure 10 has been subtracted from these data; for samples<br />
<strong>of</strong> more than 20 layers, this background contributes at most<br />
20% <strong>of</strong> the rejection <strong>of</strong> light at the peak maximum.<br />
high vacuum <strong>of</strong> the SEM damages their structure and<br />
induces cracking; to evaluate this issue, atomic force<br />
microscopy (AFM) <strong>of</strong> the same materials was performed<br />
under ambient conditions on the as-prepared surfaces.<br />
Though cracks were still observed, they were fewer in<br />
number and typically found every 100 µm. The drying<br />
tension in thin colloidal films is well-known to cause
<strong>Single</strong>-<strong>Crystal</strong> <strong>Colloidal</strong> <strong>Multilayers</strong> Chem. Mater., Vol. 11, No. 8, 1999 2139<br />
cracking <strong>of</strong> much thinner deposits; 76 it is likely that such<br />
drying-induced shrinkage is responsible for this problem<br />
as well. Strategies for minimizing this effect include the<br />
addition <strong>of</strong> surfactants, and better control over the<br />
drying conditions.<br />
Controlling Film <strong>Thickness</strong>. One <strong>of</strong> the great<br />
advantages <strong>of</strong> this method <strong>of</strong> colloidal crystal formation<br />
is its ability to create samples with precisely controlled<br />
thickness. By controlling such parameters as colloidal<br />
concentration and sphere size, it is possible to vary the<br />
thickness <strong>of</strong> the films from a few layers to hundreds <strong>of</strong><br />
layers. The representative images in Figures 7 and 8<br />
suggest that film thickness, T, is related to the deposition<br />
parameters in a systematic way. Figure 6 illustrates<br />
the quantitative relationships between the<br />
number <strong>of</strong> colloidal layers, k, and the deposition parameters<br />
(volume fraction <strong>of</strong> colloids in solution) and<br />
d (colloid diameter).<br />
These trends can be understood using a model developed<br />
by Nagayama et al. 56-65 for the self-assembly <strong>of</strong><br />
monolayer colloidal films. In his experiments, which are<br />
reminiscent <strong>of</strong> Langmuir-Blodgett methods for selfassembly,<br />
a vertical or slanted substrate is withdrawn<br />
from a solution <strong>of</strong> polystyrene colloids at a constant rate.<br />
A meniscus region is formed on the substrate due to<br />
wetting by the solution; evaporation <strong>of</strong> the solvent out<br />
<strong>of</strong> this thin meniscus leads to a constant solution influx,<br />
which draws colloids into the area <strong>of</strong> film formation.<br />
During the solvent evaporation these colloids experience<br />
interparticle capillary forces which organize them into<br />
close-packed arrays. The resulting thickness is then<br />
entirely dependent on the flux <strong>of</strong> particles into the<br />
meniscus, and mass balance can be used to derive a<br />
simple formula for array thickness.<br />
The film formation conditions used by Nagayama et<br />
al. were optimized for the production <strong>of</strong> uniform colloidal<br />
monolayers; however, it is possible to adapt this formalism<br />
to the formation <strong>of</strong> multilayer films. To create thick<br />
films, the array growth rate, which is a balance <strong>of</strong> the<br />
solvent evaporation and substrate withdrawal rates,<br />
must be as small as possible. Thus, the slowest possible<br />
array growth results when the substrate is not mechanically<br />
withdrawn. Under this circumstance the<br />
array growth rate and the solvent evaporation rate are<br />
equal. This leads to a prediction that the final multilayer<br />
thickness depends on the deposition parameters according<br />
to 77<br />
k )<br />
L<br />
0.605d(1 - )<br />
(1)<br />
where k is the number <strong>of</strong> layers, L is the meniscus<br />
height, is the ratio between the velocity <strong>of</strong> a particle<br />
in solution and the fluid velocity and is taken to be 1, d<br />
is the particle diameter, and is the particle volume<br />
fraction in solution. The data shown in Figure 6 clearly<br />
demonstrate that the basic trends predicted by this<br />
equation are valid. A surprising result from the model<br />
is that the final array thickness is not dependent on the<br />
(76) Bergna, H. E. The Colloid Chemistry <strong>of</strong> Silica; Bergna, H. E.,<br />
Ed.; American Chemical Society: Washington, DC, 1994; Vol. 234, p<br />
376.<br />
(77) This equation was derived from eq 7 from Nagayama et al. 57<br />
by allowing the evaporation rate, je, to be equal to the array growth<br />
rate, vc.<br />
solvent evaporation rate. This is because, while faster<br />
solvent evaporation does lead to faster array formation,<br />
it also leads to increased solution influx into the array<br />
growth region. This increased influx <strong>of</strong> silica colloids<br />
balances the faster growth rate, leading to a film<br />
thickness independent <strong>of</strong> evaporation rate. This prediction<br />
was verified experimentally by creating multilayer<br />
samples under different evaporation conditions. While<br />
film uniformity was somewhat dependent on evaporation<br />
rate, film thickness was not. In addition, film<br />
thickness was insensitive to the surface derivatization<br />
<strong>of</strong> the colloids.<br />
An important issue in this method is the role that the<br />
solvent plays in controlling the deposition <strong>of</strong> colloidal<br />
multilayers. The solvent enters into the model through<br />
the parameter L that is defined as the height <strong>of</strong> the<br />
meniscus over which evaporation occurs. In the case <strong>of</strong><br />
the ethanolic solutions used in this work, this parameter<br />
can be extracted from linear fits to the data shown in<br />
Figure 6. Assuming a <strong>of</strong> 1, the data in Figure 6A<br />
provides an L value <strong>of</strong> 316 µm while the data in Figure<br />
6B gives an L value <strong>of</strong> 301 µm. Similar evaporation<br />
lengths, on the order <strong>of</strong> 200 µm, were reported for the<br />
growth <strong>of</strong> polystyrene colloidal monolayers from water. 63<br />
While this parameter cannot be exactly computed, an<br />
upper limit for its value can be found by considering<br />
the meniscus height <strong>of</strong> ethanol on a flat glass surface.<br />
Using the surface tension <strong>of</strong> ethanol and its contact<br />
angle for wetting glass, it is possible to calculate a<br />
meniscus height <strong>of</strong> 3500 µm. 78 As expected, the observed<br />
meniscus height <strong>of</strong> ∼310 µm is smaller than the value<br />
for a flat substrate as the film must wet a rough surface<br />
<strong>of</strong> colloids. This analysis suggests that solvents such as<br />
water, which have large surface tensions and even lower<br />
contact angles, should deposit thicker films than the<br />
corresponding ethanolic solutions. Attempts to deposit<br />
silica colloids from aqueous solutions did lead to thicker<br />
films, but these samples had poor uniformity.<br />
Measuring Multilayer <strong>Thickness</strong> Using Optical<br />
Techniques. Multilayer thickness is an important<br />
parameter for quantitative assessment <strong>of</strong> sample optical<br />
properties. While scanning electron microscopy (SEM)<br />
provides a measure <strong>of</strong> this parameter, it is a destructive<br />
method as it requires the deposition <strong>of</strong> a thin gold<br />
coating on the sample. A less time-consuming and<br />
nondestructive method is an optical technique which<br />
uses the Fabry-Perot (FP) fringe 79 positions to analyze<br />
for film thickness. These fringes result from interference<br />
between reflections from the top and bottom surfaces<br />
<strong>of</strong> the sample and are indicated by the arrows in Figure<br />
11. An analysis, using Bragg’s law, <strong>of</strong> the spectral<br />
positions <strong>of</strong> these local maxima permits an accurate<br />
determination <strong>of</strong> sample thickness (Supporting Figure<br />
1). The thickness determined from this optical technique<br />
is in excellent agreement with thickness found from<br />
cross-sectional SEM (Supporting Figure 2).<br />
<strong>Thickness</strong> Uniformity in Multilayer Samples. An<br />
important feature <strong>of</strong> this deposition method is that it<br />
allows for the systematic control over multilayer thickness<br />
(Figure 6). Indeed, the preparation <strong>of</strong> such well-<br />
(78) Hiemenz, P. C. Principles <strong>of</strong> Colloid and Surface Chemistry;<br />
Marcel Dekker: New York, 1984; p 278.<br />
(79) Hecht, E. Optics, 2nd ed.; Addison-Wesley Publishing Company:<br />
Reading, MA, 1987.
2140 Chem. Mater., Vol. 11, No. 8, 1999 Jiang et al.<br />
controlled materials now makes it possible to evaluate<br />
many thickness-dependent properties <strong>of</strong> these systems.<br />
For this work to proceed, however, it is important to<br />
assess the uniformity <strong>of</strong> the film thickness over the<br />
entire area <strong>of</strong> the sample. One way to characterize the<br />
thickness distribution is to rely on the statistical<br />
analysis <strong>of</strong> cross-sectional SEM images. Films are<br />
typically abraded along a diagonal, and it is possible to<br />
collect cross-sectional data at many points over the<br />
entire central region (∼5 mm) <strong>of</strong> the sample. The<br />
standard deviation found for thickness in these measurements<br />
is on the order <strong>of</strong> 10%. A complementary<br />
method for analyzing film thickness uniformity is to rely<br />
on the optical techniques to assess film thickness<br />
(Supporting Figures 1 and 2). Simulations <strong>of</strong> the interference<br />
effect indicate that if the thickness <strong>of</strong> the sample<br />
in the optical path varies by more than (10%, then welldefined<br />
maxima and minima will not be observed. Thus,<br />
the observation <strong>of</strong> well-defined fringes (Figure 11)<br />
demonstrates that film thickness deviates less than 10%<br />
on average.<br />
The Optical Properties <strong>of</strong> <strong>Colloidal</strong> <strong>Crystal</strong> <strong>Multilayers</strong>.<br />
The basic features <strong>of</strong> the normal incidence<br />
optical spectrum <strong>of</strong> these colloidal crystal multilayers<br />
are in good agreement with those observed for gravitysedimented<br />
samples. Figure 10 shows how the peak in<br />
the optical spectum depends on sphere diameter. When<br />
the wavelength <strong>of</strong> incident light satisfies the Bragg<br />
condition, it is diffracted away from the propagation<br />
axis, leading to a decrease in the transmission and thus<br />
a peak in the absorption spectrum. The position <strong>of</strong> this<br />
peak can be related to the sphere diameter and the<br />
effective refractive index <strong>of</strong> the medium using λmax )<br />
2neffd111, where d111 is the interlayer spacing. 80 The<br />
arrows that are shown in Figure 10 are peak positions<br />
predicted from this equation using sphere sizes as<br />
determined from SEM; agreement with experimental<br />
data is quite good.<br />
While this simple diffraction theory can predict the<br />
peak positions, it is unable to provide a quantitative<br />
explanation for any <strong>of</strong> the other features in the spectra.<br />
Recently, several groups have attempted to adapt the<br />
dynamical theory <strong>of</strong> X-ray diffraction to this<br />
purpose. 42,43,45,81-83 However, this theory is based on the<br />
approximation that the refractive index contrast between<br />
the scattering centers and the interstitial medium<br />
is quite small, on the order <strong>of</strong> 10 -4 , an approximation<br />
not valid for these silica-air crystals. For this reason,<br />
a detailed analysis <strong>of</strong> the shapes and intensities <strong>of</strong> the<br />
optical transmission function must rely on more com-<br />
(80) For close-packed spheres, the interlayer spacing is related to<br />
the sphere diameter, D, by d111 ) (2/3) 1/2 D.<br />
(81) Monovoukas, Y.; Fuller, G. G.; Gast, A. P. J. Chem. Phys. 1990,<br />
93, 8294.<br />
(82) Rundquist, P. A.; Photinos, P.; Jagannathan, S.; Asher, S. A.<br />
J. Chem. Phys. 1989, 91, 4932.<br />
(83) Sunkara, H. B.; Jethmalani, J. M.; Ford, W. T. Hybrid<br />
Organic-Inorganic Composites; Mark, J. E., Lee, C. Y.-C., Bianconi,<br />
P. A., Ed.; American Chemical Society: Washington, DC, 1995; Vol.<br />
585, p 181.<br />
plete treatments <strong>of</strong> scattering from periodic dielectrics.<br />
Theories <strong>of</strong> the optical properties <strong>of</strong> photonic band gap<br />
materials provide an avenue for this understanding; this<br />
issue has been explored more fully elsewhere. 84<br />
An important feature <strong>of</strong> these spectra is the rising<br />
background that grows at shorter wavelengths; this<br />
causes the samples to look slightly hazy and could place<br />
limits on their use in many optical applications. This<br />
background has been observed, but rarely discussed, in<br />
gravity-sedimented crystals as well, and its origins<br />
remain obscure. While it does not clearly fit the λ -4<br />
dependence expected for Rayleigh scattering, defects or<br />
sphere surface roughness could give rise to this phenomenon.<br />
Alternatively, it may represent the collective<br />
effect <strong>of</strong> diffraction <strong>of</strong>f <strong>of</strong> all <strong>of</strong> the lattice planes other<br />
than the (111) planes. 85 If so, it is an intrinsic property<br />
<strong>of</strong> any periodic array <strong>of</strong> spheres, not merely <strong>of</strong> selfassembled<br />
colloidal crystals.<br />
An interesting feature <strong>of</strong> the optical spectra is the<br />
increase in peak width as sample thickness is decreased<br />
(Figure 11). This effect is similar to the Debye-Scherrer<br />
broadening <strong>of</strong> X-ray diffraction peaks in small crystallites;<br />
86 however, the widths reach a limiting value <strong>of</strong><br />
only ∼40 nm in thick samples. A full treatment <strong>of</strong> the<br />
thickness-dependent optical effects <strong>of</strong> these samples is<br />
the subject <strong>of</strong> a forthcoming publication. 87<br />
Conclusion<br />
Using a simple method, it is possible to deposit planar<br />
single crystals <strong>of</strong> nanosphere arrays on a wide variety<br />
<strong>of</strong> substrates. Scanning electron microscopy (SEM) <strong>of</strong><br />
the samples shows a close-packed structure and singlecrystal<br />
quality throughout the film. The number <strong>of</strong><br />
nanospheres deposited can be widely varied with this<br />
method; film thicknesses ranging from single monolayers<br />
to 100 layers are easily created through control over<br />
the particle volume fraction and sphere size. The planar<br />
format and uniformity <strong>of</strong> these materials make them<br />
ideally suited for optical characterization. The qualitative<br />
features <strong>of</strong> their spectra are in good agreement with<br />
simple models <strong>of</strong> diffraction.<br />
Acknowledgment. The authors would like to acknowledge<br />
funding from the NSF (CHE-9702520) and<br />
the Welch Foundation (C-1342). V.L.C. would like to<br />
thank D. M. Mittleman for many useful discussions<br />
concerning the optical properties <strong>of</strong> these materials.<br />
Supporting Information Available: Figures showing an<br />
analysis, using Bragg’s law, <strong>of</strong> sample thickness (Supporting<br />
Figure 1) and correlation <strong>of</strong> SEM with Bragg’s Law thickness<br />
(Supporting Figure 2). This material is available free <strong>of</strong> charge<br />
via the Internet at http://pubs.acs.org.<br />
CM990080+<br />
(84) Mittleman, D. M.; Bertone, J. F.; Jiang, P.; Hwang, K. S.;<br />
Colvin, V. L. J. Chem. Phys. 1999, 111, 345.<br />
(85) Liu, L.; Li, P.; Asher, S. A. J. Am. Chem. Soc. 1997, 119, 2729.<br />
(86) Cullity, B. D. Elements <strong>of</strong> X-ray Diffraction, 2nd ed.; Addison-<br />
Wesley Publishing Company, Inc.: Reading, MA, 1978.<br />
(87) Bertone, J. F.; Jiang, P.; Hwang, K. S.; Mittleman, D. M.;<br />
Colvin, V. L. Phys. Rev. Lett., in press.