- Page 1 and 2: July 2006 Volume 9 Number 3
- Page 3 and 4: Guidelines for authors Submissions
- Page 5 and 6: Component Exchange Community: A mod
- Page 7 and 8: students negotiate in the peer-asse
- Page 9 and 10: of relevant test sheets from larger
- Page 11 and 12: of each generated test sheet is clo
- Page 13 and 14: C. An Illustrative Example Herein,
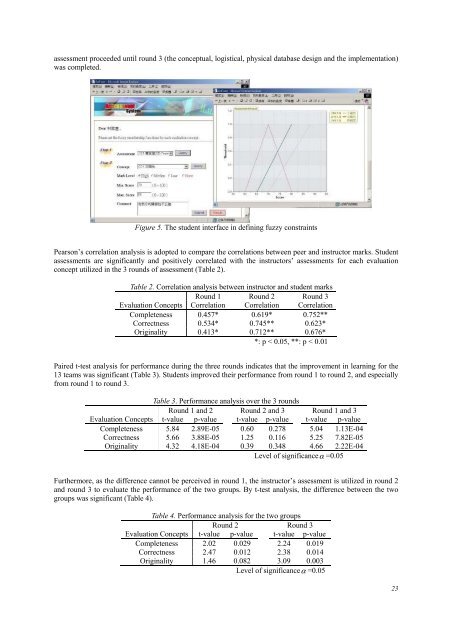
- Page 15 and 16: Figure. 2. Teacher interface for de
- Page 17 and 18: Table 4 shows the experimental resu
- Page 19 and 20: Acknowledgement This study is suppo
- Page 21 and 22: Lai, K. R., & Lan, C. H. (2006). Mo
- Page 23 and 24: Web-based peer assessment has recen
- Page 25 and 26: Ψ : Π p → [ 0, 1] is an evaluat
- Page 27: K Thus, agent K selected the most l
- Page 31 and 32: Lai, K. R., & Lin, M. W. (2004). Mo
- Page 33 and 34: identifiers to enable efficient ret
- Page 35 and 36: Research Questions We aim to design
- Page 37 and 38: conceptual clustering (FCA) Unsuper
- Page 39 and 40: (a) (b) (c) Figure 6. (a) The train
- Page 41 and 42: Given source ontological element Oe
- Page 43 and 44: Generally, a threshold value of 0.8
- Page 45 and 46: Learning Object Interoperability in
- Page 47 and 48: Klein, M. (2001). Combining and rel
- Page 49 and 50: whatever technologies are available
- Page 51 and 52: constructive feedback elicited from
- Page 53 and 54: Computer Science courses by means o
- Page 55 and 56: University of Joensuu (we used the
- Page 57 and 58: of service would help designers to
- Page 59 and 60: Gerdt, P., Kurhila, J., Meisalo, V.
- Page 61 and 62: Sierra, J. L., Fernández-Valmayor,
- Page 63 and 64: activity could be better based on t
- Page 65 and 66: García Santesmases Computing museu
- Page 67 and 68: epositories, enable different acces
- Page 69 and 70: general-purpose LMS, like WebCT. In
- Page 71 and 72: In Figure 8 we show some snapshots
- Page 73 and 74: Rehberg, S., Ferguson, D., McQuilla
- Page 75 and 76: Campbell et al, 2000; Lankes, 1995)
- Page 77 and 78: Figure 2 shows the entire layout of
- Page 79 and 80:
that learners cannot understand the
- Page 81 and 82:
of each learning factor in learning
- Page 83 and 84:
ac1 aci acc Class1 Classi Classc ar
- Page 85 and 86:
the non-fired linguistic terms. Thi
- Page 87 and 88:
various linguistic terms to describ
- Page 89 and 90:
Number of patterns with unknown lea
- Page 91 and 92:
Table 13. The discovered learning p
- Page 93 and 94:
Morimoto, Y., Ueno, M., Kikukawa, I
- Page 95 and 96:
Figure 2 outlines a model illustrat
- Page 97 and 98:
Lesson form Assessment Portfolios W
- Page 99 and 100:
Formal description method Developme
- Page 101 and 102:
Although Figure 3 is a description
- Page 103 and 104:
Figure 6. Screen of teacher’s por
- Page 105 and 106:
Von Brevern, H. & Synytsya, K. (200
- Page 107 and 108:
he or she resolved a correspondent
- Page 109 and 110:
SSTA builds the necessary formal gr
- Page 111 and 112:
Task Decomposition Task decompositi
- Page 113 and 114:
Preliminary task decomposition buil
- Page 115 and 116:
on mere engineering principles. Ins
- Page 117 and 118:
Cutshall, R., Changchit, C., & Elwo
- Page 119 and 120:
Data Collection Surveys were distri
- Page 121 and 122:
Figure 2. The factors perceived as
- Page 123 and 124:
References Al-Khaldi, M. A., & Al-J
- Page 125 and 126:
Appendix 1: Critical Success Factor
- Page 127 and 128:
Cagiltay, N. E., Yildirim, S., & Ak
- Page 129 and 130:
as well as a way of approaching lea
- Page 131 and 132:
case studies also yield to better u
- Page 133 and 134:
opportunities to choose any subject
- Page 135 and 136:
If everything had been designed in
- Page 137 and 138:
Teacher or self-study preferences:
- Page 139 and 140:
go between these two approaches and
- Page 141 and 142:
Microsoft (2000). Microsoft's clip
- Page 143 and 144:
One of the visualization techniques
- Page 145 and 146:
the interrelationships among concep
- Page 147 and 148:
The control group. On the first day
- Page 149 and 150:
among concepts although they had no
- Page 151 and 152:
learners to be attentive to learnin
- Page 153 and 154:
Jonassen, D. H. (2000). Computers a
- Page 155 and 156:
1985; Voyer et al.,1995) show that
- Page 157 and 158:
Procedure This study employed a fac
- Page 159 and 160:
Total (Females+Males) Spatial Visua
- Page 161 and 162:
Given the absence of any significan
- Page 163 and 164:
Ellis, T. (2001). Animating to impr
- Page 165 and 166:
Delwiche, A. (2006). Massively mult
- Page 167 and 168:
Gee (2003) argues that all knowledg
- Page 169 and 170:
attempted to guess which students w
- Page 171 and 172:
computers. There might also have be
- Page 173 and 174:
On the whole, the gaming community
- Page 175 and 176:
Bradley, C., & Froomkin, M. (2003).
- Page 177 and 178:
Pearce, C. (2001) Story as play spa
- Page 179 and 180:
How to encourage students to do exe
- Page 181 and 182:
dependent on field. This is an impo
- Page 183 and 184:
(preferences, history, etc.). The u
- Page 185 and 186:
expected from them. The teaching te
- Page 187 and 188:
Hussain, S., Lindh, J., & Shukur, G
- Page 189 and 190:
Moore & Ray (1999) argue for more a
- Page 191 and 192:
Quantitative methods The quantitati
- Page 193 and 194:
marginal homogeneity by comparing g
- Page 195 and 196:
with the attitude questions include
- Page 197 and 198:
materials to help teachers instruct
- Page 199 and 200:
Appendix A Statement 1. LEGO materi
- Page 201 and 202:
alternatives to high-quality, but r
- Page 203 and 204:
Because number of statements made i
- Page 205 and 206:
questions. If the student was instr
- Page 207 and 208:
Participant 45.16 19 2.38 6.50 .000
- Page 209 and 210:
condition, however, do not drastica
- Page 211 and 212:
Breiter, A., & Light, D. (2006). Da
- Page 213 and 214:
Today, MIS literature has moved for
- Page 215 and 216:
(Drucker, 1989). Therefore, data, p
- Page 217 and 218:
of the information provided. Second
- Page 219 and 220:
Supporting Conversations: Most of t
- Page 221 and 222:
Gorry, G. A., & Scott Morton, M. S.
- Page 223 and 224:
Deng, Y.-C., Lin, T., Kinshuk, Chan
- Page 225 and 226:
2. Being the platform to foster 1:1
- Page 227 and 228:
1. Learning devices which are hardw
- Page 229 and 230:
component provider is not required
- Page 231 and 232:
e-Bay Model vs. Amazon-model A comp
- Page 233 and 234:
A Scenario of Collaboration Figure
- Page 235 and 236:
Quality: researchers with higher po
- Page 237 and 238:
Gibbs, W. J., Olexa, V., & Bernas,
- Page 239 and 240:
Visualization of Online Discussions
- Page 241 and 242:
MTRDS Design MTRDS is a Web-based p
- Page 243 and 244:
ather than of initiating dialogue,
- Page 245 and 246:
dominance or apprehension, and part
- Page 247 and 248:
Jeong, A. (2004). Methods and tools
- Page 249 and 250:
Ng’ambi, D., & Johnston, K. (2006
- Page 251 and 252:
understanding of how students acqui
- Page 253 and 254:
A message is not only an expressive
- Page 255 and 256:
Figure 2: DFAQ screen showing the n
- Page 257 and 258:
Comparing the results of the same s