

October 2011 Volume 14 Number 4 - Educational Technology ...
October 2011 Volume 14 Number 4 - Educational Technology ...
October 2011 Volume 14 Number 4 - Educational Technology ...

Create successful ePaper yourself
Turn your PDF publications into a flip-book with our unique Google optimized e-Paper software.
the average variance-extracted values were all above the threshold value of 0.50 (Hair, et al., 2006). Hence all three<br />
conditions for convergent validity were met for the four measurement models (See Table 3).<br />
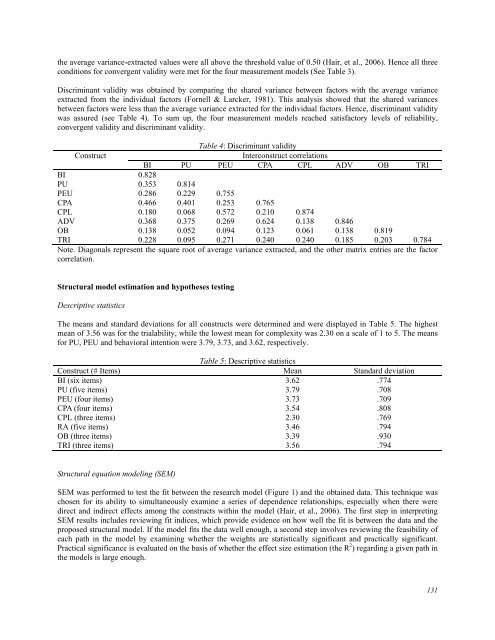
Discriminant validity was obtained by comparing the shared variance between factors with the average variance<br />
extracted from the individual factors (Fornell & Larcker, 1981). This analysis showed that the shared variances<br />
between factors were less than the average variance extracted for the individual factors. Hence, discriminant validity<br />
was assured (see Table 4). To sum up, the four measurement models reached satisfactory levels of reliability,<br />
convergent validity and discriminant validity.<br />
Table 4: Discriminant validity<br />
Construct Interconstruct correlations<br />
BI PU PEU CPA CPL ADV OB TRI<br />
BI 0.828<br />
PU 0.353 0.8<strong>14</strong><br />
PEU 0.286 0.229 0.755<br />
CPA 0.466 0.401 0.253 0.765<br />
CPL 0.180 0.068 0.572 0.210 0.874<br />
ADV 0.368 0.375 0.269 0.624 0.138 0.846<br />
OB 0.138 0.052 0.094 0.123 0.061 0.138 0.819<br />
TRI 0.228 0.095 0.271 0.240 0.240 0.185 0.203 0.784<br />
Note. Diagonals represent the square root of average variance extracted, and the other matrix entries are the factor<br />
correlation.<br />
Structural model estimation and hypotheses testing<br />
Descriptive statistics<br />
The means and standard deviations for all constructs were determined and were displayed in Table 5. The highest<br />
mean of 3.56 was for the trialability, while the lowest mean for complexity was 2.30 on a scale of 1 to 5. The means<br />
for PU, PEU and behavioral intention were 3.79, 3.73, and 3.62, respectively.<br />
Table 5: Descriptive statistics<br />
Construct (# Items) Mean Standard deviation<br />
BI (six items) 3.62 .774<br />
PU (five items) 3.79 .708<br />
PEU (four items) 3.73 .709<br />
CPA (four items) 3.54 .808<br />
CPL (three items) 2.30 .769<br />
RA (five items) 3.46 .794<br />
OB (three items) 3.39 .930<br />
TRI (three items) 3.56 .794<br />
Structural equation modeling (SEM)<br />
SEM was performed to test the fit between the research model (Figure 1) and the obtained data. This technique was<br />
chosen for its ability to simultaneously examine a series of dependence relationships, especially when there were<br />
direct and indirect effects among the constructs within the model (Hair, et al., 2006). The first step in interpreting<br />
SEM results includes reviewing fit indices, which provide evidence on how well the fit is between the data and the<br />
proposed structural model. If the model fits the data well enough, a second step involves reviewing the feasibility of<br />
each path in the model by examining whether the weights are statistically significant and practically significant.<br />
Practical significance is evaluated on the basis of whether the effect size estimation (the R 2 ) regarding a given path in<br />
the models is large enough.<br />
131


