

October 2011 Volume 14 Number 4 - Educational Technology ...
October 2011 Volume 14 Number 4 - Educational Technology ...
October 2011 Volume 14 Number 4 - Educational Technology ...

You also want an ePaper? Increase the reach of your titles
YUMPU automatically turns print PDFs into web optimized ePapers that Google loves.
survey. But they can access the online survey once. Questions were based on a 7-point Likert scale with response<br />
options ranging from strongly disagree (1) to strongly agree (7). Demographic information regarding students was<br />
also obtained. Participants were recruited from undergraduate and graduate programs via random selections. The<br />
researchers then contacted course instructors for permissions to post the research information in their classrooms<br />
explaining the purpose and procedure of the study. The online survey was available for four months before the data<br />
analysis.<br />
Results<br />
Based on the research questions, this study used both descriptive and inferential statistics for data analysis. The<br />
research team first used descriptive statistics to report the distribution of Web 2.0 utilization levels. Inferential<br />
statistics (ie., t-test) was then conducted to identify the difference on participants’ Web 2.0 utilization levels between<br />
samples from the two countries.<br />
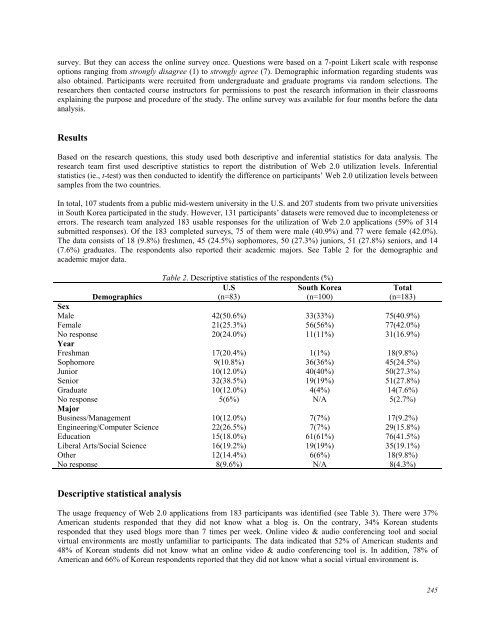
In total, 107 students from a public mid-western university in the U.S. and 207 students from two private universities<br />
in South Korea participated in the study. However, 131 participants’ datasets were removed due to incompleteness or<br />
errors. The research team analyzed 183 usable responses for the utilization of Web 2.0 applications (59% of 3<strong>14</strong><br />
submitted responses). Of the 183 completed surveys, 75 of them were male (40.9%) and 77 were female (42.0%).<br />
The data consists of 18 (9.8%) freshmen, 45 (24.5%) sophomores, 50 (27.3%) juniors, 51 (27.8%) seniors, and <strong>14</strong><br />
(7.6%) graduates. The respondents also reported their academic majors. See Table 2 for the demographic and<br />
academic major data.<br />
Table 2. Descriptive statistics of the respondents (%)<br />
U.S South Korea Total<br />
Demographics<br />
(n=83) (n=100) (n=183)<br />
Sex<br />
Male 42(50.6%) 33(33%) 75(40.9%)<br />
Female 21(25.3%) 56(56%) 77(42.0%)<br />
No response<br />
Year<br />
20(24.0%) 11(11%) 31(16.9%)<br />
Freshman 17(20.4%) 1(1%) 18(9.8%)<br />
Sophomore 9(10.8%) 36(36%) 45(24.5%)<br />
Junior 10(12.0%) 40(40%) 50(27.3%)<br />
Senior 32(38.5%) 19(19%) 51(27.8%)<br />
Graduate 10(12.0%) 4(4%) <strong>14</strong>(7.6%)<br />
No response<br />
Major<br />
5(6%) N/A 5(2.7%)<br />
Business/Management 10(12.0%) 7(7%) 17(9.2%)<br />
Engineering/Computer Science 22(26.5%) 7(7%) 29(15.8%)<br />
Education 15(18.0%) 61(61%) 76(41.5%)<br />
Liberal Arts/Social Science 16(19.2%) 19(19%) 35(19.1%)<br />
Other 12(<strong>14</strong>.4%) 6(6%) 18(9.8%)<br />
No response 8(9.6%) N/A 8(4.3%)<br />
Descriptive statistical analysis<br />
The usage frequency of Web 2.0 applications from 183 participants was identified (see Table 3). There were 37%<br />
American students responded that they did not know what a blog is. On the contrary, 34% Korean students<br />
responded that they used blogs more than 7 times per week. Online video & audio conferencing tool and social<br />
virtual environments are mostly unfamiliar to participants. The data indicated that 52% of American students and<br />
48% of Korean students did not know what an online video & audio conferencing tool is. In addition, 78% of<br />
American and 66% of Korean respondents reported that they did not know what a social virtual environment is.<br />
245


