Schallenberger Elementary
Schallenberger Elementary
Schallenberger Elementary

Create successful ePaper yourself
Turn your PDF publications into a flip-book with our unique Google optimized e-Paper software.
<strong>Schallenberger</strong> <strong>Elementary</strong><br />
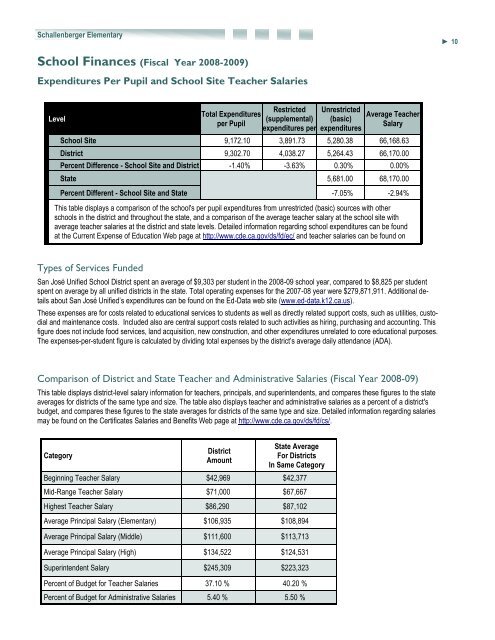
School Finances (Fiscal Year 2008-2009)<br />
Expenditures Per Pupil and School Site Teacher Salaries<br />
Level<br />
Types of Services Funded<br />
Total Expenditures<br />
per Pupil<br />
Restricted<br />
(supplemental)<br />
expenditures per<br />
Unrestricted<br />
(basic)<br />
expenditures<br />
Average Teacher<br />
Salary<br />
School Site 9,172.10 3,891.73 5,280.38 66,168.63<br />
District 9,302.70 4,038.27 5,264.43 66,170.00<br />
Percent Difference - School Site and District -1.40% -3.63% 0.30% 0.00%<br />
State<br />
5,681.00 68,170.00<br />
Percent Different - School Site and State -7.05% -2.94%<br />
This table displays a comparison of the school's per pupil expenditures from unrestricted (basic) sources with other<br />
schools in the district and throughout the state, and a comparison of the average teacher salary at the school site with<br />
average teacher salaries at the district and state levels. Detailed information regarding school expenditures can be found<br />
at the Current Expense of Education Web page at http://www.cde.ca.gov/ds/fd/ec/ and teacher salaries can be found on<br />
San José Unified School District spent an average of $9,303 per student in the 2008-09 school year, compared to $8,825 per student<br />
spent on average by all unified districts in the state. Total operating expenses for the 2007-08 year were $279,871,911. Additional details<br />
about San José Unified’s expenditures can be found on the Ed-Data web site (www.ed-data.k12.ca.us).<br />
These expenses are for costs related to educational services to students as well as directly related support costs, such as utilities, custodial<br />
and maintenance costs. Included also are central support costs related to such activities as hiring, purchasing and accounting. This<br />
figure does not include food services, land acquisition, new construction, and other expenditures unrelated to core educational purposes.<br />
The expenses-per-student figure is calculated by dividing total expenses by the district’s average daily attendance (ADA).<br />
Comparison of District and State Teacher and Administrative Salaries (Fiscal Year 2008-09)<br />
This table displays district-level salary information for teachers, principals, and superintendents, and compares these figures to the state<br />
averages for districts of the same type and size. The table also displays teacher and administrative salaries as a percent of a district's<br />
budget, and compares these figures to the state averages for districts of the same type and size. Detailed information regarding salaries<br />
may be found on the Certificates Salaries and Benefits Web page at http://www.cde.ca.gov/ds/fd/cs/.<br />
Category<br />
District<br />
Amount<br />
State Average<br />
For Districts<br />
In Same Category<br />
Beginning Teacher Salary $42,969 $42,377<br />
Mid-Range Teacher Salary $71,000 $67,667<br />
Highest Teacher Salary $86,290 $87,102<br />
Average Principal Salary (<strong>Elementary</strong>) $106,935 $108,894<br />
Average Principal Salary (Middle) $111,600 $113,713<br />
Average Principal Salary (High) $134,522 $124,531<br />
Superintendent Salary $245,309 $223,323<br />
Percent of Budget for Teacher Salaries 37.10 % 40.20 %<br />
Percent of Budget for Administrative Salaries 5.40 % 5.50 %<br />
► 10