Report on the National Senior Certificate Examination Results 2010.
Report on the National Senior Certificate Examination Results 2010.
Report on the National Senior Certificate Examination Results 2010.
Create successful ePaper yourself
Turn your PDF publications into a flip-book with our unique Google optimized e-Paper software.
REPORT ON THE NATIONAL SENIOR CERTIFICATE EXAMINATION RESULTS • 2010<br />
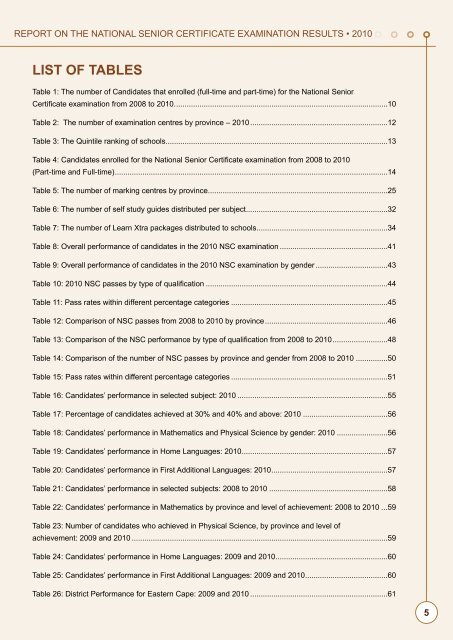
LIST OF TABLES<br />
Table 1: The number of Candidates that enrolled (full-time and part-time) for <strong>the</strong> Nati<strong>on</strong>al <strong>Senior</strong><br />
<strong>Certificate</strong> examinati<strong>on</strong> from 2008 to <strong>2010.</strong> . . . . . . . . . . . . . . . . . . . . . . . . . . . . . . . . . . . . . . . . . . . . . . . . . . . . . . . . . . . . . . . . . . . . . . . . . . . . . . . . . . . . . . . . . . . . . . . . . . . .10<br />
Table 2: The number of examinati<strong>on</strong> centres by province – 2010 . . . . . . . . . . . . . . . . . . . . . . . . . . . . . . . . . . . . . . . . . . . . . . . . . . . . . . . . . . . . . . . . .12<br />
Table 3: The Quintile ranking of schools. . . . . . . . . . . . . . . . . . . . . . . . . . . . . . . . . . . . . . . . . . . . . . . . . . . . . . . . . . . . . . . . . . . . . . . . . . . . . . . . . . . . . . . . . . . . . . . . . . . . . . . . .13<br />
Table 4: Candidates enrolled for <strong>the</strong> Nati<strong>on</strong>al <strong>Senior</strong> <strong>Certificate</strong> examinati<strong>on</strong> from 2008 to 2010<br />
(Part-time and Full-time) . . . . . . . . . . . . . . . . . . . . . . . . . . . . . . . . . . . . . . . . . . . . . . . . . . . . . . . . . . . . . . . . . . . . . . . . . . . . . . . . . . . . . . . . . . . . . . . . . . . . . . . . . . . . . . . . . . . . . . . . . . . . . . . . .14<br />
Table 5: The number of marking centres by province . . . . . . . . . . . . . . . . . . . . . . . . . . . . . . . . . . . . . . . . . . . . . . . . . . . . . . . . . . . . . . . . . . . . . . . . . . . . . . . . . . . . .25<br />
Table 6: The number of self study guides distributed per subject . . . . . . . . . . . . . . . . . . . . . . . . . . . . . . . . . . . . . . . . . . . . . . . . . . . . . . . . . . . . . . . . . . .32<br />
Table 7: The number of Learn Xtra packages distributed to schools . . . . . . . . . . . . . . . . . . . . . . . . . . . . . . . . . . . . . . . . . . . . . . . . . . . . . . . . . . . . . .34<br />
Table 8: Overall performance of candidates in <strong>the</strong> 2010 NSC examinati<strong>on</strong> . . . . . . . . . . . . . . . . . . . . . . . . . . . . . . . . . . . . . . . . . . . . . . . . . . .41<br />
Table 9: Overall performance of candidates in <strong>the</strong> 2010 NSC examinati<strong>on</strong> by gender . . . . . . . . . . . . . . . . . . . . . . . . . . . . . . . . . .43<br />
Table 10: 2010 NSC passes by type of qualificati<strong>on</strong> . . . . . . . . . . . . . . . . . . . . . . . . . . . . . . . . . . . . . . . . . . . . . . . . . . . . . . . . . . . . . . . . . . . . . . . . . . . . . . . . . . . . . .44<br />
Table 11: Pass rates within different percentage categories . . . . . . . . . . . . . . . . . . . . . . . . . . . . . . . . . . . . . . . . . . . . . . . . . . . . . . . . . . . . . . . . . . . . . . . . . .45<br />
Table 12: Comparis<strong>on</strong> of NSC passes from 2008 to 2010 by province . . . . . . . . . . . . . . . . . . . . . . . . . . . . . . . . . . . . . . . . . . . . . . . . . . . . . . . . . .46<br />
Table 13: Comparis<strong>on</strong> of <strong>the</strong> NSC performance by type of qualificati<strong>on</strong> from 2008 to 2010 . . . . . . . . . . . . . . . . . . . . . . . . . .48<br />
Table 14: Comparis<strong>on</strong> of <strong>the</strong> number of NSC passes by province and gender from 2008 to 2010 . . . . . . . . . . . . . . .50<br />
Table 15: Pass rates within different percentage categories . . . . . . . . . . . . . . . . . . . . . . . . . . . . . . . . . . . . . . . . . . . . . . . . . . . . . . . . . . . . . . . . . . . . . . . . . .51<br />
Table 16: Candidates’ performance in selected subject: 2010 . . . . . . . . . . . . . . . . . . . . . . . . . . . . . . . . . . . . . . . . . . . . . . . . . . . . . . . . . . . . . . . . . . . . . . .55<br />
Table 17: Percentage of candidates achieved at 30% and 40% and above: 2010 . . . . . . . . . . . . . . . . . . . . . . . . . . . . . . . . . . . . . . . .56<br />
Table 18: Candidates’ performance in Ma<strong>the</strong>matics and Physical Science by gender: 2010 . . . . . . . . . . . . . . . . . . . . . . . .56<br />
Table 19: Candidates’ performance in Home Languages: 2010 . . . . . . . . . . . . . . . . . . . . . . . . . . . . . . . . . . . . . . . . . . . . . . . . . . . . . . . . . . . . . . . . . . . . .57<br />
Table 20: Candidates’ performance in First Additi<strong>on</strong>al Languages: 2010 . . . . . . . . . . . . . . . . . . . . . . . . . . . . . . . . . . . . . . . . . . . . . . . . . . . . . . .57<br />
Table 21: Candidates’ performance in selected subjects: 2008 to 2010 . . . . . . . . . . . . . . . . . . . . . . . . . . . . . . . . . . . . . . . . . . . . . . . . . . . . . . . .58<br />
Table 22: Candidates’ performance in Ma<strong>the</strong>matics by province and level of achievement: 2008 to 2010 . . .59<br />
Table 23: Number of candidates who achieved in Physical Science, by province and level of<br />
achievement: 2009 and 2010 . . . . . . . . . . . . . . . . . . . . . . . . . . . . . . . . . . . . . . . . . . . . . . . . . . . . . . . . . . . . . . . . . . . . . . . . . . . . . . . . . . . . . . . . . . . . . . . . . . . . . . . . . . . . . . . . . . . . . . . . .59<br />
Table 24: Candidates’ performance in Home Languages: 2009 and 2010 . . . . . . . . . . . . . . . . . . . . . . . . . . . . . . . . . . . . . . . . . . . . . . . . . . . . .60<br />
Table 25: Candidates’ performance in First Additi<strong>on</strong>al Languages: 2009 and 2010 . . . . . . . . . . . . . . . . . . . . . . . . . . . . . . . . . . . . . . .60<br />
Table 26: District Performance for Eastern Cape: 2009 and 2010 . . . . . . . . . . . . . . . . . . . . . . . . . . . . . . . . . . . . . . . . . . . . . . . . . . . . . . . . . . . . . . . . .61<br />
5


