A fast, robust and tunable synthetic gene oscillator - The BioCircuits ...
A fast, robust and tunable synthetic gene oscillator - The BioCircuits ...
A fast, robust and tunable synthetic gene oscillator - The BioCircuits ...

Create successful ePaper yourself
Turn your PDF publications into a flip-book with our unique Google optimized e-Paper software.
doi: 10.1038/nature07389 SUPPLEMENTARY INFORMATION<br />
prewarmed. Between 2.5–4 h after initial dilution, aliquots of the growing culture were added<br />
to inducer tubes at regular intervals, resulting in a set of cultures with varying induction times.<br />
At the end of the experiment, all samples were quickly measured by flow cytometry (∼3 samples/min),<br />
starting with the lowest induction duration. <strong>The</strong> induction duration was calculated<br />
as the time between addition of culture to inducer <strong>and</strong> flow cytometry measurement, <strong>and</strong> the<br />
<strong>oscillator</strong>y period was calculated as the time between the first peak <strong>and</strong> the second peak of the<br />
mean fluorescence of the culture.<br />
This protocol allowed parallel examination of multiple inducer conditions more easily than<br />
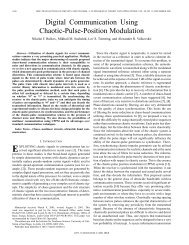
the continuous timecourse protocol. Amplitudes <strong>and</strong> oscillation periods increased along the<br />
arabinose transect at 2 mM IPTG as arabinose increased (Supplementary Fig. 9). At low levels<br />
of arabinose, mean fluorescence was low enough that following oscillations after the second<br />
peak became difficult. However, microscopy experiments at these arabinose levels confirmed<br />
that the cells were oscillating. <strong>The</strong> values seen along the IPTG transect at 0.7% arabinose were<br />
in good agreement with the period measurements obtained from single-cell trajectories (Fig. 2a),<br />
although measurements derived from single-cell trajectories were consistently higher. This could<br />
be due to an unexplained difference in the growth environment (although doubling times were<br />
consistent across the two methods), or it could be related to the gradual increase in period seen<br />
in the microscopy experiments (Supplementary Fig. 4). Extension of the IPTG transect to IPTG<br />
levels higher than those examined by microscopy resulted in oscillations with low amplitudes<br />
<strong>and</strong> short periods, confirming the decrease in period seen in the microscopy experiments.<br />
Avg FL (AU)<br />
500<br />
400<br />
300<br />
200<br />
100<br />
0<br />
0 30 60 90 120<br />
Time after induction (min)<br />
Supplementary Figure 9: Oscillations in mean fluorescence over time on a transect along 2 mM IPTG.<br />
Fluorescence was measured by flow cytometry of samples induced with various levels of arabinose (blue,<br />
0.2% arabinose; green, 0.3%; orange, 0.7%; red, 2%) <strong>and</strong> 2 mM IPTG <strong>and</strong> grown for a range of durations,<br />
<strong>and</strong> smoothed by a Savitsky-Golay filter. (Flow cytometry data for the 2% arabinose sample are shown in<br />
Supplementary Figs. 14–15.)<br />
Hybrid promoter induction curves were determined using MG1655Z1 cells (Lutz <strong>and</strong> Bujard<br />
1997) transformed with a plasmid that contained yemGFP-ssrA under the control of the p lac/ara-1<br />
hybrid promoter (essentially pJS167 without the activator module). MG1655Z1 constitutively<br />
produces LacI, which is necessary to support IPTG-mediated release of repression given the large<br />
number of lacO sites on multiple-copy plasmids. AraC is produced from the wildtype genomic<br />
locus. <strong>The</strong>se cells have neither feedback loop from the dual-feedback <strong>oscillator</strong>. An overnight<br />
www.nature.com/nature<br />
13