A fast, robust and tunable synthetic gene oscillator - The BioCircuits ...
A fast, robust and tunable synthetic gene oscillator - The BioCircuits ...
A fast, robust and tunable synthetic gene oscillator - The BioCircuits ...

You also want an ePaper? Increase the reach of your titles
YUMPU automatically turns print PDFs into web optimized ePapers that Google loves.
LETTERS<br />
A <strong>fast</strong>, <strong>robust</strong> <strong>and</strong> <strong>tunable</strong> <strong>synthetic</strong> <strong>gene</strong> <strong>oscillator</strong><br />
Jesse Stricker 1 *, Scott Cookson 1 *, Matthew R. Bennett 1,2 *, William H. Mather 1 , Lev S. Tsimring 2 & Jeff Hasty 1,2<br />
One defining goal of <strong>synthetic</strong> biology is the development of<br />
engineering-based approaches that enable the construction of<br />
<strong>gene</strong>-regulatory networks according to ‘design specifications’<br />
<strong>gene</strong>rated from computational modelling 1–6 . This approach provides<br />
a systematic framework for exploring how a given regulatory<br />
network <strong>gene</strong>rates a particular phenotypic behaviour. Several fundamental<br />
<strong>gene</strong> circuits have been developed using this approach,<br />
including toggle switches 7 <strong>and</strong> <strong>oscillator</strong>s 8–10 , <strong>and</strong> these have been<br />
applied in new contexts such as triggered biofilm development 11<br />
<strong>and</strong> cellular population control 12 . Here we describe an engineered<br />
<strong>gene</strong>tic <strong>oscillator</strong> in Escherichia coli that is <strong>fast</strong>, <strong>robust</strong> <strong>and</strong> persistent,<br />
with <strong>tunable</strong> <strong>oscillator</strong>y periods as <strong>fast</strong> as 13 min. <strong>The</strong><br />
<strong>oscillator</strong> was designed using a previously modelled network<br />
architecture comprising linked positive <strong>and</strong> negative feedback<br />
loops 1,13 . Using a microfluidic platform tailored for single-cell<br />
microscopy, we precisely control environmental conditions <strong>and</strong><br />
monitor oscillations in individual cells through multiple cycles.<br />
Experiments reveal remarkable <strong>robust</strong>ness <strong>and</strong> persistence of<br />
oscillations in the designed circuit; almost every cell exhibited<br />
large-amplitude fluorescence oscillations throughout observation<br />
runs. <strong>The</strong> <strong>oscillator</strong>y period can be tuned by altering inducer<br />
levels, temperature <strong>and</strong> the media source. Computational modelling<br />
demonstrates that the key design principle for constructing a<br />
<strong>robust</strong> <strong>oscillator</strong> is a time delay in the negative feedback loop,<br />
which can mechanistically arise from the cascade of cellular processes<br />
involved in forming a functional transcription factor. <strong>The</strong><br />
positive feedback loop increases the <strong>robust</strong>ness of the oscillations<br />
<strong>and</strong> allows for greater tunability. Examination of our refined<br />
model suggested the existence of a simplified <strong>oscillator</strong> design<br />
without positive feedback, <strong>and</strong> we construct an <strong>oscillator</strong> strain<br />
confirming this computational prediction.<br />
<strong>The</strong> <strong>synthetic</strong> <strong>gene</strong> <strong>oscillator</strong> is based on a previously reported<br />
theoretical design 1 <strong>and</strong> was constructed using E. coli components<br />
(Fig. 1a). <strong>The</strong> hybrid promoter (plac/ara-1; ref. 14) is composed of<br />
the activation operator site from the araBAD promoter placed in<br />
its normal location relative to the transcription start site, <strong>and</strong> repression<br />
operator sites from the lacZYA promoter placed both upstream<br />
<strong>and</strong> immediately downstream of the transcription start site. It is<br />
activated by the AraC protein in the presence of arabinose <strong>and</strong><br />
repressed by the LacI protein in the absence of isopropyl b-D-1-thiogalactopyranoside<br />
(IPTG). We placed the araC, lacI <strong>and</strong> yemGFP<br />
(monomeric yeast-enhanced green fluorescent protein) <strong>gene</strong>s under<br />
the control of three identical copies of plac/ara-1 to form three coregulated<br />
transcription modules (Supplementary Information).<br />
Hence, activation of the promoters by the addition of arabinose<br />
<strong>and</strong> IPTG to the medium results in transcription of each<br />
component of the circuit, <strong>and</strong> increased production of AraC in the<br />
presence of arabinose results in a positive feedback loop that<br />
increases promoter activity. However, the concurrent increase in<br />
production of LacI results in a linked negative feedback loop that<br />
decreases promoter activity, <strong>and</strong> the differential activity of the two<br />
feedback loops can drive <strong>oscillator</strong>y behaviour 1,13 .<br />
<strong>The</strong> <strong>oscillator</strong> cells (denoted JS011) exhibited ubiquitous fluorescence<br />
oscillations over the entire run time of each experiment (at<br />
least 4 h). For example, at 0.7% arabinose <strong>and</strong> 2 mM IPTG, more<br />
1 2<br />
Department of Bioengineering, University of California, San Diego, La Jolla, California 92093, USA. Institute for Nonlinear Science, University of California, San Diego, La Jolla,<br />
California 92093, USA.<br />
*<strong>The</strong>se authors contributed equally to this work.<br />
516<br />
a<br />
c<br />
e<br />
g<br />
+ Arabinose<br />
araC<br />
− IPTG<br />
lacI<br />
yemGFP<br />
0 60 120 180<br />
0 60 120 180<br />
©2008 Macmillan Publishers Limited. All rights reserved<br />
Vol 456 | 27 November 2008 |doi:10.1038/nature07389<br />
b<br />
Fluorescence (a.u.)<br />
d<br />
h<br />
12<br />
8<br />
4<br />
0<br />
0 60 120 180<br />
Time (min)<br />
0 60 120 180 0<br />
Time (min)<br />
60 120 180<br />
f<br />
0 60 120 180<br />
0 60 120 180<br />
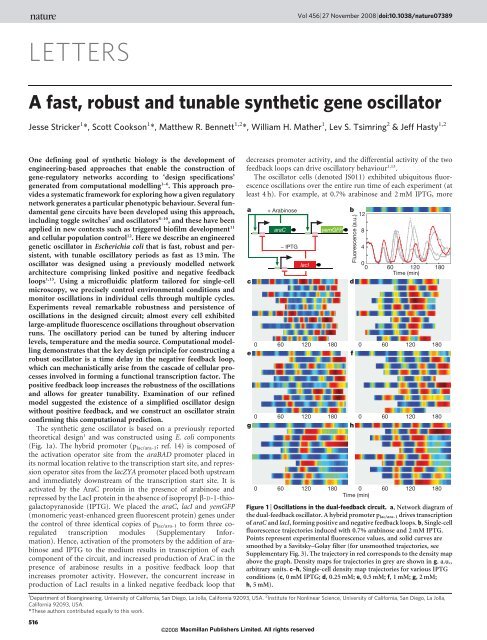
Figure 1 | Oscillations in the dual-feedback circuit. a, Network diagram of<br />
the dual-feedback <strong>oscillator</strong>. A hybrid promoter plac/ara-1 drives transcription<br />
of araC <strong>and</strong> lacI, forming positive <strong>and</strong> negative feedback loops. b, Single-cell<br />
fluorescence trajectories induced with 0.7% arabinose <strong>and</strong> 2 mM IPTG.<br />
Points represent experimental fluorescence values, <strong>and</strong> solid curves are<br />
smoothed by a Savitsky–Golay filter (for unsmoothed trajectories, see<br />
Supplementary Fig. 3). <strong>The</strong> trajectory in red corresponds to the density map<br />
above the graph. Density maps for trajectories in grey are shown in g. a.u.,<br />
arbitrary units. c–h, Single-cell density map trajectories for various IPTG<br />
conditions (c, 0 mM IPTG; d, 0.25 mM; e, 0.5 mM; f, 1 mM; g, 2 mM;<br />
h, 5 mM).
NATURE | Vol 456 |27 November 2008 LETTERS<br />
than 99% of the cells showed oscillations with a period of approximately<br />
40 min (Fig. 1b, g, Supplementary Table 1 <strong>and</strong> Supplementary<br />
Movie 1). <strong>The</strong> highly dynamic nature of the <strong>oscillator</strong> components is<br />
shown by the rapid decay of green fluorescent protein (GFP) signal,<br />
which drops from peak to trough in less than 10 min (Fig. 1b). <strong>The</strong><br />
<strong>oscillator</strong>y phase was heritable between daughter cells, which resulted<br />
in synchronized oscillations in areas of the microcolony derived from<br />
a common cell. This synchrony was limited to a few periods, presumably<br />
owing to <strong>oscillator</strong>y phase diffusion. We used a microfluidic<br />
device with a laminar boundary switch upstream of the growth<br />
chamber to investigate the initiation of synchronized oscillations<br />
(Supplementary Fig. 2c, d). Cells grown in the absence of inducer<br />
initiated oscillations in a synchronous manner on the addition of<br />
inducer (Supplementary Movie 10), which suggested the possibility<br />
of using flow cytometry to characterize the <strong>oscillator</strong> further. Flow<br />
cytometry of samples continuously collected from a culture in logarithmic<br />
growth that had been induced with 0.7% arabinose <strong>and</strong><br />
2 mM IPTG showed oscillations in mean cell fluorescence<br />
(Supplementary Fig. 8). Induction of oscillation was very quick (less<br />
than 5 min) <strong>and</strong> initially well-synchronized. <strong>The</strong> amplitude of these<br />
bulk oscillations decayed as the experiment progressed, as expected<br />
from the desynchronization of individual cells in the colony<br />
(Supplementary Information). However, the period obtained from<br />
the flow cytometry method (green data points in all figures) compared<br />
favourably to that obtained from single cells using microscopy<br />
(red data points in all figures).<br />
<strong>The</strong> <strong>oscillator</strong> was extremely <strong>robust</strong> over an extensive range of<br />
inducer conditions <strong>and</strong> temperatures. At 0.7% arabinose <strong>and</strong> 37 uC,<br />
almost every observed cell oscillated (Supplementary Table 1) at all<br />
IPTG concentrations examined (Fig. 1b–h <strong>and</strong> Supplementary<br />
Movies 1–8). Varying the IPTG concentration allowed for the tuning<br />
of the <strong>oscillator</strong> period (Fig. 2a), particularly at low IPTG concentrations.<br />
<strong>The</strong> period decreased at high IPTG concentrations, <strong>and</strong> subsequent<br />
characterization of the promoter revealed that this nonmonotonic<br />
behaviour is probably caused by IPTG interference with<br />
AraC activation 15 (Supplementary Information). <strong>The</strong> cell doubling<br />
time on the microfluidic device remained largely steady between<br />
experiments, ranging from 22.3 min to 27.6 min at 37 uC <strong>and</strong> showing<br />
little correlation to IPTG concentration (R 2 5 0.132). Individual cell<br />
fluorescence trajectories showed a gradual increase in <strong>oscillator</strong>y<br />
Oscillatory period (min)<br />
60<br />
a<br />
37 °C (G = 22–24 min)<br />
0.7% arabinose<br />
Oscillatory period (min)<br />
60<br />
b<br />
37 °C (G = 22–24 min)<br />
0<br />
0 10 20<br />
IPTG (mM)<br />
30<br />
0<br />
0<br />
2 mM IPTG<br />
1 2<br />
Arabinose (%)<br />
3<br />
120<br />
c<br />
120<br />
d<br />
0.7% arabinose<br />
0.7% arabinose<br />
0<br />
20<br />
2 mM IPTG<br />
30<br />
Temperature (°C)<br />
40<br />
0<br />
0<br />
2 mM IPTG<br />
60<br />
120<br />
Cell doubling period (min)<br />
Figure 2 | Robust oscillations. a–c, Oscillatory periods on transects with<br />
0.7% arabinose <strong>and</strong> varying IPTG (a), 2 mM IPTG <strong>and</strong> varying arabinose<br />
(b), or 0.7% arabinose, 2 mM IPTG, <strong>and</strong> varying temperature (c). Mean<br />
periods from single-cell microscopy (red diamonds, mean 6 s.d.) or flow<br />
cytometry (green circles) are shown. Black curves are trend lines in a <strong>and</strong><br />
b, or represent the theoretical prediction based on reference values at 30 uC<br />
in c (see Supplementary Information). Samples grown in minimal medium<br />
rather than LB are indicated by crosses. G represents the cell doubling<br />
period. d, Oscillatory period <strong>and</strong> cell division time increase monotonically as<br />
the growth temperature decreases. Symbols are as described above, <strong>and</strong> the<br />
black line is a linear regression of samples grown in LB.<br />
©2008 Macmillan Publishers Limited. All rights reserved<br />
period as the cells were imaged on the microfluidic device (Supplementary<br />
Fig. 4). This increase was not seen in doubling times, implying<br />
that the cells were not experiencing nutritional difficulties<br />
or environmental stress that might cause an alteration in <strong>oscillator</strong><br />
behaviour.<br />
To explore further the <strong>robust</strong>ness of the <strong>oscillator</strong>, we investigated<br />
the effect of varying arabinose, temperature <strong>and</strong> the media source. At a<br />
fixed value of 2 mM IPTG <strong>and</strong> at 37 uC, the <strong>oscillator</strong>y period can be<br />
tuned from 13 min to 58 min by varying the arabinose level from 0.1%<br />
to 3.0% (Fig. 2b). Cells grown in the absence of arabinose did not<br />
express measurable levels of GFP in single-cell microscopy or flow<br />
cytometry experiments, <strong>and</strong> high levels of arabinose seemed to saturate<br />
the system. We observed sustained oscillations at a range of temperatures<br />
from 25 uC to37uC, with a decreasing period as a function of<br />
temperature (Fig. 2c). <strong>The</strong> cell doubling time also decreased with<br />
temperature, as expected, <strong>and</strong> the <strong>oscillator</strong>y period increased monotonically<br />
with cell doubling time (Fig. 2d). <strong>The</strong> <strong>oscillator</strong> also functioned<br />
in minimal A medium with 2 g l 21 glucose (Fig. 2c, d).<br />
Although the cell doubling time in minimal medium was significantly<br />
longer than in LB-Miller formulation lysogeny broth (LB) (80–90 min<br />
versus 22–24 min at 37 uC), the period in the minimal medium was<br />
very similar to that in LB (Fig. 2c, d). This result, together with the<br />
strong dependence of the period on IPTG <strong>and</strong> arabinose concentration<br />
(at constant cellular doubling times), demonstrates that the <strong>synthetic</strong><br />
<strong>oscillator</strong> is not strongly coupled to the cell cycle. <strong>The</strong> similar dependence<br />
of the period <strong>and</strong> the doubling time on the temperature seems to<br />
be due to the thermodynamic change of the rate constants affecting all<br />
cellular processes.<br />
<strong>The</strong> <strong>oscillator</strong> was constructed according to design principles determined<br />
from previous theoretical work 1 . However, we found that this<br />
original model failed to describe two important aspects of the experiments.<br />
First, the model could not describe the observed functional<br />
dependence of the period on inducer levels. Second, <strong>and</strong> perhaps most<br />
importantly, because careful parameter tuning was necessary for<br />
oscillations in the original model, it was not able to describe the <strong>robust</strong><br />
behaviour demonstrated in the experiments. This suggests that only a<br />
small region of inducer space should support oscillations, in contrast<br />
to the <strong>robust</strong> behaviour demonstrated in the experiments. <strong>The</strong>se<br />
shortcomings forced a re-evaluation of the derivation of the <strong>oscillator</strong><br />
equations, <strong>and</strong> led to a new computational model that more<br />
accurately described the experimental observations. <strong>The</strong> new model<br />
incorporates the same coupled positive <strong>and</strong> negative feedback architecture,<br />
but includes details that were omitted from the previous<br />
model. In particular, we found that directly modelling processes such<br />
as protein–DNA binding, multimerization, translation, DNA looping,<br />
enzymatic degradation <strong>and</strong> protein folding greatly increased the<br />
accuracy of the model. <strong>The</strong> result is a computational model that is very<br />
<strong>robust</strong> to parameter variations <strong>and</strong> correctly describes the dynamics<br />
of the <strong>oscillator</strong> for a large range of IPTG <strong>and</strong> arabinose concentrations<br />
(see Box 1 <strong>and</strong> Supplementary Information).<br />
In examining our refined model, we discovered another region in<br />
parameter space that would support <strong>oscillator</strong>y behaviour. Our<br />
model predicted that a constantly activated system with repression<br />
controlled by a negative feedback loop could produce oscillations in<br />
the absence of positive feedback (Supplementary Fig. 19). It has been<br />
proposed that negative feedback <strong>gene</strong> networks can oscillate as long<br />
as there is delay in the feedback 16,17 , <strong>and</strong>, although there is no explicit<br />
delay in our model, the intermediate steps of translation, protein<br />
folding <strong>and</strong> multimerization of LacI provide an effective form of<br />
delay 18 that is sufficient to support oscillations. We constructed this<br />
system (denoted JS013) in E. coli using a hybrid promoter, pLlacO-1<br />
(ref. 14), that is activated in the absence of LacI (or presence of IPTG)<br />
to drive both lacI <strong>and</strong> yemGFP expression (Fig. 3a). We observed<br />
oscillations in these cells when examined by single-cell microscopy<br />
under inducing conditions (Fig. 3b, Supplementary Fig. 5 <strong>and</strong><br />
Supplementary Movie 11). <strong>The</strong>se oscillations were not as distinct<br />
or regular as in the dual-feedback <strong>oscillator</strong>, <strong>and</strong> they did not always<br />
517
LETTERS NATURE | Vol 456 | 27 November 2008<br />
Box 1 | Dynamic modelling of the dual-feedback <strong>oscillator</strong> circuit<br />
We used st<strong>and</strong>ard techniques to construct both stochastic <strong>and</strong><br />
deterministic computational models 3,25–28 based on the same<br />
underlying biochemical reactions illustrated in Fig. 4a (see<br />
Supplementary Information for full details of modelling). Although the<br />
interaction between transcription factors <strong>and</strong> the DNA is <strong>gene</strong>rally<br />
quite complicated to model in detail 29 , we used experimental induction<br />
curves to calibrate the induction levels in the reactions describing the<br />
network (Supplementary Fig. 10). Over many <strong>oscillator</strong>y cycles, the<br />
deterministic simulations were then shown to give accurately the<br />
temporal evolution of the mode of the distributions <strong>gene</strong>rated by the<br />
exact stochastic simulations 24 . Representative time series for the<br />
protein concentrations obtained from the stochastic <strong>and</strong> deterministic<br />
models are depicted in Fig. 4b, c. <strong>The</strong> models are very <strong>robust</strong> in that<br />
<strong>oscillator</strong>y behaviour exists for a large range of parameter values <strong>and</strong><br />
network details (Supplementary Information). Importantly, we found<br />
excellent quantitative agreement with the experimentally obtained<br />
period as a function of inducer levels (Fig. 4d, e).<br />
<strong>The</strong> amplitude <strong>and</strong> period of the oscillations as a function of inducer<br />
levels can be conceptually explained using Fig. 4c. A burst begins with<br />
the basal transcription of messenger RNA from both promoters,<br />
encoding both the activator <strong>and</strong> the repressor. After a short delay<br />
(caused by, for example, translation, protein folding <strong>and</strong><br />
multimerization), the amount of functional activator rises quicker than<br />
the amount of functional repressor, as shown in Fig. 4b. This occurs for<br />
two reasons. First, the activator <strong>gene</strong> is on a higher copy number<br />
plasmid than the repressor <strong>gene</strong>, meaning that more activator<br />
transcripts are produced than repressor transcripts. Second, assuming<br />
that transcription <strong>and</strong> translation of the monomeric forms of both<br />
proteins occur at similar rates, the activator will be more abundant<br />
because the functional tetrameric form of LacI requires twice as many<br />
monomers as does the functional dimeric form of AraC. As AraC levels<br />
rise, an activation burst in production of mRNA occurs due to the<br />
positive feedback loop. After LacI has been converted to a sufficient<br />
number of tetramers, the production of mRNA is turned off <strong>and</strong> the<br />
proteins decay enzymatically. Once all proteins have decayed, the<br />
promoters are freed of all bound regulators <strong>and</strong> the cycle begins anew.<br />
<strong>The</strong> length of the period is primarily determined by the time required<br />
for the proteins to decay. <strong>The</strong>refore, the period is dependent on the rate<br />
of enzymatic decay <strong>and</strong> the magnitude of the activation burst.<br />
Furthermore, because the burst size depends on the induction<br />
characteristics of the promoter, it follows that the period is roughly<br />
proportional to the induction level of the promoter.<br />
return to a dim state, consistent with the predictions of the computational<br />
model. Furthermore, the period was largely unaffected by<br />
IPTG concentration (varying less than 5% over three experimental<br />
runs from 0.6 mM to 20 mM IPTG), suggesting that the addition of<br />
the positive feedback loop serves the dual role of regularizing oscillations<br />
<strong>and</strong> allowing tunability of the period (see Supplementary<br />
Information).<br />
In the context of <strong>synthetic</strong> biology, our findings indicate that caution<br />
must be exercised when making simplifying assumptions in the<br />
a b<br />
p LlacO-1<br />
p LlacO-1<br />
lacI<br />
− IPTG<br />
yemGFP<br />
0 60 120<br />
Time (min)<br />
180<br />
Figure 3 | An <strong>oscillator</strong> with no positive feedback loop. a, Network diagram<br />
of the negative feedback <strong>oscillator</strong>. This <strong>oscillator</strong> is similar to the dualfeedback<br />
<strong>oscillator</strong> except that the hybrid promoter p LlacO-1 (ref. 14) gives<br />
expression of lacI <strong>and</strong> yemGFP in the absence of LacI or in the presence of<br />
IPTG without requiring an activator. b, Single-cell density map trajectories<br />
for cells containing this <strong>oscillator</strong> (see Supplementary Movie 11 <strong>and</strong><br />
Supplementary Fig. 5).<br />
518<br />
a<br />
b<br />
Molecules<br />
(×1,000)<br />
0<br />
0 80<br />
Time (min)<br />
160<br />
0<br />
0 30<br />
Time (min)<br />
60<br />
d 50<br />
e<br />
60<br />
Period (min)<br />
12<br />
6<br />
30<br />
10<br />
0<br />
lacI<br />
araC<br />
10 20<br />
IPTG (mM)<br />
©2008 Macmillan Publishers Limited. All rights reserved<br />
mRNA<br />
Unfolded<br />
protein<br />
Folded LacI<br />
monomer<br />
mRNA<br />
Unfolded Folded<br />
protein AraC<br />
monomer<br />
design of engineered <strong>gene</strong> circuits. We found that a full model of the<br />
system that takes into account intermediate steps such as multimerization,<br />
translation, protein folding <strong>and</strong> DNA looping is essential. <strong>The</strong><br />
reason for this lies not only in the timescales of the system but also in<br />
the sequential timing of events. Because the intermediate steps in the<br />
production of functional protein take time, their introduction into the<br />
model creates an important form of delay 18–20 . We found that this<br />
effective delay greatly increases the <strong>robust</strong>ness of our model. For<br />
instance, <strong>oscillator</strong>y activity in the model is only somewhat sensitive<br />
to the values chosen for system parameters (Supplementary<br />
Information), implying that nearly all cells should oscillate<br />
(Supplementary Table 1) despite minor stochastic variations in their<br />
intrinsic parameters. This determination of <strong>gene</strong> circuit design criteria<br />
in the present context of a <strong>fast</strong>, <strong>robust</strong> <strong>and</strong> <strong>tunable</strong> <strong>oscillator</strong> sets the<br />
stage for the design of applications such as expression schemes that are<br />
capable of circumventing cellular adaptability, centralized clocks that<br />
coordinate intracellular behaviour, <strong>and</strong> reverse-engineering platforms<br />
21 that measure the global response of the genome to an <strong>oscillator</strong>y<br />
perturbation.<br />
METHODS SUMMARY<br />
<strong>The</strong> dual-feedback <strong>oscillator</strong> circuit was constructed by placing araC, lacI <strong>and</strong><br />
yemGFP under the control of the hybrid plac/ara-1 promoter 14 in three separate<br />
transcriptional cassettes. An ssrA degradation tag 22 was added to each <strong>gene</strong> to<br />
decrease protein lifetime <strong>and</strong> to increase temporal resolution. <strong>The</strong>se transcriptional<br />
cassettes were placed on two modular plasmids 14 <strong>and</strong> co-transformed into<br />
an DaraC DlacI E. coli strain. <strong>The</strong> negative feedback <strong>oscillator</strong> circuit was constructed<br />
by placing ssrA-tagged lacI <strong>and</strong> yemGFP under the control of the pLlacO-1<br />
promoter 14 in two separate transcriptional cassettes, which were incorporated<br />
onto two modular plasmids <strong>and</strong> co-transformed into a DlacI strain. Cells were<br />
c<br />
Normalized<br />
concentration<br />
Period (min)<br />
1.0<br />
0.5<br />
LacI dimer<br />
AraC dimer<br />
LacI<br />
tetramer<br />
10<br />
30 0 1 2 3<br />
Arabinose (%)<br />
Figure 4 | Modelling the <strong>gene</strong>tic <strong>oscillator</strong>. a, Intermediate processes are<br />
explicitly modelled in the refined <strong>oscillator</strong> model. b, c, Simulation results<br />
from Gillespie simulations (b) or deterministic modelling (c) at 0.7%<br />
arabinose <strong>and</strong> 2 mM IPTG. AraC dimers (green), LacI tetramers (red) <strong>and</strong><br />
lacI mRNA (black) are shown. d, e, Comparison of modelling <strong>and</strong><br />
experiment for oscillation period at 0.7% arabinose (d) or 2 mM IPTG<br />
(e). Values from deterministic modelling (blue curve), stochastic<br />
simulations (grey symbols, Supplementary Fig. 18), <strong>and</strong> microscopy (red<br />
diamonds) or flow cytometry (green circles) are shown. Lower <strong>and</strong> upper<br />
error bars in d represent the 16th <strong>and</strong> 84th percentiles, respectively, of the<br />
stochastic data, corresponding to 61 s.d. for a normal distribution.
NATURE | Vol 456 |27 November 2008 LETTERS<br />
grown either in LB medium or in minimal A medium with 2 g l 21 glucose.<br />
Oscillations were induced using arabinose (0.1–3%) <strong>and</strong> IPTG (0–30 mM).<br />
Single-cell microscopic data were collected by loading induced cells into<br />
polydimethylsiloxane-based microfluidic platforms that constrained the cells<br />
to a monolayer while supplying them with nutrients 23 , <strong>and</strong> then providing a<br />
constant source of medium <strong>and</strong> inducers <strong>and</strong> imaging GFP fluorescence every<br />
2–3 min for at least 4–6 h. <strong>The</strong>se data were further analysed using ImageJ <strong>and</strong><br />
custom-written Matlab scripts to extract single-cell fluorescence trajectories.<br />
Flow cytometry was performed either by taking samples from a continuously<br />
grown <strong>and</strong> serially diluted culture or by growing multiple cultures in parallel for<br />
varying durations. In either case, samples were read directly from their growth<br />
medium <strong>and</strong> low-scatter noise was removed by thresholding. Flow cytometry<br />
<strong>oscillator</strong>y periods were defined as the time elapsed between the first <strong>and</strong> second<br />
fluorescence peaks. Details of the models discussed are presented in<br />
Supplementary Information. Stochastic simulations were performed using<br />
Gillespie’s algorithm 24 , <strong>and</strong> deterministic simulations were performed using<br />
custom Matlab scripts.<br />
Full Methods <strong>and</strong> any associated references are available in the online version of<br />
the paper at www.nature.com/nature.<br />
Received 9 July; accepted 5 September 2008.<br />
Published online 29 October 2008.<br />
1. Hasty, J., Dolnik, M., Rottschäfer, V. & Collins, J. J. Synthetic <strong>gene</strong> network for<br />
entraining <strong>and</strong> amplifying cellular oscillations. Phys. Rev. Lett. 88, 148101 (2002).<br />
2. Hasty, J., McMillen, D. & Collins, J. J. Engineered <strong>gene</strong> circuits. Nature 420,<br />
224–230 (2002).<br />
3. Tyson, J., Chen, K. & Novak, B. Sniffers, buzzers, toggles <strong>and</strong> blinkers: dynamics of<br />
regulatory <strong>and</strong> signaling pathways in the cell. Curr. Opin. Cell Biol. 15, 221–231 (2003).<br />
4. Sprinzak, D. & Elowitz, M. B. Reconstruction of <strong>gene</strong>tic circuits. Nature 438,<br />
443–448 (2005).<br />
5. Endy, D. Foundations for engineering biology. Nature 438, 449–453 (2005).<br />
6. Andriananto<strong>and</strong>ro, E., Basu, S., Karig, D. K. & Weiss, R. Synthetic biology: new<br />
engineering rules for an emerging discipline. Mol. Syst. Biol. 2, 2006.0028 (2006).<br />
7. Gardner, T. S., Cantor, C. R. & Collins, J. J. Construction of a <strong>gene</strong>tic toggle switch<br />
in Escherichia coli. Nature 403, 339–342 (2000).<br />
8. Elowitz, M. B. & Leibler, S. A <strong>synthetic</strong> <strong>oscillator</strong>y network of transcriptional<br />
regulators. Nature 403, 335–338 (2000).<br />
9. Atkinson, M. R., Savageau, M. A., Myers, J. T. & Ninfa, A. J. Development of<br />
<strong>gene</strong>tic circuitry exhibiting toggle switch or <strong>oscillator</strong>y behavior in Escherichia coli.<br />
Cell 113, 597–607 (2003).<br />
10. Fung, E. et al. A <strong>synthetic</strong> <strong>gene</strong>-metabolic <strong>oscillator</strong>. Nature 435, 118–122 (2005).<br />
11. Kobayashi, H. et al. Programmable cells: interfacing natural <strong>and</strong> engineered <strong>gene</strong><br />
networks. Proc. Natl Acad. Sci. USA 101, 8414–8419 (2004).<br />
12. You, L., Cox, R. S., Weiss, R. & Arnold, F. H. Programmed population control by<br />
cell-cell communication <strong>and</strong> regulated killing. Nature 428, 868–871 (2004).<br />
13. Barkai, N. & Leiber, S. Circadian clocks limited by noise. Nature 403, 267–268<br />
(2000).<br />
14. Lutz, R. & Bujard, H. Independent <strong>and</strong> tight regulation of transcriptional units in<br />
Escherichia coli via the LacR/O, the TetR/O <strong>and</strong> AraC/I 1-I 2 regulatory elements.<br />
Nucleic Acids Res. 25, 1203–1210 (1997).<br />
©2008 Macmillan Publishers Limited. All rights reserved<br />
15. Lee, S. K. et al. Directed evolution of AraC for improved compatibility of arabinose<strong>and</strong><br />
lactose-inducible promoters. Appl. Environ. Microbiol. 73, 5711–5715 (2007).<br />
16. Bliss, R. D., Painter, P. R. & Marr, A. G. Role of feedback inhibition in stabilizing the<br />
classical operon. J. <strong>The</strong>or. Biol. 97, 177–193 (1982).<br />
17. Bratsun, D., Volfson, D., Tsimring, L. S. & Hasty, J. Delay-induced stochastic<br />
oscillations in <strong>gene</strong> regulation. Proc. Natl Acad. Sci. USA 102, 14593–14598<br />
(2005).<br />
18. Rateitschak, K. & Wolkenhauer, O. Intracellular delay limits cyclic changes in <strong>gene</strong><br />
expression. Math. Biosci. 205, 163–179 (2007).<br />
19. Mackey, M. & Glass, L. Oscillation <strong>and</strong> chaos in physiological control systems.<br />
Science 197, 287–289 (1977).<br />
20. Jaeger, J. & Reinitz, J. On the dynamic nature of positional information. Bioessays<br />
28, 1102–1111 (2006).<br />
21. Faith, J. et al. Large-scale mapping <strong>and</strong> validation of Escherichia coli transcriptional<br />
regulation from a compendium of expression profiles. PLoS Biol. 5, e8 (2007).<br />
22. Andersen, J. B. et al. New unstable variants of green fluorescent protein for studies<br />
of transient <strong>gene</strong> expression in bacteria. Appl. Environ. Microbiol. 64, 2240–2246<br />
(1998).<br />
23. Cookson, S., Ostroff, N., Pang, W. L., Volfson, D. & Hasty, J. Monitoring dynamics<br />
of single-cell <strong>gene</strong> expression over multiple cell cycles. Mol. Syst. Biol. 1,<br />
2005.0024 (2005).<br />
24. Gillespie, D. T. Exact stochastic simulation of coupled chemical-reactions. J. Phys.<br />
Chem. 81, 2340–2361 (1977).<br />
25. Hasty, J. et al. Computational studies of <strong>gene</strong> regulatory networks: in numero<br />
molecular biology. Nature Rev. Genet. 2, 268–279 (2001).<br />
26. Ozbudak, E., Thattai, M., Lim, H., Shraiman, B. & van Oudenaarden, A.<br />
Multistability in the lactose utilization network of Escherichia coli. Nature 427,<br />
737–740 (2004).<br />
27. Wang, X., Hao, N., Dohlman, H. & Elston, T. Bistability, stochasticity, <strong>and</strong><br />
oscillations in the mitogen-activated protein kinase cascade. Biophys. J. 90,<br />
1961–1978 (2006).<br />
28. Bennett, M. et al. Metabolic <strong>gene</strong> regulation in a dynamically changing<br />
environment. Nature 454, 1119–1122 (2008).<br />
29. Gerl<strong>and</strong>, U., Moroz, J. & Hwa, T. Physical constraints <strong>and</strong> functional<br />
characteristics of transcription factor-DNA interaction. Proc. Natl Acad. Sci. USA<br />
99, 12015–12020 (2002).<br />
Supplementary Information is linked to the online version of the paper at<br />
www.nature.com/nature.<br />
Acknowledgements We thank H. Bujard, C. Yang, <strong>and</strong> Z. Zhang for gifts of<br />
reagents, <strong>and</strong> D. Volfson <strong>and</strong> M. Simpson for discussions. This work was supported<br />
by grants from the National Institutes of Health (GM69811-01) <strong>and</strong> the US<br />
Department of Defense.<br />
Author Contributions J.S. <strong>and</strong> J.H. designed the <strong>oscillator</strong> circuits, <strong>and</strong> J.S.<br />
constructed the circuits. S.C. performed the microscopy experiments, <strong>and</strong> J.S. <strong>and</strong><br />
S.C. performed the flow cytometry experiments. S.C., L.S.T. <strong>and</strong> J.H. performed the<br />
single-cell data analysis. M.R.B., W.H.M. <strong>and</strong> L.S.T. performed the computational<br />
modelling. All authors wrote the manuscript.<br />
Author Information Reprints <strong>and</strong> permissions information is available at<br />
www.nature.com/reprints. Correspondence <strong>and</strong> requests for materials should be<br />
addressed to J.H. (hasty@bioeng.ucsd.edu).<br />
519
doi:10.1038/nature07389<br />
METHODS<br />
Oscillator plasmid <strong>and</strong> strain construction. <strong>The</strong> <strong>oscillator</strong> components araC <strong>and</strong><br />
lacI <strong>and</strong> a fluorescent reporter protein (yemGFP) were tagged with carboxyterminal<br />
TSAANDENYALAA ssrA tags 22 . yemGFP contains F64L/S65T/A206K<br />
mutations. <strong>The</strong>se tagged <strong>gene</strong>s were then cloned into pZ modular plasmids under<br />
the transcriptional control of the plac/ara-1 hybrid promoter 14 to form three coregulated<br />
transcriptional modules with identical promoters, ribosome-binding<br />
sequences <strong>and</strong> downstream terminators. <strong>The</strong> plac/ara-1 promoter is activated by<br />
AraC in the presence of arabinose <strong>and</strong> repressed by LacI in the absence of IPTG.<br />
<strong>The</strong> activator araC module <strong>and</strong> the reporter yemGFP module were placed on a<br />
ColE1 plasmid, <strong>and</strong> the repressor module was placed on a p15A plasmid. All PCRamplified<br />
sections <strong>and</strong> sequence junctions were confirmed by sequencing. (See<br />
Supplementary Fig. 1.) An DaraC DlacI strain was constructed by P1vir phage<br />
transduction between DaraC <strong>and</strong> DlacI strains. <strong>The</strong> two plasmids described above<br />
wereco-transformedintothis strain to construct the dual-feedback <strong>oscillator</strong> strain.<br />
To construct the negative feedback <strong>oscillator</strong> strain, the hybrid promoter<br />
p LlacO-1 (ref. 14) was used to regulate expression of lacI <strong>and</strong> yemGFP. This<br />
promoter is repressed by LacI in the absence of IPTG. Both <strong>gene</strong>s were tagged<br />
with ssrA tags as described above. Two transcriptional modules containing<br />
pLlacO-1 <strong>and</strong> lacI or yemGFP were constructed as above. <strong>The</strong> repressor module<br />
was placed on a p15A plasmid <strong>and</strong> the reporter module was placed on a ColE1<br />
plasmid. <strong>The</strong>se were then co-transformed into a DlacI strain.<br />
Microscopy. We examined cells with single-cell time-lapse fluorescence microscopy<br />
using microfluidic devices designed to support growth of a monolayer of<br />
E. coli cells under constant nutrient flow (Supplementary Fig. 2). <strong>The</strong> design of<br />
the microfluidic device used in all microscopy experiments was adapted from the<br />
Tesla microchemostat design 23 for use with Saccharomyces cerevisiae.<br />
Modifications made to support imaging monolayers of E. coli included lowering<br />
the cell chamber height to match the cylindrical diameter of K-12 MG 1655 cells,<br />
lowering the delivery channel height to maintain equivalent flow splitting<br />
between the cell chamber <strong>and</strong> the bypass channel, <strong>and</strong> dividing the cell trapping<br />
region into three channels for simultaneous observation of isolated colonies<br />
(Supplementary Fig. 2a, b). For on-chip induction experiments, we used a variant<br />
of this device that incorporated a laminar boundary media switch into the<br />
design 30 <strong>and</strong> supported cell growth for several <strong>gene</strong>rations in non-inducing<br />
media before induction <strong>and</strong> imaging (Supplementary Fig. 2c, d).<br />
In each experiment, a microfluidic device was mounted to the stage <strong>and</strong> wetted<br />
using a solution of 0.1% Tween 20 surfactant in the appropriate growth medium.<br />
For optimal E. coli growth, the chip temperature was typically maintained at 37 uC<br />
©2008 Macmillan Publishers Limited. All rights reserved<br />
by flowing heated water through deep thermal channels fabricated into the device.<br />
Cells that had been passed from an overnight culture into inducing media<br />
approximately 3–4 h earlier were loaded into the device from the cell port by<br />
directing high flow both from the cell port <strong>and</strong> from the media port to the waste<br />
port. On trapping a single cell in each channel, flow past the cell chamber was<br />
reversed <strong>and</strong> slowed to 1–2 mms 21 such that fresh nutrients were delivered from<br />
the media port by means of a combination of diffusion <strong>and</strong> advection without<br />
physically disturbing the cells.<br />
Cells grew logarithmically to fill the channels over an experimental duration of<br />
,4–6 h, while images were acquired every 2–3 min at 3100 magnification in the<br />
transmitted <strong>and</strong> fluorescent channels. Focus was maintained during image<br />
acquisition either by manual adjustment or by contrast-based autofocus algorithms.<br />
After each imaging session, fluorescence trajectories of individual cells<br />
were extracted using the WCIF ImageJ cell analysis package. For each fluorescence<br />
frame, mean values of integrated fluorescence were calculated within<br />
constant circular areas inscribed within the boundaries of all tracked cells. Longterm<br />
fluorescence trajectories were subsequently constructed by manually tracking<br />
each cell throughout the experiment.<br />
Flow cytometry. Oscillator cells were initially characterized by flow cytometry of<br />
batch cultures to identify inducer conditions that supported oscillations.<br />
Subsequently, time-course flow cytometry was performed on growing cultures<br />
immediately after induction to follow oscillation dynamics. This time-course flow<br />
cytometry followed one of two similar protocols. In the continuous protocol, a<br />
single culture was serially diluted to maintain logarithmic growth. <strong>The</strong> culture was<br />
induced at the initial time point, <strong>and</strong> samples were removed for flow cytometry<br />
over the course of the experiment. In the aggregate protocol, an uninduced culture<br />
in logarithmic growth was aliquoted onto different inducer concentrations, <strong>and</strong><br />
these subcultures were allowed to grow for varying lengths of time before flow<br />
cytometry. Flow cytometry was performed directly from growing cultures, <strong>and</strong><br />
noncellular low-scatter noise was removed by thresholding. Oscillations were<br />
tracked by measuring the mean cellular fluorescence at each time point. <strong>The</strong><br />
amplitude of the initial oscillation was usually higher than that of subsequent<br />
oscillations, presumably owing to desynchronization of the oscillations<br />
(Supplementary Fig. 8). <strong>The</strong> oscillation period was defined as the time elapsed<br />
between the first <strong>and</strong> second oscillation peaks. All flow cytometry analysis was<br />
carried out on a Becton-Dickinson FACScan.<br />
30. Groisman, A. et al. A microfluidic chemostat for experiments with bacterial <strong>and</strong><br />
yeast cells. Nature Methods 2, 685–689 (2005).
doi: 10.1038/nature07389<br />
Supplementary Information<br />
A <strong>fast</strong>, <strong>robust</strong> <strong>and</strong> <strong>tunable</strong> <strong>synthetic</strong> <strong>gene</strong> <strong>oscillator</strong><br />
Jesse Stricker 1⋆ , Scott Cookson 1⋆ , Matthew R. Bennett 1,2⋆ ,<br />
William H. Mather 1 , Lev S. Tsimring 2 & Jeff Hasty 1,2,3<br />
1 Department of Bioengineering, University of California, San Diego, La Jolla, California, 92093 USA.<br />
2 Institute for Nonlinear Science, University of California, San Diego, La Jolla, California, 92093 USA.<br />
3 Corresponding Author. Department of Bioengineering, University of California, San Diego, Mailcode<br />
0412, La Jolla, CA 92093-0412, USA. Telephone: 858 822 3442. Fax: 858 534 5722. Email:<br />
hasty@bioeng.ucsd.edu.<br />
⋆ <strong>The</strong>se authors contributed equally to this work.<br />
Materials <strong>and</strong> Methods<br />
Plasmid construction<br />
Using a tagging vector, the two components of the <strong>oscillator</strong> (araC <strong>and</strong> lacI) <strong>and</strong> the <strong>gene</strong> encoding<br />
the fluorescent reporter protein (yemGFP) were tagged with carboxy-terminal ssrA tags<br />
(Andersen et al. 1998) consisting of TSAANDENYALAA. <strong>The</strong> TS sequence encodes a SpeI site<br />
<strong>and</strong> acts as a linker, while the ssrA tag (in bold) targets proteins to the ClpXP degradation pathway,<br />
greatly increasing their degradation rates <strong>and</strong> therefore dynamic behavior. <strong>The</strong> first codon<br />
of the lacI <strong>gene</strong> was changed from its wildtype sequence of GTG to a st<strong>and</strong>ard ATG start codon.<br />
<strong>The</strong> GFP allele used in this study contains F64L/S65T/A206K mutations <strong>and</strong> is codon-optimized<br />
for yeast expression (Sheff <strong>and</strong> Thorn 2004). <strong>The</strong> first two mutations correspond to mut1GFP<br />
(Cormack et al. 1996), while the A206K mutation interferes with GFP dimerization (Zacharias<br />
et al. 2002). <strong>The</strong> yeast codon optimization does not appear to have any effects in E. coli other than<br />
a mild decrease in expression. In our experience, many GFP variants have deleterious effects in<br />
bacteria, especially when expressed at high levels, which may be due to multimerization (Shaner<br />
et al. 2005). <strong>The</strong> A206K mutation allows increased GFP expression without deleterious effects (as<br />
measured by growth rate or forward scatter measurements by flow cytometry).<br />
<strong>The</strong>se three tagged <strong>gene</strong>s were cloned into pZ modular plasmids under the transcriptional<br />
control of the p lac/ara-1 hybrid promoter (Lutz <strong>and</strong> Bujard 1997) to form three coregulated transcriptional<br />
modules. <strong>The</strong> promoter, ribosome binding sequence, <strong>and</strong> downstream terminator<br />
are identical between modules. <strong>The</strong> p lac/ara-1 promoter is activated by AraC in the presence of<br />
arabinose <strong>and</strong> repressed by LacI in the absence of IPTG. It includes two lacO operator sites, one<br />
overlapping <strong>and</strong> the other ∼500 bp upstream of the transcription start site. LacI repression is<br />
www.nature.com/nature<br />
1<br />
SUPPLEMENTARY INFORMATION
doi: 10.1038/nature07389 SUPPLEMENTARY INFORMATION<br />
mediated by DNA looping by LacI tetramer bound to both sites. We found that a single point<br />
mutation in the upstream lacO site abolished LacI repression.<br />
<strong>The</strong> activator araC module <strong>and</strong> the reporter yemGFP module were placed on a ColE1 plasmid<br />
with kanamycin resistance (pJS167). Although this plasmid contains repeated regions (the<br />
p lac/ara-1 <strong>and</strong> terminator sequences), we found no evidence of plasmid instability. <strong>The</strong> repressor<br />
module was placed on a p15A plasmid with ampicillin resistance (pJS169). All PCR-amplified<br />
sections <strong>and</strong> sequence junctions were confirmed by sequencing. (See Supplementary Fig. 1.)<br />
KanR<br />
ColE1<br />
P lac/ara-1<br />
araC-<br />
LAA<br />
P lac/ara-1<br />
yemGFP-<br />
LAA<br />
activator/reporter<br />
plasmid<br />
(pJS167)<br />
AmpR<br />
P lac/ara-1<br />
p15A<br />
repressor<br />
plasmid<br />
(pJS169)<br />
Supplementary Figure 1: <strong>The</strong> two plasmids containing the dual-feedback <strong>oscillator</strong> circuit. <strong>The</strong> activator<br />
<strong>and</strong> reporter modules are on a derivative of pZE24 (Lutz <strong>and</strong> Bujard 1997), a medium-copy (Chang <strong>and</strong><br />
Cohen 1978) ColE1 plasmid, while the repressor module is on a derivative of pZA14 (Lutz <strong>and</strong> Bujard 1997),<br />
a lower-copy (Kahn et al. 1979; Atlung et al. 1999) p15A plasmid. Cotransformation of ∆araC ∆lacI E. coli<br />
cells with both of these plasmids gives the <strong>oscillator</strong> strain JS011. Transcriptional terminators are shown as<br />
dark gray squares. Plasmid maps were drawn with Savvy (http://bioinformatics.org/savvy/).<br />
To construct the negative feedback <strong>oscillator</strong> strain, the hybrid promoter p LlacO-1 (Lutz <strong>and</strong><br />
Bujard 1997) was used to regulate expression of lacI <strong>and</strong> yemGFP. Both <strong>gene</strong>s were tagged with<br />
ssrA tags as described above. <strong>The</strong> p LlacO-1 promoter consists of the pL promoter from λ phage<br />
with lacO sites replacing the cI binding sites. <strong>The</strong> pL promoter gives constitutive transcription<br />
without cI binding. <strong>The</strong> addition of lacO sites allows repression by LacI in the absence of IPTG.<br />
Two transcriptional modules containing p LlacO-1 <strong>and</strong> lacI or yemGFP were constructed as above.<br />
<strong>The</strong> repressor module was placed on a p15A plasmid with chloramphenicol resistance (pZA32lacI-ssrA),<br />
<strong>and</strong> the reporter module was placed on a ColE1 plasmid with ampicillin resistance<br />
(pZE12-yemGFP-ssrA).<br />
Strain construction<br />
Strains of E. coli with deletions in araC (JW0063) or lacI (JW0336) were obtained from the Keio<br />
collection (Baba et al. 2006). Strains from this collection have single <strong>gene</strong> deletions that are linked<br />
to a kanamycin resistance marker that can be eliminated by site-specific recombination with an<br />
exogenously supplied recombinase. To construct the <strong>oscillator</strong> strain, kanamycin resistance was<br />
www.nature.com/nature<br />
2<br />
lacI-<br />
LAA
doi: 10.1038/nature07389 SUPPLEMENTARY INFORMATION<br />
eliminated from JW0063, <strong>and</strong> ∆lacI was introduced into the resulting strain by P1vir phage transduction<br />
from JW0336. Double knockout transductants were selected for by growth on 50 µg/mL<br />
kanamycin, <strong>and</strong> kanamycin resistance was again eliminated as above to construct strain JS006<br />
(MG1655 ∆araC ∆lacI Kan S ). Genomic alterations were confirmed by genomic PCR (Datsenko<br />
<strong>and</strong> Wanner 2000) <strong>and</strong> sequencing. <strong>The</strong> locations of the kanamycin resistance remnants are<br />
sufficiently separated on the bacterial chromosome to prevent further recombination between<br />
deletion sites. <strong>The</strong> dual-feedback <strong>oscillator</strong> strain JS011 was constructed by transforming JS006<br />
with pJS167 <strong>and</strong> pJS169 such that the only source of AraC <strong>and</strong> LacI was the <strong>oscillator</strong> plasmids.<br />
To construct the negative feedback <strong>oscillator</strong> strain, kanamycin resistance was eliminated from<br />
JW0336 to form strain JS002 (MG1655 ∆lacI Kan S ). JS002 was then transformed with the two<br />
negative feedback <strong>oscillator</strong> plasmids described above to construct JS013.<br />
Microfluidics device construction<br />
We examined cells with single-cell timelapse fluorescence microscopy using microfluidic devices<br />
designed to support growth of a monolayer of E. coli cells under constant nutrient flow (Supplementary<br />
Fig. 2). <strong>The</strong> use of these microfluidic devices, coupled with cell tracking <strong>and</strong> fluorescence<br />
measurement, allow us to <strong>gene</strong>rate fluorescence trajectories for single cells. <strong>The</strong> design of<br />
the microfluidic device used in these experiments was adapted from the Tesla microchemostat<br />
design developed in Cookson et al. (2005) for use with Saccharomyces cerevisiae. <strong>The</strong> original Tesla<br />
microchemostat design implemented the classic Tesla diode loop (Tesla 1920; Duffy et al. 1999;<br />
Bendib <strong>and</strong> Français 2001) modified for imaging a monolayer culture of growing yeast cells. Here,<br />
modifications were made to support imaging monolayers of E. coli, which included lowering the<br />
cell chamber height from 4 µm to 1 µm to match the cylindrical diameter of K-12 MG1655 cells,<br />
lowering the delivery channel height from 12 µm to 3 µm to maintain equivalent flow splitting<br />
between the cell chamber <strong>and</strong> the bypass channel, <strong>and</strong> dividing the cell trapping region into three<br />
channels for simultaneous observation of isolated colonies (Supplementary Fig. 2A–B). Lastly, the<br />
width of each parallel chamber was limited to 30 µm so as not to exceed the width/height aspect<br />
ratio of 30 for PDMS <strong>and</strong> risk structural collapse of the chamber “ceilings.”<br />
In order to achieve long experimental runs, a critical design objective was to avoid clogging<br />
between the media port <strong>and</strong> the trapping region. Towards this end, we developed a three-port<br />
chip design in which the main channel extending from the cell port splits into a media channel<br />
<strong>and</strong> a waste channel downstream of the trapping region. <strong>The</strong> waste port receives untrapped cells<br />
during loading <strong>and</strong> superfluous media during runtime, thereby eliminating contamination of the<br />
media port. Cells were loaded into the three trapping channels of the microfluidic device by<br />
directing flow in the “forward” direction from the cell port to the waste port. Upon trapping a<br />
few cells in each region, the flow was reversed <strong>and</strong> slowed to steadily supply the cells with fresh<br />
nutrients from the media port through a combination of diffusion <strong>and</strong> advection. Cells grew<br />
exponentially to fill the channels over an experimental duration of ∼4–6 hours, while images<br />
were periodically acquired in the transmitted <strong>and</strong> fluorescent channels every 2–3 min. <strong>The</strong> open<br />
walls of the trapping region allowed for cells at the periphery of the exp<strong>and</strong>ing colonies to be<br />
swept away by the high flow in the main channel, thus permitting continuous exponential growth<br />
long after the trapping region filled. For optimal E. coli growth, chip temperature was typically<br />
www.nature.com/nature<br />
3
doi: 10.1038/nature07389 SUPPLEMENTARY INFORMATION<br />
Supplementary Figure 2: Schematics of microfluidic devices used in timelapse microscopy experiments.<br />
A shows the Tesla microchemostat device adapted for imaging monolayer colonies of E. coli over many<br />
cellular <strong>gene</strong>rations. Cells are loaded into the trapping channels (dark red, magnified in B) by directing<br />
flow from the cell inlet to the waste outlet, <strong>and</strong> then flow is reversed <strong>and</strong> slowed to provide fresh media<br />
to the cells from the media inlet during the experiment. Flow is maintained away from the media inlet at<br />
all times to prevent contamination of this reservoir. <strong>The</strong>rmal control is achieved by flowing heated water<br />
from a reciprocating bath through two high-volume thermal lines (light gray). B shows a magnified view<br />
of the cell trapping region (red boxed region in A). Cells are loaded into three parallel trapping channels<br />
for simultaneous observation of isolated colonies. <strong>The</strong> depth of these trapping channels is fabricated at<br />
precisely 1 µm to match the cylindrical diameter of K-12 E. coli. C shows a variant of the device shown<br />
in A with an integrated switch incorporated into the media supply line. This switch supports the selection<br />
of one of two media types <strong>and</strong> is based on laminar flow boundary shifting. D shows a magnified view of<br />
the switching region (green boxed region in C). By shifting the boundary separating the laminar flows of<br />
medium 1 <strong>and</strong> medium 2 to the channel centerline at the left (dashed blue line), flows of both media are<br />
directed to the media sink port through the shunt channels, <strong>and</strong> medium 2 is delivered to the cells. In the<br />
opposite configuration, where the laminar flow boundary is shifted to the channel centerline at the right<br />
(dashed purple line), flows of both media are directed to the media sink port through the shunt channels<br />
<strong>and</strong> medium 1 is delivered to the cells. Sustained flow of each media type to the media sink through the<br />
shunt channels prevents cross-contamination of the media reservoirs.<br />
www.nature.com/nature<br />
4
doi: 10.1038/nature07389 SUPPLEMENTARY INFORMATION<br />
maintained at 37 ◦ C by flowing heated water through deep thermal channels fabricated into the<br />
device.<br />
For on-chip induction experiments, we used a variant of the above-described device that incorporated<br />
a laminar boundary media switch into the design (Groisman et al. 2005) (Supplementary<br />
Fig. 2C). This microfabricated switch directed flow to the cells from one of two media inlet<br />
ports by shifting the boundary between the two laminar flow streams (Supplementary Fig. 2D).<br />
In these experiments, cells were loaded into the device <strong>and</strong> grown for several <strong>gene</strong>rations in<br />
non-inducing media without periodic image acquisition in order to minimize fluorescence exposure.<br />
Upon exp<strong>and</strong>ing to occupy roughly half of the field of view, the cells were induced by<br />
flipping the state of the on-chip media switch, which switched to medium with inducers in less<br />
than 1 s. We maintained constant flow from both media inlets to the media sink throughout<br />
the switching operation in order to prevent backflow contamination of the media inlets. <strong>The</strong><br />
non-induced <strong>and</strong> induced media solutions were differentiated by labeling the inducing media<br />
with Sulforhodamine 101 red fluorescent dye. Cells grown in the absence of inducers initiated<br />
oscillations in a synchronous fashion upon the addition of inducers (Supplementary Movie 10).<br />
This initial synchrony of oscillations suggested the possibility of using flow cytometry to further<br />
characterize the <strong>oscillator</strong>.<br />
All described devices were fabricated in the UCSD Integrated Technology Lab (ITL) <strong>and</strong> the<br />
Calit2 Nano3 facility using st<strong>and</strong>ard soft lithography techniques (Duffy et al. 1998; Unger et al.<br />
2000; Whitesides et al. 2001; Sia <strong>and</strong> Whitesides 2003). Photomasks were drawn in FreeH<strong>and</strong><br />
MX (Macromedia Inc., San Francisco, CA), printed onto transparency film by CAD/Art Services,<br />
Inc. (Output City, Poway, CA), <strong>and</strong> mounted onto borosilicate glass plates (McMaster-Carr, Los<br />
Angeles, CA). Master molds were created by first spin-coating SU-8 2000 negative photoresists<br />
(MicroChem Corp., Newton, MA) upon clean silicon wafers to appropriate depths using a Headway<br />
PWM32 programmable spinner (Headway Research Inc., Garl<strong>and</strong>, TX) <strong>and</strong> then patterning<br />
using a UV contact mask aligner (HTG, San Jose, CA). Replica molds were created from master<br />
molds by mixing PDMS/Sylgard 184 (Dow Corning, Midl<strong>and</strong>, MI) in a 10:1 ratio of elastomer<br />
base:curing agent, degassing in a vacuum desiccator at ∼-1 atm for 1 h, <strong>and</strong> curing in place<br />
over the master at 80 ◦ C for 2 h. Following removal of the PDMS monolith, chips were sectioned,<br />
bored at the fluidic ports, cleaned with HPLC-grade methanol, <strong>and</strong> permanently bonded to clean<br />
No. 1½ coverslips (Corning Inc., Corning, NY) via exposure to O2 plasma at 30 W for 1 min in a<br />
500-II Plasma Asher (Technics Plasma, Danville, CA).<br />
Timelapse microscopy <strong>and</strong> image analysis<br />
All images were acquired using one of two microscopy configurations—one for brightfield imaging<br />
<strong>and</strong> another for phase contrast imaging. <strong>The</strong> brightfield setup comprised a Diaphot TMD<br />
epifluorescent inverted microscope (Nikon Instruments Inc., Tokyo, Japan) outfitted with fluorescence<br />
excitation <strong>and</strong> emission filter wheels (filter set #86006 for CFP/YFP/DsRed, Chroma<br />
Technology Corp., Rockingham, VT) <strong>and</strong> automated by a custom application written in LabVIEW<br />
(National Instruments, Austin, TX). <strong>The</strong> phase-contrast setup comprised a TE2000-U epifluorescent<br />
inverted microscope (Nikon Instruments Inc., Tokyo, Japan) outfitted with fluorescence excitation<br />
<strong>and</strong> emission filter wheels (filter set #89006 for CFP/YFP/mCherry, Chroma Technology<br />
Corp., Rockingham, VT) <strong>and</strong> a GFP filter cube (#GFP-3035B-NTE, Semrock Inc., Rochester, NY)<br />
www.nature.com/nature<br />
5
doi: 10.1038/nature07389 SUPPLEMENTARY INFORMATION<br />
<strong>and</strong> automated by NIS-Elements Advanced Research software (Nikon Instruments Inc., Tokyo,<br />
Japan). Both configurations used a ProScan II XY-motorized stage with fine focus control (Prior<br />
Scientific Inc., Rockl<strong>and</strong>, MA), Uniblitz VS35 high-speed shutters (Vincent Associates, Rochester,<br />
NY), an Orca-ER cooled CCD camera (Hamamatsu Photonics, Hamamatsu, Japan), <strong>and</strong> an X-Cite<br />
Series 120 fluorescent lamp (EXFO, Quebec, Canada).<br />
In each experiment, a microfluidic device was mounted to the stage <strong>and</strong> wetted using a<br />
solution of 0.1% Tween 20 surfactant (Sigma-Aldrich, St. Louis, MO) in the appropriate medium.<br />
Culture temperature was maintained by connecting high-volume fluidic channels fabricated into<br />
the device to a reciprocating heated/cooled water bath. Cells that had been passed from an<br />
overnight culture into inducing media approximately 3–4 h earlier were loaded into the device<br />
from the cell port by directing high flow both from the cell port <strong>and</strong> the media port to the<br />
waste port. Upon trapping a single cell in each channel, flow past the cell chamber was reversed<br />
<strong>and</strong> slowed to 1–2 µm/s such that fresh nutrients were delivered from the media port via a<br />
combination of diffusion <strong>and</strong> advection without physically disturbing the cells.<br />
During exponential growth of the monolayer colony, images were collected at 100x magnification<br />
in the brightfield or phase contrast <strong>and</strong> YFP or GFP fluorescence channels (for the two<br />
microscope setups described above respectively) every 2–3 min over a period of around 4–6 h.<br />
Experimental runs were often allowed to run for longer durations, but data analysis was limited<br />
to the initial period when the growth chamber had not filled. Focus was maintained during image<br />
acquisition either by manual adjustment or contrast-based autofocus algorithms. Following<br />
each imaging session, fluorescence trajectories of individual cells were extracted using the WCIF<br />
ImageJ cell analysis package (Wayne Rasb<strong>and</strong>, Research Services Branch, National Institute of<br />
Mental Health, Bethesda, MD with plug-in collation <strong>and</strong> organization by the Wright Cell Imaging<br />
Facility, Toronto, ON). For each fluorescence frame, mean values of integrated fluorescence<br />
were calculated within constant circular areas inscribed within the boundaries of all tracked<br />
cells. Long-term fluorescence trajectories were subsequently constructed by manually tracking<br />
each cell throughout the experiment. Raw fluorescence trajectories were typically smooth (Supplementary<br />
Fig. 3). In cases where cell boundaries could not be resolved in the fluorescence<br />
images due to low signal, circular areas were appropriately positioned in accordance with the<br />
synchronously-collected transmitted images. <strong>The</strong> great majority of the cells showed oscillations<br />
in fluorescence (Supplementary Table 1).<br />
Movies of our constant-induction microscopy runs are provided as Supplementary Movies 1–<br />
9 (dual-feedback loop <strong>oscillator</strong>; JS011 in LB at 37 ◦ C (Movies 1–8) or 25 ◦ C (Movie 9)) <strong>and</strong> 11–12<br />
(negative feedback loop <strong>oscillator</strong>; JS013 or control strain in LB at 37 ◦ C, see also Supplementary<br />
Fig. 5). Transmitted <strong>and</strong> fluorescence channels are overlaid in gray <strong>and</strong> green, respectively. Additionally,<br />
a movie capturing the dynamic induction of the dual-feedback <strong>oscillator</strong> in a partiallyfilled<br />
cell chamber is presented as Supplementary Movie 10 (see above). This movie demonstrates<br />
that step induction initiates synchronous oscillations within single cells of the colony.<br />
Flow cytometry<br />
We initially characterized the circuit by flow cytometry of JS011 cells grown in batch cultures. An<br />
overnight culture of JS011 was diluted 1:4000 in LB (10 g/L NaCl) with 100 µg/mL ampicillin,<br />
50 µg/mL kanamycin, <strong>and</strong> a range of concentrations of l-arabinose <strong>and</strong> IPTG, <strong>and</strong> grown for<br />
www.nature.com/nature<br />
6
doi: 10.1038/nature07389 SUPPLEMENTARY INFORMATION<br />
400<br />
Fluorescence<br />
(AU)<br />
00<br />
60 120 180<br />
Time (min)<br />
400<br />
Fluorescence<br />
(AU)<br />
00<br />
400<br />
60 120 180<br />
Time (min)<br />
Fluorescence<br />
(AU)<br />
00<br />
60 120 180<br />
Time (min)<br />
400<br />
Fluorescence<br />
(AU)<br />
00<br />
60 120 180<br />
Time (min)<br />
400<br />
Fluorescence<br />
(AU)<br />
00<br />
60 120 180<br />
Time (min)<br />
240<br />
240<br />
240<br />
240<br />
240<br />
400<br />
Fluorescence<br />
(AU)<br />
400<br />
Fluorescence<br />
(AU)<br />
00<br />
60 120 180<br />
Time (min)<br />
400<br />
Fluorescence<br />
(AU)<br />
00<br />
400<br />
60 120 180<br />
Time (min)<br />
Fluorescence<br />
(AU)<br />
00<br />
60 120 180<br />
Time (min)<br />
400<br />
00<br />
60 120 180<br />
Time (min)<br />
00<br />
60 120 180<br />
Time (min)<br />
Supplementary Figure 3: An example of unsmoothed fluorescence trajectories. <strong>The</strong>se trajectories were<br />
taken from a timelapse microscopy run at 0.7% arabinose <strong>and</strong> 0.1 mM IPTG. Each trajectory is a single cell<br />
undergoing division <strong>and</strong> oscillation. <strong>The</strong> arbitrary fluorescence units on the y-axes are equivalent.<br />
www.nature.com/nature<br />
7<br />
Fluorescence<br />
(AU)<br />
240<br />
240<br />
240<br />
240<br />
240
doi: 10.1038/nature07389 SUPPLEMENTARY INFORMATION<br />
Osc. period (min)<br />
50<br />
40<br />
30<br />
200<br />
60 120 180<br />
Duration of imaging (min)<br />
Supplementary Figure 4: <strong>The</strong> effect of continued growth on <strong>oscillator</strong>y period. JS011 cells were grown<br />
in microfluidic devices for long-term single-cell imaging under inducing conditions. Each point is an average<br />
of oscillation periods from several cells at the same point in time <strong>and</strong> the same conditions (black squares,<br />
0 mM IPTG; purple diamonds, 0.25 mM; blue triangles, 0.5 mM; green circles, 0.75 mM; green crosses, 1<br />
mM; yellow circles, 2 mM; orange triangles, 5 mM; red diamonds, 10 mM). Data analysis was performed<br />
using custom-written matlab scripts.<br />
IPTG (mM) oscillating cells dim cells bright cells dead cells<br />
0 129 0 0 2<br />
0.25 149 0 0 0<br />
0.5 209 0 0 0<br />
0.75 331 0 0 0<br />
1 129 0 0 2<br />
2 231 0 2 2<br />
5 233 0 0 0<br />
10 155 0 0 0<br />
total 1566 0 2 6<br />
(99.5%) (0.1%) (0.4%)<br />
Supplementary Table 1: <strong>The</strong> <strong>oscillator</strong> circuit is functional in almost every cell observed with single-cell<br />
microscopy. <strong>The</strong> experiments shown in Supplementary Movies 1–8 were examined, <strong>and</strong> single cells were<br />
identified. Each cell was tracked by eye <strong>and</strong> classified into one of four groups: oscillating, never fluorescent,<br />
always fluorescent (with saturating levels of fluorescence), <strong>and</strong> dead (with abnormal morphology, usually<br />
swollen or burst, <strong>and</strong> no fluorescence).<br />
www.nature.com/nature<br />
8
doi: 10.1038/nature07389 SUPPLEMENTARY INFORMATION<br />
A<br />
B<br />
1200<br />
Fluorescence<br />
(AU)<br />
Fluorescence<br />
(AU)<br />
200<br />
0 60 120<br />
Time (min)<br />
180<br />
15<br />
6<br />
0 60 120<br />
Time (min)<br />
180<br />
Supplementary Figure 5: Single-cell fluorescence trajectories for A, MG1655Z1/pZE12-yemGFP-ssrA<br />
cells expressing LacI constitutively <strong>and</strong> containing neither positive or negative feedback loops (induced with<br />
2 mM IPTG), or B, JS013 cells containing the negative feedback <strong>oscillator</strong> (induced with 0.6 mM IPTG).<br />
Fluorescence measurements are given in arbitrary units that are consistent between the two experiments<br />
shown. Trajectories are smoothed with a Savitsky-Golay filter. Note that the cells without feedback are<br />
much brighter <strong>and</strong> do not show periodic fluorescence dynamics.<br />
3.5 h at 37 ◦ C. Samples were washed with PBS by centrifugation, <strong>and</strong> flow cytometry analysis<br />
was performed. Our expectation was that, given a circuit that produced oscillating cellular<br />
fluorescence levels, some of the cells in an unsynchronized population would have fluorescence<br />
levels intermediate to bright <strong>and</strong> dim levels. In contrast, a monostable circuit would result in a<br />
well-defined unimodal distribution <strong>and</strong> a bistable circuit would result in a bimodal distribution<br />
with few intermediate cells. A survey of inducer space using this method revealed potentially<br />
<strong>oscillator</strong>y regions that we subsequently investigated in greater detail using flow cytometry <strong>and</strong><br />
microscopy (Supplementary Figs. 6–7).<br />
Additional flow cytometry was performed by one of two similar protocols. <strong>The</strong> temperaturedependence<br />
experiments followed a continuous timecourse flow cytometry protocol, in which a<br />
single culture was induced at the initial timepoint <strong>and</strong> samples were removed for flow cytometry<br />
analysis over the course of the experiment. An overnight culture of JS011 was diluted in growth<br />
www.nature.com/nature<br />
9<br />
240
doi: 10.1038/nature07389 SUPPLEMENTARY INFORMATION<br />
µM IPTG<br />
0<br />
10<br />
100<br />
1000<br />
10000<br />
1e3<br />
cells<br />
0<br />
0 500<br />
FL (AU)<br />
1e3<br />
cells<br />
0<br />
0 500<br />
FL (AU)<br />
1e3<br />
cells<br />
0<br />
0 500<br />
FL (AU)<br />
1e3<br />
cells<br />
0<br />
0 500<br />
FL (AU)<br />
1e3<br />
cells<br />
0<br />
0 500<br />
FL (AU)<br />
1e3<br />
cells<br />
0<br />
0 500<br />
FL (AU)<br />
1e3<br />
cells<br />
0<br />
0 500<br />
FL (AU)<br />
1e3<br />
cells<br />
0<br />
0 500<br />
FL (AU)<br />
1e3<br />
cells<br />
0<br />
0 500<br />
FL (AU)<br />
1e3<br />
cells<br />
0<br />
0 500<br />
FL (AU)<br />
1e3<br />
cells<br />
0<br />
0 500<br />
FL (AU)<br />
1e3<br />
cells<br />
0<br />
0 500<br />
FL (AU)<br />
1e3<br />
cells<br />
0<br />
0 500<br />
FL (AU)<br />
1e3<br />
cells<br />
0<br />
0 500<br />
FL (AU)<br />
1e3<br />
cells<br />
0<br />
0 500<br />
FL (AU)<br />
% arabinose<br />
1e3<br />
cells<br />
0<br />
0 500<br />
FL (AU)<br />
1e3<br />
cells<br />
0<br />
0 500<br />
FL (AU)<br />
1e3<br />
cells<br />
0<br />
0 500<br />
FL (AU)<br />
1e3<br />
cells<br />
1e3<br />
cells<br />
0<br />
0 500<br />
FL (AU)<br />
0<br />
0 500<br />
FL (AU)<br />
1e3<br />
cells<br />
0<br />
0 500<br />
FL (AU)<br />
1e3<br />
cells<br />
0<br />
0 500<br />
FL (AU)<br />
1e3<br />
cells<br />
0<br />
0 500<br />
FL (AU)<br />
1e3<br />
cells<br />
0<br />
0 500<br />
FL (AU)<br />
1e3<br />
cells<br />
0<br />
0 500<br />
FL (AU)<br />
0 0.001 0.01 0.1 1<br />
Supplementary Figure 6: A survey of inducer space by flow cytometry. Each subpanel is a fluorescence<br />
histogram of a flow cytometry run of JS011 grown in the presence of the indicated inducers. Fluorescence<br />
data were collected using linear mode. <strong>The</strong> x-axis of each plot is a linear scale <strong>and</strong> the y-axis of each plot<br />
is truncated at 1000 events to emphasize the shoulders in the distribution. Cells brighter than 500 AU<br />
are collected in the rightmost (brightest) bin. In each case, less than 1% of the cells fell into this bin.<br />
Distributions showing shoulders on the right side of the distribution (e.g. the area outlined in red) suggest<br />
oscillations in cellular fluorescence <strong>and</strong> were investigated more closely (see Supplementary Fig. 7).<br />
www.nature.com/nature<br />
10
doi: 10.1038/nature07389 SUPPLEMENTARY INFORMATION<br />
mM IPTG<br />
1<br />
2<br />
4<br />
7<br />
10<br />
1e3<br />
cells<br />
0<br />
0 500<br />
FL (AU)<br />
1e3<br />
cells<br />
0<br />
0 500<br />
FL (AU)<br />
1e3<br />
cells<br />
1e3<br />
cells<br />
0<br />
0 500<br />
FL (AU)<br />
0<br />
0 500<br />
FL (AU)<br />
1e3<br />
cells<br />
0<br />
0 500<br />
FL (AU)<br />
1e3<br />
cells<br />
0<br />
0 500<br />
FL (AU)<br />
1e3<br />
cells<br />
0<br />
0 500<br />
FL (AU)<br />
1e3<br />
cells<br />
1e3<br />
cells<br />
0<br />
0 500<br />
FL (AU)<br />
0<br />
0 500<br />
FL (AU)<br />
1e3<br />
cells<br />
0<br />
0 500<br />
FL (AU)<br />
1e3<br />
cells<br />
0<br />
0 500<br />
FL (AU)<br />
1e3<br />
cells<br />
0<br />
0 500<br />
FL (AU)<br />
1e3<br />
cells<br />
0<br />
0 500<br />
FL (AU)<br />
1e3<br />
cells<br />
0<br />
0 500<br />
FL (AU)<br />
1e3<br />
cells<br />
0<br />
0 500<br />
FL (AU)<br />
% arabinose<br />
1e3<br />
cells<br />
0<br />
0 500<br />
FL (AU)<br />
1e3<br />
cells<br />
0<br />
0 500<br />
FL (AU)<br />
1e3<br />
cells<br />
1e3<br />
cells<br />
0<br />
0 500<br />
FL (AU)<br />
0<br />
0 500<br />
FL (AU)<br />
0<br />
0 500<br />
FL (AU)<br />
1e3<br />
cells<br />
0<br />
0 500<br />
FL (AU)<br />
1e3<br />
cells<br />
0<br />
0 500<br />
FL (AU)<br />
1e3<br />
cells<br />
1e3<br />
cells<br />
0<br />
0 500<br />
FL (AU)<br />
0<br />
0 500<br />
FL (AU)<br />
1e3<br />
cells<br />
0<br />
0 500<br />
FL (AU)<br />
0.1 0.2 0.4 0.7 1<br />
Supplementary Figure 7: A closer look at shouldered fluorescence distributions at some inducer concentrations.<br />
Each subpanel is a fluorescence histogram of a flow cytometry run of JS011 grown in the presence<br />
of the indicated inducers. Fluorescence data were collected using linear mode. <strong>The</strong> x-axis of each plot is<br />
a linear scale <strong>and</strong> the y-axis of each plot is truncated at 1000 events to emphasize the shoulders in the<br />
distribution. Cells brighter than 500 AU are collected in the rightmost (brightest) bin. In each case, less<br />
than 1% of the cells fell into this bin.<br />
www.nature.com/nature<br />
11<br />
1e3<br />
cells
doi: 10.1038/nature07389 SUPPLEMENTARY INFORMATION<br />
medium with antibiotics <strong>and</strong> grown for 3 h at the indicated temperature with 250 rpm shaking.<br />
<strong>The</strong> OD600 of the culture was ∼0.01–0.02 at this point. A pre-induction sample was removed for<br />
immediate flow cytometry analysis, <strong>and</strong> inducers were added to the remaining culture to the<br />
indicated concentrations. <strong>The</strong> culture was then grown as previously <strong>and</strong> samples were removed<br />
from the culture at regular intervals for flow cytometry. Approximately every three doubling<br />
times (∼70–80 min in LB) the culture was diluted 1:9 in prewarmed medium with antibiotics <strong>and</strong><br />
inducers, <strong>and</strong> this diluted culture was used for subsequent time points. <strong>The</strong>se serial dilutions<br />
kept the OD600 of the culture below 0.2. <strong>The</strong> amplitude of the oscillations was initially high <strong>and</strong><br />
decreased as the experiment continued, presumably due to desynchronization of the cells <strong>and</strong><br />
apparent spreading of the <strong>oscillator</strong>y peaks (Supplementary Fig. 8).<br />
A<br />
B<br />
Avg FL (AU)<br />
Avg FL (AU)<br />
400<br />
300<br />
200<br />
100<br />
0<br />
0 60 120 180<br />
Time after induction (min)<br />
80<br />
60<br />
40<br />
20<br />
0<br />
0 60 120 180<br />
Time after induction (min)<br />
Supplementary Figure 8: Oscillations observed by flow cytometry. JS011 cells were grown at 37 ◦ C in<br />
either LB (A) or minimal A medium as in Miller (1992) with 1 µg/mL thiamine <strong>and</strong> 2 g/L glucose (B) plus<br />
antibiotics. Oscillations were measured by flow cytometry of samples continually harvested from growing<br />
cultures induced with 0.7% arabinose <strong>and</strong> 2 mM IPTG. Lines connecting the points are unsmoothed. In<br />
both cases, oscillations were confirmed by timelapse microscopy <strong>and</strong> shown to not decrease in amplitude<br />
over time, suggesting that the apparent ringing down of the <strong>oscillator</strong> in flow cytometry experiments is an<br />
artifact of the culture conditions or sampling method.<br />
Inducer-dependence experiments used an aggregate timecourse flow cytometry protocol,<br />
where an uninduced culture was aliquoted onto different inducer concentrations <strong>and</strong> allowed<br />
to grow for varying lengths of time. An overnight culture of JS011 was diluted 1:100,000 in LB<br />
with antibiotics <strong>and</strong> grown at 37 ◦ C. During this growth, culture tubes containing inducers were<br />
www.nature.com/nature<br />
12
doi: 10.1038/nature07389 SUPPLEMENTARY INFORMATION<br />
prewarmed. Between 2.5–4 h after initial dilution, aliquots of the growing culture were added<br />
to inducer tubes at regular intervals, resulting in a set of cultures with varying induction times.<br />
At the end of the experiment, all samples were quickly measured by flow cytometry (∼3 samples/min),<br />
starting with the lowest induction duration. <strong>The</strong> induction duration was calculated<br />
as the time between addition of culture to inducer <strong>and</strong> flow cytometry measurement, <strong>and</strong> the<br />
<strong>oscillator</strong>y period was calculated as the time between the first peak <strong>and</strong> the second peak of the<br />
mean fluorescence of the culture.<br />
This protocol allowed parallel examination of multiple inducer conditions more easily than<br />
the continuous timecourse protocol. Amplitudes <strong>and</strong> oscillation periods increased along the<br />
arabinose transect at 2 mM IPTG as arabinose increased (Supplementary Fig. 9). At low levels<br />
of arabinose, mean fluorescence was low enough that following oscillations after the second<br />
peak became difficult. However, microscopy experiments at these arabinose levels confirmed<br />
that the cells were oscillating. <strong>The</strong> values seen along the IPTG transect at 0.7% arabinose were<br />
in good agreement with the period measurements obtained from single-cell trajectories (Fig. 2a),<br />
although measurements derived from single-cell trajectories were consistently higher. This could<br />
be due to an unexplained difference in the growth environment (although doubling times were<br />
consistent across the two methods), or it could be related to the gradual increase in period seen<br />
in the microscopy experiments (Supplementary Fig. 4). Extension of the IPTG transect to IPTG<br />
levels higher than those examined by microscopy resulted in oscillations with low amplitudes<br />
<strong>and</strong> short periods, confirming the decrease in period seen in the microscopy experiments.<br />
Avg FL (AU)<br />
500<br />
400<br />
300<br />
200<br />
100<br />
0<br />
0 30 60 90 120<br />
Time after induction (min)<br />
Supplementary Figure 9: Oscillations in mean fluorescence over time on a transect along 2 mM IPTG.<br />
Fluorescence was measured by flow cytometry of samples induced with various levels of arabinose (blue,<br />
0.2% arabinose; green, 0.3%; orange, 0.7%; red, 2%) <strong>and</strong> 2 mM IPTG <strong>and</strong> grown for a range of durations,<br />
<strong>and</strong> smoothed by a Savitsky-Golay filter. (Flow cytometry data for the 2% arabinose sample are shown in<br />
Supplementary Figs. 14–15.)<br />
Hybrid promoter induction curves were determined using MG1655Z1 cells (Lutz <strong>and</strong> Bujard<br />
1997) transformed with a plasmid that contained yemGFP-ssrA under the control of the p lac/ara-1<br />
hybrid promoter (essentially pJS167 without the activator module). MG1655Z1 constitutively<br />
produces LacI, which is necessary to support IPTG-mediated release of repression given the large<br />
number of lacO sites on multiple-copy plasmids. AraC is produced from the wildtype genomic<br />
locus. <strong>The</strong>se cells have neither feedback loop from the dual-feedback <strong>oscillator</strong>. An overnight<br />
www.nature.com/nature<br />
13
doi: 10.1038/nature07389 SUPPLEMENTARY INFORMATION<br />
culture of these cells in LB with kanamycin was diluted 1:3000 in fresh LB with kanamycin<br />
<strong>and</strong> grown for 2 h at 37 ◦ C with shaking. <strong>The</strong> cells were then diluted 1:4 in fresh LB with<br />
kanamycin, arabinose, <strong>and</strong> varying levels of IPTG <strong>and</strong> grown for 2.5 h before being analyzed by<br />
flow cytometry.<br />
<strong>The</strong>se induction curves showed a decrease in fluorescence starting at ∼2–3 mM IPTG similar<br />
to that seen in the oscillation period transect along IPTG (Supplementary Fig. 10). IPTG has<br />
been observed to interfere with AraC-arabinose binding <strong>and</strong> subsequent activation at another<br />
arabinose-inducible promoter (Lee et al. 2007). We investigated whether IPTG interfered with<br />
AraC activation of p lac/ara-1 using a strain with the activator but no repressor module. Arabinose<br />
induction of this system results in a runaway positive feedback loop (Supplementary Fig. 11) due<br />
to the lack of LacI repressor. This runaway induction can be prevented by IPTG addition despite<br />
the lack of LacI (Supplementary Fig. 12). We conclude that IPTG can interfere with activation of<br />
p lac/ara-1, <strong>and</strong> this crosstalk in our circuit is responsible for the decreases in expression of GFP<br />
<strong>and</strong> in oscillation period that we observe.<br />
Rel. Fluor./Period<br />
1<br />
0.8<br />
0.6<br />
0.4<br />
0.2<br />
0<br />
10 −2<br />
10 −1<br />
10 0<br />
IPTG (mM)<br />
Supplementary Figure 10: Oscillation period dynamics mirror hybrid promoter induction. <strong>The</strong> experimental<br />
induction data from the p lac/ara-1 hybrid promoter in MG1655Z1 cells (with neither feedback loop, black<br />
squares) correlates well with the experimental <strong>oscillator</strong> periods determined by flow cytometry in JS011 cells<br />
(both feedback loops, green circles). Both data sets are normalized to their maximum value. <strong>The</strong> induction<br />
curve obtained from the deterministic model (blue curve) is also shown.<br />
All flow cytometry analysis was carried out on a Becton-Dickinson FACScan. Unless otherwise<br />
specified, samples were read directly from the LB growth medium. Under these conditions,<br />
forward scatter histograms (at E00 voltage setting in log mode) showed two well-separated subpopulations:<br />
a low-FSC population (FSC < 10) that was never fluorescent <strong>and</strong> a higher-FSC<br />
population that had a unimodal distribution with a mean FSC of ∼70–100 <strong>and</strong> could be fluorescent.<br />
(Similar results were found with E. coli cells expressing GFP under a constitutive promoter,<br />
or with wildtype E. coli cells, except that the higher FSC population was not fluorescent with<br />
wildtype cells.) <strong>The</strong> low-FSC subpopulation was assumed to be noncellular <strong>and</strong> was removed by<br />
www.nature.com/nature<br />
14<br />
10 1<br />
10 2
doi: 10.1038/nature07389 SUPPLEMENTARY INFORMATION<br />
Mean uorescence (AU)<br />
1e4<br />
1e2<br />
500<br />
cells<br />
1<br />
0 60 120 180<br />
0 min<br />
0<br />
0 1e4<br />
FL (AU, log)<br />
500<br />
cells<br />
500<br />
34.2 min<br />
0<br />
0 1e4<br />
FL (AU, log)<br />
Time after induction (min)<br />
cells<br />
500<br />
75.2 min<br />
0<br />
0 1e4<br />
FL (AU, log)<br />
cells<br />
110.1 min<br />
0<br />
0 1e4<br />
FL (AU, log)<br />
500<br />
cells<br />
151.4 min<br />
0<br />
0 1e4<br />
FL (AU, log)<br />
Supplementary Figure 11: Fluorescence dynamics without the repressor module. JS006 cells (∆araC<br />
∆lacI ) were transformed with pJS167 containing the activator <strong>and</strong> reporter modules. No lacI is present<br />
in this strain. <strong>The</strong> top panel shows timecourse flow cytometry, inducing with 0.7% arabinose <strong>and</strong> 2 mM<br />
IPTG at t = 0, on the resulting cells, which were separated into three subpopulations based on the fluorescence<br />
distributions (bottom panel). Before induction, distribution of the cells was bimodal, with a dim<br />
subpopulation (black points, left peak on the t = 0 distribution) <strong>and</strong> a brighter subpopulation (olive points,<br />
right peak on the t = 0 distribution). Upon induction, a third subpopulation of very bright cells separated<br />
from the bright cells (green points, rightmost on post-induction distributions). As induction continued, this<br />
subpopulation became extremely bright, increased in size, <strong>and</strong> eventually decreased in number until they<br />
were essentially eliminated from the population. <strong>The</strong> larger timepoints in the top panel correspond to the<br />
distributions in the bottom panel. (<strong>The</strong> corresponding strain without the activator module is shown in<br />
Supplementary Fig. 13.)<br />
www.nature.com/nature<br />
15
doi: 10.1038/nature07389 SUPPLEMENTARY INFORMATION<br />
A<br />
B<br />
Mean FL of bright cells (AU)<br />
Mean FL of bright cells (AU)<br />
1200<br />
600<br />
500<br />
250<br />
0<br />
0 30 60<br />
Induction time (min)<br />
90<br />
120<br />
0<br />
0 30 60<br />
Induction time (min)<br />
90<br />
120<br />
Supplementary Figure 12: High levels of IPTG interfere with p lac/ara-1 expression in the absence of LacI.<br />
JS006/pJS167 cells have a genomic lacI deletion <strong>and</strong> no plasmid-expressed lacI. Arabinose induction results<br />
in expression of additional AraC as well as GFP, giving a positive feedback loop that induces runaway GFP<br />
expression in a subset of the cells (Supplementary Fig. 11). A, This runaway expression can be measured<br />
by the mean fluorescence of the brightest subpopulation. Cells were grown as in Supplementary Fig. 11,<br />
induced with varying levels of arabinose (black, no arabinose; blue, 0.01%; green, 0.1%; brown, 0.3%;<br />
orange, 1%), <strong>and</strong> cellular fluorescence was measured by flow cytometry after induction. <strong>The</strong> magnitude of<br />
the effect is dependent on arabinose concentration, requires at least 0.1% arabinose, <strong>and</strong> saturates at high<br />
levels of arabinose. B, <strong>The</strong> addition of IPTG can interfere with this arabinose-induced runaway expression<br />
even in the absence of LacI . Cells were grown as in Supplementary Fig. 11, induced with 0.1% arabinose<br />
<strong>and</strong> varying levels of IPTG (black squares, no IPTG; dark blue diamonds, 0.1 mM; dark blue squares, 0.3<br />
mM; blue diamonds, 1 mM; blue-green squares, 3 mM; bright green diamonds, 10 mM; dark green squares,<br />
30 mM), <strong>and</strong> cellular fluorescence was measured by flow cytometry after induction. IPTG interference with<br />
runaway activation required 1–3 mM IPTG <strong>and</strong> was total at 10 mM IPTG.<br />
www.nature.com/nature<br />
16
doi: 10.1038/nature07389 SUPPLEMENTARY INFORMATION<br />
Mean uorescence (AU)<br />
400<br />
200<br />
0<br />
0 60 120<br />
1e3<br />
cells<br />
1e3<br />
cells<br />
0 min<br />
0<br />
0 1024<br />
FL (AU)<br />
0 min<br />
0<br />
0 1024<br />
FL (AU)<br />
1e3<br />
cells<br />
1e3<br />
cells<br />
0<br />
0 1024<br />
FL (AU)<br />
Time after induction (min)<br />
1e3<br />
30.6 min<br />
0<br />
0 1024<br />
FL (AU)<br />
cells<br />
1e3<br />
31.5 min<br />
cells<br />
1e3<br />
63.5 min<br />
0<br />
0 1024<br />
FL (AU)<br />
1e3<br />
64.6 min<br />
0<br />
0 1024<br />
FL (AU)<br />
cells<br />
cells<br />
97.3 min<br />
0<br />
0 1024<br />
FL (AU)<br />
98.8 min<br />
0<br />
0 1024<br />
FL (AU)<br />
1e3<br />
cells<br />
1e3<br />
cells<br />
131.7 min<br />
0<br />
0 1024<br />
FL (AU)<br />
133.5 min<br />
0<br />
0 1024<br />
FL (AU)<br />
Supplementary Figure 13: Fluorescence dynamics without the activator module. JS006 cells (∆araC<br />
∆lacI ) were transformed with pJS169 containing the repressor module <strong>and</strong> pZE24-yemGFP-LAA, a pJS167derived<br />
plasmid with the reporter module but without the activator module. No araC is present in this<br />
strain. <strong>The</strong> top panel shows timecourse flow cytometry, inducing with 0.7% arabinose <strong>and</strong> 2 mM IPTG at<br />
t = 0, on the resulting cells (black, square points), <strong>and</strong> on JS011 cells with both <strong>oscillator</strong> components<br />
(green, circular points) for scale. <strong>The</strong> bottom panel shows fluorescence distributions from JS011 cells with<br />
both components (top row) <strong>and</strong> cells with repressor only (bottom row). <strong>The</strong> larger timepoints in the top<br />
panel correspond to the distributions in the bottom panel.<br />
www.nature.com/nature<br />
17
doi: 10.1038/nature07389 SUPPLEMENTARY INFORMATION<br />
setting the event threshold on the flow cytometer at FSC = 20. Fluorescent detector voltages (<strong>and</strong><br />
gains if reading in linear mode) were adjusted to the dynamic range appropriate for a particular<br />
experiment. For the <strong>oscillator</strong> characterization experiments, the settings were linear mode,<br />
voltage 825–975, gain 8.00–8.25. Any samples that were compared to each other were run under<br />
identical settings. For each time point, 25,000–100,000 events were collected at low flow rate.<br />
In our single-cell microscopy experiments, the vast majority of cells oscillated (see Supplementary<br />
Table 1). In contrast, in the flow cytometry experiments, there was a subpopulation<br />
of cells of slightly smaller forward scatter that did not fluoresce (Supplementary Figs. 14–15).<br />
We assume that this subpopulation was essentially static, as the proportion of cells it contained<br />
could be seen to be constant over time if the oscillating subpopulation was sufficiently separated.<br />
<strong>The</strong> proportion of this subpopulation was larger at lower inducer concentrations. Inclusion of<br />
these cells in flow cytometry data analysis decreases the mean cellular fluorescence proportional<br />
to their frequency, but it does not affect the timing of <strong>oscillator</strong>y peaks (<strong>and</strong> therefore period<br />
determination). In the microscopy experiments, the cells were grown in the presence of inducer<br />
before <strong>and</strong> during loading into the microfluidic device. In contrast, the flow cytometry<br />
experiments observed the cells immediately after induction. <strong>The</strong> cell strain used here has the<br />
arabinose transporter <strong>gene</strong>s under native regulation. Since these <strong>gene</strong>s are positively regulated<br />
by AraC-arabinose, this gives a positive feedback loop that results in bimodal populations at<br />
some arabinose concentrations (Siegele <strong>and</strong> Hu 1997). Due to stochastics, some cells will have<br />
low initial levels of arabinose transporters <strong>and</strong> respond poorly to arabinose, while others will<br />
have higher initial levels of arabinose transporters <strong>and</strong> respond well to arabinose. We suggest<br />
that the longer exposure to arabinose before observation in the single-cell microscopy experiments<br />
results in autoinduction of the arabinose transporters in the great majority of the cells. In<br />
contrast, in the flow cytometry experiments at lower arabinose concentrations, a subpopulation<br />
of cells does not autoinduce sufficient arabinose transporter expression to respond to arabinose.<br />
www.nature.com/nature<br />
18
doi: 10.1038/nature07389 SUPPLEMENTARY INFORMATION<br />
500<br />
cells<br />
0 min<br />
0<br />
0 1024<br />
FL (AU)<br />
500<br />
cells<br />
0<br />
0 1024<br />
FL (AU)<br />
500<br />
cells<br />
25.8 min<br />
0<br />
0 1024<br />
FL (AU)<br />
500<br />
cells<br />
51.7 min<br />
0<br />
0 1024<br />
FL (AU)<br />
500<br />
cells<br />
77.3 min<br />
102.8 min<br />
0<br />
0 1024<br />
FL (AU)<br />
500<br />
cells<br />
500<br />
4.4 min<br />
0<br />
0 1024<br />
FL (AU)<br />
500<br />
cells<br />
0<br />
0 1024<br />
FL (AU)<br />
500<br />
cells<br />
cells<br />
500<br />
31.0 min<br />
0<br />
0 1024<br />
FL (AU)<br />
500<br />
cells<br />
cells<br />
500<br />
56.8 min<br />
0<br />
0 1024<br />
FL (AU)<br />
500<br />
cells<br />
cells<br />
500<br />
82.4 min<br />
cells<br />
500<br />
107.9 min<br />
0<br />
0 1024<br />
FL (AU)<br />
cells<br />
500<br />
10.1 min<br />
0<br />
0 1024<br />
FL (AU)<br />
0<br />
0 1024<br />
FL (AU)<br />
cells<br />
500<br />
36.1 min<br />
0<br />
0 1024<br />
FL (AU)<br />
cells<br />
500<br />
61.9 min<br />
cells<br />
500<br />
87.5 min<br />
0<br />
0 1024<br />
FL (AU)<br />
cells<br />
500<br />
112.9 min<br />
0<br />
0 1024<br />
FL (AU)<br />
cells<br />
15.3 min<br />
0<br />
0 1024<br />
FL (AU)<br />
41.3 min<br />
0<br />
0 1024<br />
FL (AU)<br />
67.1 min<br />
0<br />
0 1024<br />
FL (AU)<br />
92.5 min<br />
0<br />
0 1024<br />
FL (AU)<br />
118.0 min<br />
0<br />
0 1024<br />
FL (AU)<br />
500<br />
cells<br />
20.5 min<br />
0<br />
0 1024<br />
FL (AU)<br />
500<br />
cells<br />
46.5 min<br />
0<br />
0 1024<br />
FL (AU)<br />
500<br />
cells<br />
72.2 min<br />
0<br />
0 1024<br />
FL (AU)<br />
500<br />
cells<br />
97.7 min<br />
0<br />
0 1024<br />
FL (AU)<br />
500<br />
cells<br />
122.9 min<br />
0<br />
0 1024<br />
FL (AU)<br />
Supplementary Figure 14: Fluorescence distributions from timecourse flow cytometry analysis of the<br />
2% arabinose <strong>and</strong> 2 mM IPTG sample. For each timepoint collected in this experiment, a histogram of<br />
fluorescence values is shown here. (<strong>The</strong> mean fluorescence value over time is shown in Supplementary Fig. 9.)<br />
Fluorescence data were collected in linear mode. Note that the majority of the population oscillates, but<br />
there is a small subpopulation that does not fluoresce.<br />
www.nature.com/nature<br />
19
doi: 10.1038/nature07389 SUPPLEMENTARY INFORMATION<br />
1e4<br />
FSC (AU, log)<br />
0 min<br />
0<br />
0 1024<br />
FL (AU)<br />
1e4<br />
FSC (AU, log)<br />
0<br />
0 1024<br />
FL (AU)<br />
1e4<br />
FSC (AU, log)<br />
25.8 min<br />
0<br />
0 1024<br />
FL (AU)<br />
1e4<br />
FSC (AU, log)<br />
51.7 min<br />
0<br />
0 1024<br />
FL (AU)<br />
1e4<br />
FSC (AU, log)<br />
77.3 min<br />
102.8 min<br />
0<br />
0 1024<br />
FL (AU)<br />
1e4<br />
FSC (AU, log)<br />
1e4<br />
4.4 min<br />
0<br />
0 1024<br />
FL (AU)<br />
1e4<br />
FSC (AU, log)<br />
0<br />
0 1024<br />
FL (AU)<br />
1e4<br />
FSC (AU, log)<br />
FSC (AU, log)<br />
1e4<br />
31.0 min<br />
0<br />
0 1024<br />
FL (AU)<br />
1e4<br />
FSC (AU, log)<br />
FSC (AU, log)<br />
1e4<br />
56.8 min<br />
0<br />
0 1024<br />
FL (AU)<br />
1e4<br />
FSC (AU, log)<br />
FSC (AU, log)<br />
1e4<br />
82.4 min<br />
FSC (AU, log)<br />
1e4<br />
107.9 min<br />
0<br />
0 1024<br />
FL (AU)<br />
FSC (AU, log)<br />
1e4<br />
10.1 min<br />
0<br />
0 1024<br />
FL (AU)<br />
0<br />
0 1024<br />
FL (AU)<br />
FSC (AU, log)<br />
1e4<br />
36.1 min<br />
0<br />
0 1024<br />
FL (AU)<br />
FSC (AU, log)<br />
1e4<br />
61.9 min<br />
FSC (AU, log)<br />
1e4<br />
87.5 min<br />
0<br />
0 1024<br />
FL (AU)<br />
FSC (AU, log)<br />
1e4<br />
112.9 min<br />
0<br />
0 1024<br />
FL (AU)<br />
FSC (AU, log)<br />
15.3 min<br />
0<br />
0 1024<br />
FL (AU)<br />
41.3 min<br />
0<br />
0 1024<br />
FL (AU)<br />
67.1 min<br />
0<br />
0 1024<br />
FL (AU)<br />
92.5 min<br />
0<br />
0 1024<br />
FL (AU)<br />
118.0 min<br />
0<br />
0 1024<br />
FL (AU)<br />
1e4<br />
FSC (AU, log)<br />
20.5 min<br />
0<br />
0 1024<br />
FL (AU)<br />
1e4<br />
FSC (AU, log)<br />
46.5 min<br />
0<br />
0 1024<br />
FL (AU)<br />
1e4<br />
FSC (AU, log)<br />
72.2 min<br />
0<br />
0 1024<br />
FL (AU)<br />
1e4<br />
FSC (AU, log)<br />
97.7 min<br />
0<br />
0 1024<br />
FL (AU)<br />
1e4<br />
FSC (AU, log)<br />
122.9 min<br />
0<br />
0 1024<br />
FL (AU)<br />
Supplementary Figure 15: Forward scatter versus fluorescence distributions from timecourse flow cytometry<br />
analysis of the 2% arabinose <strong>and</strong> 2 mM IPTG sample. For each timepoint collected in this experiment,<br />
a density plot of forward scatter versus fluorescence is shown. (<strong>The</strong> mean fluorescence value over time is<br />
shown in Supplementary Fig. 9.) Fluorescence data were collected in linear mode, while forward scatter data<br />
were collected in logarithmic mode <strong>and</strong> low forward scatter noise was removed as described in Supplementary<br />
Methods.<br />
www.nature.com/nature<br />
20
doi: 10.1038/nature07389 SUPPLEMENTARY INFORMATION<br />
Modeling<br />
<strong>The</strong> underlying reactions of the stochastic <strong>and</strong> deterministic models<br />
Because of the dynamical nature of the <strong>oscillator</strong>s we have constructed, we have used mathematical<br />
modeling to both gain insight into <strong>and</strong> make predictions about their behavior. Our models<br />
are based on the following chemical reactions.<br />
<strong>The</strong> dynamics of the promoters are given by the following set of reactions:<br />
P a/r<br />
0,j<br />
P a/r<br />
i,0<br />
P a/r<br />
i,1<br />
+ a2<br />
+ r4<br />
+ r4<br />
P a/r<br />
1,2<br />
P a/r<br />
0,2<br />
P a/r<br />
L,0<br />
ka<br />
−⇀ ↽−<br />
k−a<br />
2kr<br />
−⇀ ↽−<br />
k−r<br />
kr<br />
−−⇀ ↽−−<br />
2k−r<br />
P a/r<br />
1,j<br />
P a/r<br />
i,1<br />
P a/r<br />
i,2<br />
kl −→ P a/r<br />
L,2 + a2<br />
k l<br />
−→ P a/r<br />
L,2<br />
k ul<br />
−→ P a/r<br />
0,0 ,<br />
j ∈ {0, 1, 2}<br />
i ∈ {0, 1}<br />
i ∈ {0, 1}<br />
where P a/r<br />
i,j represent the states of promoters on the (a)ctivator/(r)epressor plasmids with i ∈<br />
{0, 1} AraC dimers (a2) bound <strong>and</strong> j ∈ {0, 1, 2} LacI tetramers (r4) bound. <strong>The</strong> states P a/r<br />
L,j represent<br />
looped forms of the DNA, on which AraC is forbidden to bind. Once two LacI tetramers<br />
are bound, the plasmid may loop, forming a tight complex which must be unfolded to release<br />
repression. We did explore the inclusion of reverse reactions for the looping. However, when we<br />
assumed that the reverse reaction rates were small compared to the forward rates, the behavior<br />
of the system was unchanged.<br />
<strong>The</strong> next set of reactions govern the transcription, translation, protein folding, <strong>and</strong> multimerization<br />
of each <strong>gene</strong>/protein:<br />
www.nature.com/nature<br />
P a/r<br />
0,0<br />
P a/r<br />
1,0<br />
ma<br />
mr<br />
a u f<br />
r u f<br />
a + a<br />
r + r<br />
b a/r<br />
−−→ P a/r<br />
0,0 + m a/r<br />
αb a/r<br />
−−→ P a/r<br />
1,0 + m a/r<br />
ta<br />
−→ ma + a u f<br />
tr<br />
−→ mr + r u f<br />
k f a<br />
−→ a<br />
k f r<br />
−→ r<br />
k da<br />
−−⇀ ↽−−<br />
k−da<br />
k dr<br />
−−⇀ ↽−−<br />
k−dr<br />
21<br />
a2<br />
r2
doi: 10.1038/nature07389 SUPPLEMENTARY INFORMATION<br />
r2 + r2<br />
kt<br />
−⇀ ↽−<br />
k−t<br />
where m a/r represents the number of activator/repressor transcripts; a u f <strong>and</strong> r u f are the unfolded<br />
monomeric versions of the activator <strong>and</strong> repressor; a <strong>and</strong> r are the folded monomeric versions of<br />
activator <strong>and</strong> repressor; a2 <strong>and</strong> r2 are the dimeric versions of activator <strong>and</strong> repressor; <strong>and</strong> r4 is<br />
the tetrameric version of repressor.<br />
Finally, the mRNA transcripts decay exponentially, <strong>and</strong> all tagged forms of protein decay<br />
enzymatically according to the following set of reactions:<br />
where<br />
m a/r<br />
a u f<br />
r u f<br />
a<br />
r<br />
a2<br />
r2<br />
r4<br />
P a,r<br />
1,j<br />
P a,r<br />
i,1<br />
P a,r<br />
i,2<br />
P a,r<br />
L,2<br />
P a,r<br />
L,1<br />
d a/r<br />
−−→ ∅<br />
λ f (X)<br />
−−−→ ∅<br />
f (X)<br />
−−→ ∅<br />
λ f (X)<br />
−−−→ ∅<br />
f (X)<br />
−−→ ∅<br />
λ f (X)<br />
−−−→ ∅<br />
f (X)<br />
−−→ ∅<br />
f (X)<br />
−−→ ∅<br />
f (X)<br />
−−→ P a,r<br />
0,j<br />
f (X)<br />
−−→ P a,r<br />
i,0<br />
2 f (X)<br />
−−−→ P a,r<br />
i,1<br />
2ɛ f (X)<br />
−−−→ P a,r<br />
L,1<br />
ɛ f (X)<br />
−−−→ P a,r<br />
L,0 ,<br />
f (X) = γ<br />
r4 ,<br />
ce + X<br />
j ∈ {0, 1, 2}<br />
i ∈ {0, 1}<br />
i ∈ {0, 1}<br />
<strong>and</strong> X is the total number of ssrA tags in the system (one for each monomeric version, two for<br />
dimers, <strong>and</strong> four for tetramers, including proteins bound to operator sites).<br />
<strong>The</strong> parameters used for the simulations were: ba = br = 0.36 min −1 , α = 20, k−a = k−r =<br />
1.8 min −1 , ta = tr = 90 min −1 , da = dr = 0.54 min −1 , k f a = k f r = 0.9 min −1 , k da = k dr = kt =<br />
0.018 min −1 molecules −1 , k−da = k−dr = k−t = 0.00018 min −1 , k l = 0.36 min −1 , k ul = 0.18 min −1 ,<br />
γ = 1080 molecules/min, ce = 0.1 molecules, λ = 2.5, <strong>and</strong> ɛ = 0.2. <strong>The</strong> total number of activator<br />
plasmids was estimated to be Na = 50 <strong>and</strong> the number of repressor plasmids to be Nr = 25.<br />
<strong>The</strong> forward binding rates of the activator dimer <strong>and</strong> repressor tetramer to the operator sites are<br />
www.nature.com/nature<br />
22
doi: 10.1038/nature07389 SUPPLEMENTARY INFORMATION<br />
dependent upon the concentrations of arabinose <strong>and</strong> IPTG. Specifically, we defined:<br />
where C max<br />
r<br />
kr = k−r<br />
⎛<br />
<br />
⎜<br />
⎝<br />
C max<br />
r<br />
= 0.2 molecules −1 <strong>and</strong> C min<br />
r<br />
− C min<br />
<br />
r ·<br />
1 +<br />
1<br />
b1 [IPTG]<br />
kr1<br />
+ C min<br />
r<br />
⎞<br />
⎟<br />
⎠ , (1)<br />
= 0.01 molecules −1 are the maximum <strong>and</strong> minimum<br />
affinities of LacI tetramers to the binding site, [IPTG] is the IPTG concentration (in mM), kr1 =<br />
0.035 mM, <strong>and</strong> b1 = 2. Similarly, we defined:<br />
where C max<br />
a<br />
ka = k−a<br />
⎛<br />
<br />
⎜<br />
⎝<br />
C max<br />
a<br />
− C min<br />
<br />
a ·<br />
= 1 molecules −1 <strong>and</strong> C min<br />
a<br />
k c1<br />
a1<br />
[ara] c1<br />
·<br />
+ [ara]c1<br />
1 +<br />
1<br />
b2 [IPTG]<br />
kr2<br />
+ Cmin<br />
a<br />
⎞<br />
⎟<br />
⎠ , (2)<br />
= 0 molecules −1 are the maximum <strong>and</strong> minimum affinities<br />
of AraC dimers to the binding sites, [ara] is the concentration of arabinose (in % w/v), ka1 = 2.5%,<br />
kr2 = 1.8 mM, c1 = 2, <strong>and</strong> b2 = 2.<br />
<strong>The</strong> stochastic simulations were performed using Gillespie’s algorithm (Gillespie 1977) using<br />
custom written software in the C programming language, while deterministic simulations on the<br />
corresponding mass-action ODEs were performed using custom written software in matlab.<br />
<strong>The</strong>oretical predictions of oscillation period versus arabinose concentration<br />
<strong>The</strong>se computational models can also be used to calculate the oscillation period as a function of<br />
arabinose concentration. However, interpretation of the model is complicated by the existence<br />
of two bistable states. <strong>The</strong> first of these states corresponds to the large amplitude (<strong>and</strong> hence<br />
long period) oscillations that are the hallmark of the <strong>oscillator</strong>. In addition to this state, there<br />
is a second state, which for low arabinose levels is a stable limit cycle with very low amplitude<br />
<strong>and</strong> short period. <strong>The</strong> basin of attraction for this limit cycle appears to be very small, so that<br />
it is rarely (if ever) seen stochastically. <strong>The</strong> intrinsic noise of the system ensures that (1) the<br />
probability of reaching this state is small <strong>and</strong> (2) when the system does reside in this state, it<br />
does not remain there for long. This is illustrated in Supplementary Fig. 16A, which shows the<br />
peak-to-peak interval distribution for the stochastic model at 2 mM IPTG <strong>and</strong> 0.233% arabinose.<br />
<strong>The</strong> distribution is unimodal, with a mean that is equal to the period of the large amplitude<br />
oscillations observed in the deterministic model. As the arabinose concentration increases, the<br />
small amplitude limit cycle goes through a Hopf bifurcation near [ara] = 1.83%, above which<br />
the limit cycle becomes a stable fixed point. Stochastically, however, the intrinsic noise creates<br />
small-amplitude noise-induced oscillations whenever the system is near the fixed point. <strong>The</strong><br />
system will most often reside in the large amplitude oscillation state, but will occasionally jump<br />
to the noise-induced oscillations for brief periods of time. For example, Supplementary Fig. 17<br />
shows a typical trajectory obtained from stochastic simulations. <strong>The</strong> basin of attraction of these<br />
noise-induced oscillations becomes larger as the arabinose concentration is increased. This can<br />
be seen in Supplementary Fig. 16B–C, which show the peak-to-peak interval distributions for<br />
[ara] = 2.1% <strong>and</strong> [ara] = 3.5%, respectively. Just above the Hopf point (Supplementary Fig. 16B),<br />
www.nature.com/nature<br />
23
doi: 10.1038/nature07389 SUPPLEMENTARY INFORMATION<br />
the system resides mainly in the large amplitude state, with just a few incursions into the noiseinduced<br />
<strong>oscillator</strong>y state. For higher arabinose concentrations, however, the amount of time<br />
spent in the small amplitude state increases due to the enlargement of the basin of attraction<br />
(Supplementary Fig. 16C).<br />
Counts<br />
160<br />
80<br />
[ara]= 0.233 % [ara]= 2.100 % [ara]= 3.500 %<br />
A<br />
120<br />
B<br />
120<br />
C<br />
0<br />
0 10 20 30 40 50 60<br />
Peak-to-peak interval<br />
Counts<br />
80<br />
40<br />
0<br />
0 10 20 30 40 50 60<br />
Peak-to-peak interval<br />
Counts<br />
80<br />
40<br />
0<br />
0 10 20 30 40 50 60<br />
Peak-to-peak interval<br />
Supplementary Figure 16: Histograms of peak-to-peak intervals for the stochastic model of the <strong>oscillator</strong>.<br />
A, At low arabinose the distribution of peak-to-peak intervals is unimodal, with a mean equal to the<br />
deterministic period. B, When the arabinose concentration increases above 1.83%, bistable oscillations<br />
arise. <strong>The</strong> system stochastically switches between the two forms of oscillation, giving rise to a bimodal<br />
peak-to-peak interval distribution. C, As the arabinose concentration increases further, the amount of time<br />
spent in the low amplitude oscillation state increases.<br />
To obtain the stochastic period, we must make a decision as to what statistic of the peak-topeak<br />
distribution to measure. If we were to blindly calculate the mean of the distribution, the<br />
period would appear to decrease for increasing arabinose levels, since the time spent in the low<br />
amplitude (<strong>and</strong> hence low period) state becomes ever larger. This can be seen in Supplementary<br />
Fig. 18, which shows the period of the <strong>oscillator</strong> as a function of arabinose concentration at 2 mM<br />
IPTG. <strong>The</strong> experimentally measured values of the period are shown by green <strong>and</strong> red points,<br />
while the values predicted by the deterministic model (in the large-amplitude <strong>oscillator</strong>y state)<br />
are shown by the blue curve. Also shown are three possible measures of the period taken from<br />
the stochastic simulations. <strong>The</strong> gray triangles represent the value of the period obtained from<br />
taking the absolute mean of the peak-to-peak distribution. As expected, that measure of the<br />
period decreases at high arabinose levels.<br />
Another possible way to measure the mean period of the stochastic simulations is to ignore<br />
the low amplitude oscillations, <strong>and</strong> concentrate instead on the upper half of the peak-to-peak<br />
distribution. Roughly speaking, this can be done by ignoring all intervals that are less than<br />
30 min (provided the arabinose concentration is greater than 1.0%). Such a measure is roughly<br />
tantamount to measuring the mode of the whole distribution, provided more time is spent in<br />
the large amplitude state. <strong>The</strong> gray squares in Supplementary Fig. 18 show this measure of the<br />
period, <strong>and</strong> they match well with the deterministic period.<br />
It is interesting to point out that many of the experimentally measured values of the period in<br />
Supplementary Fig. 18 were obtained through timelapse flow cytometry. Because the amplitude<br />
of the long period state is so much higher than the short period state, it is unlikely that small<br />
amplitude oscillations would be detectable even if they were occurring. <strong>The</strong>refore, one final<br />
measure of the period may also be relevant. Time spent in the small amplitude region could<br />
www.nature.com/nature<br />
24
doi: 10.1038/nature07389 SUPPLEMENTARY INFORMATION<br />
Molecules<br />
2<br />
1<br />
x 104<br />
0<br />
0 200 400 600 800 1000<br />
Time (min)<br />
Supplementary Figure 17: An example of bistable oscillations in the stochastic model at high arabinose.<br />
Here [ara] = 3.5% <strong>and</strong> [IPTG] = 2 mM. <strong>The</strong> green curve is the number of free AraC dimers, while the red<br />
curve is the number of free LacI tetramers.<br />
be considered as additional time between the two large amplitude peaks which border it. If the<br />
low amplitude oscillations are ignored (i.e. not considered as peaks at all) <strong>and</strong> the resulting gaps<br />
added to the interval between the bordering peaks, the peak-to-peak distribution will be skewed<br />
towards the long period regime. <strong>The</strong> gray diamonds in Supplementary Fig. 18 show the resulting<br />
period of the stochastic simulations measured in this way.<br />
As of yet, we have no experimental evidence that bistable oscillations occur in the <strong>oscillator</strong>.<br />
As mentioned above, low amplitude oscillations will probably be washed out of any measure<br />
obtained through flow cytometry. Additionally, our single cell measurements obtained through<br />
microscopy at high arabinose concentrations have not revealed any cells oscillating with a low<br />
period. However, due to the low number of cells present in the imaging chamber, combined with<br />
the limited amount of time that reliable images can be taken, it may be that we have not been<br />
fortunate enough to observe such oscillations yet. It is also possible that the stochastic model is<br />
either in the wrong parameter regime or is missing an important component of the network that<br />
would preclude bistability. We plan on investigating this in future studies.<br />
<strong>The</strong>oretical predictions of oscillation period versus temperature<br />
It is well known that the cell cycle time of E. coli depends on temperature according to the formula<br />
www.nature.com/nature<br />
τcc(T) = τ re f exp Θcc<br />
25<br />
<br />
1/T − 1/Tre f , (3)
doi: 10.1038/nature07389 SUPPLEMENTARY INFORMATION<br />
Period (min)<br />
60<br />
50<br />
40<br />
30<br />
20<br />
10<br />
0 1 2 3<br />
Arabinose (%)<br />
Supplementary Figure 18: <strong>The</strong> period of oscillation as a function of arabinose concentration (at 2 mM<br />
IPTG). Shown are the experimentally measured periods obtained through timelapse flow cytometry (green<br />
circles) or single-cell microscopy (red diamonds), the periods predicted by the deterministic model (blue<br />
curve), <strong>and</strong> the periods predicted by the stochastic model, measured in three ways (gray symbols). <strong>The</strong><br />
triangles are the raw mean of the peak-to-peak distributions; the squares are the mean of the right h<strong>and</strong><br />
side of the distributions (roughly the mode); <strong>and</strong> the diamonds are the mean of peak-to-peak distributions<br />
in which only large amplitude peaks are considered (so that small amplitude oscillations are considered part<br />
of one long period oscillation).<br />
where τcc(T) is the cell cycle time as a function of temperature T, in Kelvin; τ re f is a reference<br />
time at the reference temperature T re f ; <strong>and</strong> Θcc is a constant. We measured the doubling times of<br />
the JS011 strain at various temperatures <strong>and</strong> calculated Θcc ≈ 8300 K.<br />
In order to predict the frequency of oscillations at various temperatures in the model, each<br />
rate constant must be multiplied by a similar Arrhenius constant, such that<br />
ki = k re f exp −Θi<br />
<br />
1/T − 1/Tre f , (4)<br />
where ki is the i th rate constant in the model, <strong>and</strong> Θi is the constant associated with that reaction.<br />
Each reaction will have a different value for Θi, <strong>and</strong> these constants are, in <strong>gene</strong>ral, not known.<br />
If, however, we assume that Θi ≈ Θcc∀ i, then calculating the temperature dependence of the<br />
model is equivalent to scaling time by the Arrhenius factor, since all affected model constants<br />
have an inverse time as part of their units. <strong>The</strong>refore, we can determine the period of the model<br />
from the equation<br />
P(T) = P re f exp Θcc<br />
<br />
1/T − 1/Tre f , (5)<br />
where P is the period <strong>and</strong> P re f is the period at T = T re f . Fig. 2c shows the model’s prediction of<br />
the period based on the reference temperature T re f = 30 ◦ C <strong>and</strong> reference period P re f = 69 min.<br />
www.nature.com/nature<br />
26
doi: 10.1038/nature07389 SUPPLEMENTARY INFORMATION<br />
Negative feedback-only oscillations<br />
Even without the positive feedback loop, the model of our circuit exhibits oscillations. However,<br />
their properties may depend on the specific way in which the negative feedback-only system<br />
is constructed. In particular, we find that the forward rate of DNA looping reaction kℓ plays an<br />
important role. We illustrate this with three different variants of a negative feedback-only system,<br />
with different values of kℓ. For all variants, we set the number of plasmids that produce AraC to<br />
zero (i.e. Na = 0), ensuring that AraC is not produced <strong>and</strong> that repressor does not interact with<br />
DNAs residing on those plasmids. We also increase the basal transcription rate of LacI by setting<br />
br = 10 min −1 . Other parameters coincide with the listed values for the dual-feedback model.<br />
Our first example of a negative feedback-only system is characterized by a lack of DNA looping<br />
(kℓ = 0) <strong>and</strong> roughly corresponds to our experimental negative feedback-only system. A typical<br />
time series obtained from this stochastic model is shown in Supplementary Fig. 19A. As seen<br />
from the Figure, the amplitude of these oscillations is relatively small, <strong>and</strong> the LacI concentration<br />
does not go all the way down to zero in the troughs of oscillations. <strong>The</strong> oscillations are noticeably<br />
less regular than those in the original dual-feedback model. In fact, for [IPTG] > 0.2 mM, the oscillations<br />
decay in the deterministic version of the model <strong>and</strong> are persistent only in stochastic<br />
simulations. However, for very small values of [IPTG] < 0.2 mM, large-amplitude oscillations<br />
are observed (not shown). We examined the system for a number of values of [IPTG] up to 1 mM<br />
<strong>and</strong> found that the characteristic period of oscillations was remarkably less <strong>tunable</strong> than in the<br />
dual-feedback <strong>oscillator</strong> model (Supplementary Fig. 20). <strong>The</strong>se features are consistent with our<br />
experimental findings for the p LlacO-1 promoter that lacks DNA looping <strong>and</strong> is transcribed at a<br />
high level.<br />
In our second example of a negative feedback-only system, DNA looping is present with the<br />
same rate, kℓ, as in the original dual-feedback model. In this case, we observe larger <strong>and</strong> more<br />
regular LacI oscillations for a wide range of [IPTG] in which LacI goes to zero in the troughs of<br />
oscillations (Supplementary Fig. 19B). However, the period of oscillations is still not sensitive to<br />
varying [IPTG] concentration (Supplementary Fig. 20).<br />
Finally, we tested the model with kℓ that is 1000 times larger than our nominal value for<br />
the dual-feedback model. In this case, large-amplitude <strong>and</strong> regular LacI oscillations are again<br />
observed for a wide range of [IPTG] (Supplementary Fig. 19C). <strong>The</strong> period of these oscillations<br />
is somewhat longer than for original kℓ <strong>and</strong> remains only weakly <strong>tunable</strong> with respect to varying<br />
[IPTG] (Supplementary Fig. 20).<br />
We conclude from these simulations that negative feedback-only systems may lead to oscillations.<br />
However, the properties of these oscillations vary depending on system parameters. <strong>The</strong><br />
negative feedback-only system oscillates only weakly in the experiments, in agreement with the<br />
model without DNA looping. <strong>The</strong> addition of a positive feedback loop in this case leads to an<br />
increased <strong>robust</strong>ness of such oscillations. However, due to other possible differences between<br />
the p lac/ara-1 promoter in the experimental dual-feedback system <strong>and</strong> the p LlacO-1 promoter in the<br />
experimental negative feedback-only system, further experimental work is needed to calibrate<br />
the model <strong>and</strong> test these predictions. Furthermore, it appears that for other experimental implementations,<br />
negative feedback-only systems may by themselves <strong>gene</strong>rate large-amplitude <strong>robust</strong><br />
oscillations. A quest for such simplified designs is currently underway.<br />
www.nature.com/nature<br />
27
doi: 10.1038/nature07389 SUPPLEMENTARY INFORMATION<br />
Molecules<br />
Molecules<br />
Molecules<br />
2000<br />
1500<br />
1000<br />
500<br />
4000<br />
3000<br />
2000<br />
1000<br />
4000<br />
3000<br />
2000<br />
1000<br />
A<br />
0<br />
0 100 200 300<br />
Time (min)<br />
400 500 600<br />
B<br />
0<br />
0 100 200 300<br />
Time (min)<br />
400 500 600<br />
C<br />
0<br />
0 100 200 300<br />
Time (min)<br />
400 500 600<br />
Supplementary Figure 19: Characteristic time series of free LacI tetramer obtained from negative feedbackonly<br />
stochastic models. Here br = 10 min −1 <strong>and</strong> [IPTG] = 2.0 mM. Negative feedback-only systems were<br />
tested for three different values of the DNA looping rate constant k ℓ: A, k ℓ = 0, i.e. when DNA looping is<br />
not present; B, k ℓ = 0.36 min −1 , the value used in the dual-feedback model; C, k ℓ = 360 min −1 .<br />
On the <strong>robust</strong>ness of oscillations<br />
<strong>The</strong> formulation of design principles that lead to the creation of <strong>robust</strong> <strong>gene</strong> circuits is a major<br />
goal in <strong>synthetic</strong> biology. Robust circuits are insensitive to the precise tuning of system parameters<br />
<strong>and</strong> thus can cope with the natural variability found in vivo (Elowitz et al. 2002). <strong>The</strong> model<br />
of the bacterial <strong>oscillator</strong> proposed here suggests that delay in negative feedback may be key in<br />
explaining the experimentally observed <strong>robust</strong>ness of oscillations. Such delay may arise from a<br />
variety of intermediate steps, e.g. multimerization, folding, <strong>and</strong> maturation, which combine into<br />
a net delay that promotes <strong>oscillator</strong>y behavior. <strong>The</strong> sharpness of a distributed delay may also be<br />
relevant in this regard (Rateitschak <strong>and</strong> Wolkenhauer 2007).<br />
<strong>The</strong> relationship between feedback delay <strong>and</strong> <strong>robust</strong>ness can be simply traced in the case<br />
of certain delayed negative feedback <strong>gene</strong> circuits. Such circuits include the negative feedback<br />
<strong>oscillator</strong> described here with constitutive activator <strong>and</strong> no positive feedback. A minimal model<br />
in this case is the first-order delay-differential equation<br />
www.nature.com/nature<br />
dy(t)<br />
dt =<br />
<br />
K<br />
1 + y(t−τ)<br />
C0<br />
28<br />
n − γ y(t) , (6)
doi: 10.1038/nature07389 SUPPLEMENTARY INFORMATION<br />
Period (min)<br />
25<br />
20<br />
15<br />
10<br />
5<br />
k l = 1000*k l, original (deterministic)<br />
k l = k l, original (deterministic)<br />
k l = 0 (stochastic)<br />
0<br />
0 0.2 0.4 0.6 0.8 1<br />
IPTG (mM)<br />
Supplementary Figure 20: Oscillation period versus [IPTG] for the negative feedback-only simulations<br />
shown in Supplementary Fig. 19. k ℓ,original is the value of k ℓ used in the dual-feedback model. As [IPTG]<br />
is scanned, the period varies less than what was seen experimentally in the dual-feedback system. For<br />
the k ℓ = 0 case, oscillations in the deterministic model decay at [IPTG] > 0.2 mM <strong>and</strong> are only observed<br />
in stochastic simulations; therefore, we define the period as the maximum in the power spectrum of the<br />
stochastic trajectory.<br />
with y(t) the amount of some repressor at time t, K the unrepressed production rate, C0 an<br />
affinity constant, <strong>and</strong> γ a first-order degradation rate. Analytical results for such delayed negative<br />
feedback systems are well known (Bliss et al. 1982; Mackey <strong>and</strong> Nechaeva 1995; Bratsun et al.<br />
2005), <strong>and</strong> we do not re-derive them here. If we define y0 to be the unique fixed point for Eq. 6, the<br />
bifurcation diagram can be represented in terms of the variables γτ <strong>and</strong> y0/C0 (Supplementary<br />
Fig. 21). An important conclusion derived from this bifurcation diagram is that increasing the<br />
delay (for some fixed γ) exp<strong>and</strong>s the region of parameter space in which the system exhibits<br />
stable oscillations. In this sense, increasing intracellular delay leads to enhanced <strong>robust</strong>ness of<br />
stable oscillations in delayed negative feedback systems.<br />
Although our full dual-feedback model contains richer dynamics than the delayed negative<br />
feedback model briefly described above, conceptual similarity between their basic mechanisms<br />
suggests that increasing delay will enhance <strong>robust</strong>ness. <strong>The</strong> <strong>robust</strong>ness of the full model was<br />
numerically explored by probing nearby parameter sets <strong>and</strong> determining if these sets display <strong>oscillator</strong>y<br />
behavior (see Supplementary Fig. 22 for details of the numerical analysis). One result of<br />
this numerical investigation is that the fraction of accessible parameter space (i.e. near the listed<br />
parameter values) exhibiting stable oscillations is above 50% for most points taken along the arabinose<br />
transect at 2 mM IPTG. This result should be contrasted to the exponentially small (in the<br />
www.nature.com/nature<br />
29
doi: 10.1038/nature07389 SUPPLEMENTARY INFORMATION<br />
Stable Limit Cycle<br />
Stable Fixed Point<br />
Supplementary Figure 21: <strong>The</strong> bifurcation diagram for the delayed negative feedback system. In this<br />
case, n = 2. <strong>The</strong> bifurcation boundary approaches the asymptotes (marked with dashed lines) defined by<br />
γτ = arccos (−1/n)/ √ n 2 − 1 <strong>and</strong> y0/C0 = 1/(n − 1). Notice that the bifurcation boundary is monotonically<br />
decreasing in y0/C0 with increasing γτ. Since y0 is independent of τ (but not γ), this monotonicity<br />
implies that the region of parameter space that supports stable oscillations monotonically increases with<br />
increasing τ <strong>and</strong> fixed γ.<br />
number of varied parameters) hypervolume that could be expected when multiple parameters<br />
must be accurately <strong>and</strong> independently tuned. A second result of this numerical investigation,<br />
which corroborates our discussion of the above minimal model, is the tendency for an increased<br />
<strong>robust</strong>ness with increasing effective delay.<br />
While we have not rigorously proven a <strong>gene</strong>ral causal relation between delay <strong>and</strong> enhanced<br />
<strong>robust</strong>ness of oscillations, the above analytic <strong>and</strong> numerical evidence suggests that such a relation<br />
holds when the core of a <strong>gene</strong> <strong>oscillator</strong> comprises a delayed negative feedback loop. <strong>The</strong>re may<br />
be value in basing the designs of future <strong>synthetic</strong> <strong>gene</strong> <strong>oscillator</strong>s on such a principle, particularly<br />
if methods arise that allow the engineering of a sharply distributed delay between transcription<br />
<strong>and</strong> feedback.<br />
www.nature.com/nature<br />
30
doi: 10.1038/nature07389 SUPPLEMENTARY INFORMATION<br />
fraction Fraction oscillating<br />
1<br />
0.8<br />
0.6<br />
0.4<br />
0.2<br />
0<br />
0.1 times original delay−related rates<br />
original parameters<br />
10 times original delay−related rates<br />
100 times original delay−related rates<br />
0 0.5 1 1.5 2 2.5 3 3.5<br />
Arabinose<br />
ARA<br />
(%)<br />
Supplementary Figure 22: A numerical investigation of the effect of changing intracellular delay on<br />
<strong>robust</strong>ness. This was investigated by probing the nearby parameter space for <strong>oscillator</strong>y behavior. All<br />
parameters were r<strong>and</strong>omly sampled independently <strong>and</strong> uniformly (in log-space) between half <strong>and</strong> double<br />
their listed values. This approach was chosen to avoid preferential treatment of a particular set of the 21<br />
varied parameters (Gutenkunst et al. 2007): k ℓ, k uℓ, ba, br, α, ta, tr, k f a, k f r, k da, k −da, k dr, k −dr, kt, k−t,<br />
da, dr, γ, ce, ɛ, λ. Initial conditions consisted of all promoters in the looped state with two bound repressor<br />
proteins (“PL,2”), zero mRNA levels, <strong>and</strong> zero protein levels for all but folded monomeric forms (“a” <strong>and</strong> “r”),<br />
which were uniformly sampled between 0 <strong>and</strong> 500 for both activator <strong>and</strong> repressor. A computed trajectory<br />
was determined to not be <strong>oscillator</strong>y if, after a transient of 2000 min, the maximal variation in the number<br />
of folded monomeric activator (“a”) was less than 0.1 in a subsequent 400 min of simulation. <strong>The</strong> plot<br />
displays the fraction of <strong>oscillator</strong>y states for varying levels of arabinose <strong>and</strong> 2.0 mM IPTG. This procedure<br />
was repeated for different mean values of certain delay-related rates, being done by multiplying the listed<br />
parameter values for the forward rates of folding, dimerization, <strong>and</strong> tetramerization by some common value<br />
(listed in the figure legend). Error bars were set to the maximum st<strong>and</strong>ard deviation σmax = 0.5/ √ N for<br />
the average of N = 200 Bernoulli trials. <strong>The</strong> data supports that decreasing the delay in the system tends to<br />
reduce the fraction of <strong>oscillator</strong>y states in nearby parameter space, while increasing delay has the opposite<br />
effect.<br />
www.nature.com/nature<br />
31
doi: 10.1038/nature07389 SUPPLEMENTARY INFORMATION<br />
References<br />
Andersen, J. B., Sternberg, C., Poulsen, L. K., Bjorn, S. P., Givskov, M. <strong>and</strong> Molin, S. (1998).<br />
New unstable variants of green fluorescent protein for studies of transient <strong>gene</strong> expression in<br />
bacteria. Appl Environ Microbiol 64:2240–2246.<br />
Atlung, T., Christensen, B. B. <strong>and</strong> Hansen, F. G. (1999). Role of the Rom protein in copy number<br />
control of plasmid pBR322 at different growth rates in Escherichia coli K-12. Plasmid 41:110–119.<br />
Baba, T., Ara, T., Hasegawa, M., Takai, Y., Okumura, Y., Baba, M., Datsenko, K. A., Tomita, M.,<br />
Wanner, B. L. <strong>and</strong> Mori, H. (2006). Construction of Escherichia coli K-12 in-frame, single-<strong>gene</strong><br />
knockout mutants: the Keio collection. Mol Syst Biol 2:2006.0008.<br />
Bendib, S. <strong>and</strong> Français, O. (2001). Analytical study of microchannel <strong>and</strong> passive microvalve<br />
“application to micropump simulator”. In Design, Characterisation, <strong>and</strong> Packaging for MEMS <strong>and</strong><br />
Microelectronics 2001, pp. 283–91, Adelaide, Australia.<br />
Bliss, R. D., Painter, P. R. <strong>and</strong> Marr, A. G. (1982). Role of feedback inhibition in stabilizing the<br />
classical operon. J <strong>The</strong>or Biol 97:177–193.<br />
Bratsun, D., Volfson, D., Tsimring, L. S. <strong>and</strong> Hasty, J. (2005). Delay-induced stochastic oscillations<br />
in <strong>gene</strong> regulation. PNAS 102:14593–14598.<br />
Chang, A. C. <strong>and</strong> Cohen, S. N. (1978). Construction <strong>and</strong> characterization of amplifiable multicopy<br />
DNA cloning vehicles derived from the P15A cryptic miniplasmid. J Bacteriol 134:1141–1156.<br />
Cookson, S., Ostroff, N., Pang, W. L., Volfson, D. <strong>and</strong> Hasty, J. (2005). Monitoring dynamics of<br />
single-cell <strong>gene</strong> expression over multiple cell cycles. Mol Syst Biol 1:msb4100032–E1–6.<br />
Cormack, B. P., Valdivia, R. H. <strong>and</strong> Falkow, S. (1996). FACS-optimized mutants of the green<br />
fluorescent protein (GFP). Gene 173:33–38.<br />
Datsenko, K. A. <strong>and</strong> Wanner, B. L. (2000). One-step inactivation of chromosomal <strong>gene</strong>s in Escherichia<br />
coli K-12 using PCR products. Proc Natl Acad Sci U S A 97:6640–6645.<br />
Duffy, D. C., McDonald, J. C., Schueller, O. J. A. <strong>and</strong> Whitesides, G. M. (1998). Rapid prototyping<br />
of microfluidic systems in poly(dimethylsiloxane). Anal Chem 70:4974–84.<br />
Duffy, D. C., Schueller, O. J. A., Brittain, S. T. <strong>and</strong> Whitesides, G. M. (1999). Rapid prototyping of<br />
microfluidic switches in poly(dimethyl siloxane) <strong>and</strong> their actuation by electro-osmotic flow. J<br />
Micromech Microeng 9:211–7.<br />
Elowitz, M. B., Levine, A. J., Siggia, E. D. <strong>and</strong> Swain, P. S. (2002). Stochastic <strong>gene</strong> expression in a<br />
single cell. Science 297:1183–1186.<br />
Gillespie, D. T. (1977). Exact stochastic simulation of coupled chemical-reactions. J Phys Chem<br />
81:2340–2361.<br />
www.nature.com/nature<br />
32
doi: 10.1038/nature07389 SUPPLEMENTARY INFORMATION<br />
Groisman, A., Lobo, C., Cho, H., Campbell, J. K., Dufour, Y. S., Stevens, A. M. <strong>and</strong> Levchenko,<br />
A. (2005). A microfluidic chemostat for experiments with bacterial <strong>and</strong> yeast cells. Nat Methods<br />
2:685–9.<br />
Gutenkunst, R. N., Waterfall, J. J., Casey, F. P., Brown, K. S., Myers, C. R. <strong>and</strong> Sethna, J. P. (2007).<br />
Universally sloppy parameter sensitivities in systems biology models. PLoS Comp Bio 3:1871–<br />
1878.<br />
Kahn, M., Kolter, R., Thomas, C., Figurski, D., Meyer, R., Remaut, E. <strong>and</strong> Helinski, D. R. (1979).<br />
Plasmid cloning vehicles derived from plasmids ColE1, F, R6K, <strong>and</strong> RK2. Methods Enzymol<br />
68:268–280.<br />
Lee, S. K., Chou, H. H., Pfleger, B. F., Newman, J. D., Yoshikuni, Y. <strong>and</strong> Keasling, J. D. (2007).<br />
Directed evolution of arac for improved compatibility of arabinose- <strong>and</strong> lactose-inducible promoters.<br />
Appl Environ Microbiol 73:5711–5715.<br />
Lutz, R. <strong>and</strong> Bujard, H. (1997). Independent <strong>and</strong> tight regulation of transcriptional units in Escherichia<br />
coli via the LacR/O, the TetR/O <strong>and</strong> AraC/I1-I2 regulatory elements. Nucleic Acids Res<br />
25:1203–1210.<br />
Mackey, M. C. <strong>and</strong> Nechaeva, I. G. (1995). Solution moment stability in stochastic differentialdelay<br />
equations. Phys Rev E 52:3366–3376.<br />
Miller, J. H. (1992). A short course in bacterial <strong>gene</strong>tics. Cold Spring Harbor Laboratory Press.<br />
Rateitschak, K. <strong>and</strong> Wolkenhauer, O. (2007). Intracellular delay limits cyclic changes in <strong>gene</strong><br />
expression. Math Biosci 205:163–179.<br />
Shaner, N. C., Steinbach, P. A. <strong>and</strong> Tsien, R. Y. (2005). A guide to choosing fluorescent proteins.<br />
Nat Methods 2:905–909.<br />
Sheff, M. A. <strong>and</strong> Thorn, K. S. (2004). Optimized cassettes for fluorescent protein tagging in Saccharomyces<br />
cerevisiae. Yeast 21:661–670.<br />
Sia, S. K. <strong>and</strong> Whitesides, G. M. (2003). Microfluidic devices fabricated in poly(dimethylsiloxane)<br />
for biological studies. Electrophoresis 24:3563–76.<br />
Siegele, D. A. <strong>and</strong> Hu, J. C. (1997). Gene expression from plasmids containing the araBAD promoter<br />
at subsaturating inducer concentrations represents mixed populations. Proc Natl Acad<br />
Sci U S A 94:8168–8172.<br />
Tesla, N. (1920). U. S. Patent No. 1,329,559.<br />
Unger, M. A., Chou, H. P., Thorsen, T., Scherer, A. <strong>and</strong> Quake, S. R. (2000). Monolithic microfabricated<br />
valves <strong>and</strong> pumps by multilayer soft lithography. Science 288:113–6.<br />
Whitesides, G. M., Ostuni, E., Takayama, S., Jiang, X. <strong>and</strong> Ingber, D. E. (2001). Soft lithography<br />
in biology <strong>and</strong> biochemistry. Annu Rev Biomed Eng 3:335–73.<br />
Zacharias, D. A., Violin, J. D., Newton, A. C. <strong>and</strong> Tsien, R. Y. (2002). Partitioning of lipid-modified<br />
monomeric GFPs into membrane microdomains of live cells. Science 296:913–916.<br />
www.nature.com/nature<br />
33