A fast, robust and tunable synthetic gene oscillator - The BioCircuits ...
A fast, robust and tunable synthetic gene oscillator - The BioCircuits ...
A fast, robust and tunable synthetic gene oscillator - The BioCircuits ...

You also want an ePaper? Increase the reach of your titles
YUMPU automatically turns print PDFs into web optimized ePapers that Google loves.
NATURE | Vol 456 |27 November 2008 LETTERS<br />
than 99% of the cells showed oscillations with a period of approximately<br />
40 min (Fig. 1b, g, Supplementary Table 1 <strong>and</strong> Supplementary<br />
Movie 1). <strong>The</strong> highly dynamic nature of the <strong>oscillator</strong> components is<br />
shown by the rapid decay of green fluorescent protein (GFP) signal,<br />
which drops from peak to trough in less than 10 min (Fig. 1b). <strong>The</strong><br />
<strong>oscillator</strong>y phase was heritable between daughter cells, which resulted<br />
in synchronized oscillations in areas of the microcolony derived from<br />
a common cell. This synchrony was limited to a few periods, presumably<br />
owing to <strong>oscillator</strong>y phase diffusion. We used a microfluidic<br />
device with a laminar boundary switch upstream of the growth<br />
chamber to investigate the initiation of synchronized oscillations<br />
(Supplementary Fig. 2c, d). Cells grown in the absence of inducer<br />
initiated oscillations in a synchronous manner on the addition of<br />
inducer (Supplementary Movie 10), which suggested the possibility<br />
of using flow cytometry to characterize the <strong>oscillator</strong> further. Flow<br />
cytometry of samples continuously collected from a culture in logarithmic<br />
growth that had been induced with 0.7% arabinose <strong>and</strong><br />
2 mM IPTG showed oscillations in mean cell fluorescence<br />
(Supplementary Fig. 8). Induction of oscillation was very quick (less<br />
than 5 min) <strong>and</strong> initially well-synchronized. <strong>The</strong> amplitude of these<br />
bulk oscillations decayed as the experiment progressed, as expected<br />
from the desynchronization of individual cells in the colony<br />
(Supplementary Information). However, the period obtained from<br />
the flow cytometry method (green data points in all figures) compared<br />
favourably to that obtained from single cells using microscopy<br />
(red data points in all figures).<br />
<strong>The</strong> <strong>oscillator</strong> was extremely <strong>robust</strong> over an extensive range of<br />
inducer conditions <strong>and</strong> temperatures. At 0.7% arabinose <strong>and</strong> 37 uC,<br />
almost every observed cell oscillated (Supplementary Table 1) at all<br />
IPTG concentrations examined (Fig. 1b–h <strong>and</strong> Supplementary<br />
Movies 1–8). Varying the IPTG concentration allowed for the tuning<br />
of the <strong>oscillator</strong> period (Fig. 2a), particularly at low IPTG concentrations.<br />
<strong>The</strong> period decreased at high IPTG concentrations, <strong>and</strong> subsequent<br />
characterization of the promoter revealed that this nonmonotonic<br />
behaviour is probably caused by IPTG interference with<br />
AraC activation 15 (Supplementary Information). <strong>The</strong> cell doubling<br />
time on the microfluidic device remained largely steady between<br />
experiments, ranging from 22.3 min to 27.6 min at 37 uC <strong>and</strong> showing<br />
little correlation to IPTG concentration (R 2 5 0.132). Individual cell<br />
fluorescence trajectories showed a gradual increase in <strong>oscillator</strong>y<br />
Oscillatory period (min)<br />
60<br />
a<br />
37 °C (G = 22–24 min)<br />
0.7% arabinose<br />
Oscillatory period (min)<br />
60<br />
b<br />
37 °C (G = 22–24 min)<br />
0<br />
0 10 20<br />
IPTG (mM)<br />
30<br />
0<br />
0<br />
2 mM IPTG<br />
1 2<br />
Arabinose (%)<br />
3<br />
120<br />
c<br />
120<br />
d<br />
0.7% arabinose<br />
0.7% arabinose<br />
0<br />
20<br />
2 mM IPTG<br />
30<br />
Temperature (°C)<br />
40<br />
0<br />
0<br />
2 mM IPTG<br />
60<br />
120<br />
Cell doubling period (min)<br />
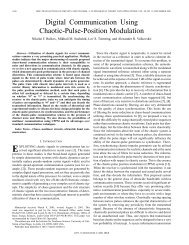
Figure 2 | Robust oscillations. a–c, Oscillatory periods on transects with<br />
0.7% arabinose <strong>and</strong> varying IPTG (a), 2 mM IPTG <strong>and</strong> varying arabinose<br />
(b), or 0.7% arabinose, 2 mM IPTG, <strong>and</strong> varying temperature (c). Mean<br />
periods from single-cell microscopy (red diamonds, mean 6 s.d.) or flow<br />
cytometry (green circles) are shown. Black curves are trend lines in a <strong>and</strong><br />
b, or represent the theoretical prediction based on reference values at 30 uC<br />
in c (see Supplementary Information). Samples grown in minimal medium<br />
rather than LB are indicated by crosses. G represents the cell doubling<br />
period. d, Oscillatory period <strong>and</strong> cell division time increase monotonically as<br />
the growth temperature decreases. Symbols are as described above, <strong>and</strong> the<br />
black line is a linear regression of samples grown in LB.<br />
©2008 Macmillan Publishers Limited. All rights reserved<br />
period as the cells were imaged on the microfluidic device (Supplementary<br />
Fig. 4). This increase was not seen in doubling times, implying<br />
that the cells were not experiencing nutritional difficulties<br />
or environmental stress that might cause an alteration in <strong>oscillator</strong><br />
behaviour.<br />
To explore further the <strong>robust</strong>ness of the <strong>oscillator</strong>, we investigated<br />
the effect of varying arabinose, temperature <strong>and</strong> the media source. At a<br />
fixed value of 2 mM IPTG <strong>and</strong> at 37 uC, the <strong>oscillator</strong>y period can be<br />
tuned from 13 min to 58 min by varying the arabinose level from 0.1%<br />
to 3.0% (Fig. 2b). Cells grown in the absence of arabinose did not<br />
express measurable levels of GFP in single-cell microscopy or flow<br />
cytometry experiments, <strong>and</strong> high levels of arabinose seemed to saturate<br />
the system. We observed sustained oscillations at a range of temperatures<br />
from 25 uC to37uC, with a decreasing period as a function of<br />
temperature (Fig. 2c). <strong>The</strong> cell doubling time also decreased with<br />
temperature, as expected, <strong>and</strong> the <strong>oscillator</strong>y period increased monotonically<br />
with cell doubling time (Fig. 2d). <strong>The</strong> <strong>oscillator</strong> also functioned<br />
in minimal A medium with 2 g l 21 glucose (Fig. 2c, d).<br />
Although the cell doubling time in minimal medium was significantly<br />
longer than in LB-Miller formulation lysogeny broth (LB) (80–90 min<br />
versus 22–24 min at 37 uC), the period in the minimal medium was<br />
very similar to that in LB (Fig. 2c, d). This result, together with the<br />
strong dependence of the period on IPTG <strong>and</strong> arabinose concentration<br />
(at constant cellular doubling times), demonstrates that the <strong>synthetic</strong><br />
<strong>oscillator</strong> is not strongly coupled to the cell cycle. <strong>The</strong> similar dependence<br />
of the period <strong>and</strong> the doubling time on the temperature seems to<br />
be due to the thermodynamic change of the rate constants affecting all<br />
cellular processes.<br />
<strong>The</strong> <strong>oscillator</strong> was constructed according to design principles determined<br />
from previous theoretical work 1 . However, we found that this<br />
original model failed to describe two important aspects of the experiments.<br />
First, the model could not describe the observed functional<br />
dependence of the period on inducer levels. Second, <strong>and</strong> perhaps most<br />
importantly, because careful parameter tuning was necessary for<br />
oscillations in the original model, it was not able to describe the <strong>robust</strong><br />
behaviour demonstrated in the experiments. This suggests that only a<br />
small region of inducer space should support oscillations, in contrast<br />
to the <strong>robust</strong> behaviour demonstrated in the experiments. <strong>The</strong>se<br />
shortcomings forced a re-evaluation of the derivation of the <strong>oscillator</strong><br />
equations, <strong>and</strong> led to a new computational model that more<br />
accurately described the experimental observations. <strong>The</strong> new model<br />
incorporates the same coupled positive <strong>and</strong> negative feedback architecture,<br />
but includes details that were omitted from the previous<br />
model. In particular, we found that directly modelling processes such<br />
as protein–DNA binding, multimerization, translation, DNA looping,<br />
enzymatic degradation <strong>and</strong> protein folding greatly increased the<br />
accuracy of the model. <strong>The</strong> result is a computational model that is very<br />
<strong>robust</strong> to parameter variations <strong>and</strong> correctly describes the dynamics<br />
of the <strong>oscillator</strong> for a large range of IPTG <strong>and</strong> arabinose concentrations<br />
(see Box 1 <strong>and</strong> Supplementary Information).<br />
In examining our refined model, we discovered another region in<br />
parameter space that would support <strong>oscillator</strong>y behaviour. Our<br />
model predicted that a constantly activated system with repression<br />
controlled by a negative feedback loop could produce oscillations in<br />
the absence of positive feedback (Supplementary Fig. 19). It has been<br />
proposed that negative feedback <strong>gene</strong> networks can oscillate as long<br />
as there is delay in the feedback 16,17 , <strong>and</strong>, although there is no explicit<br />
delay in our model, the intermediate steps of translation, protein<br />
folding <strong>and</strong> multimerization of LacI provide an effective form of<br />
delay 18 that is sufficient to support oscillations. We constructed this<br />
system (denoted JS013) in E. coli using a hybrid promoter, pLlacO-1<br />
(ref. 14), that is activated in the absence of LacI (or presence of IPTG)<br />
to drive both lacI <strong>and</strong> yemGFP expression (Fig. 3a). We observed<br />
oscillations in these cells when examined by single-cell microscopy<br />
under inducing conditions (Fig. 3b, Supplementary Fig. 5 <strong>and</strong><br />
Supplementary Movie 11). <strong>The</strong>se oscillations were not as distinct<br />
or regular as in the dual-feedback <strong>oscillator</strong>, <strong>and</strong> they did not always<br />
517