Monitoring shared processor pools with lpar2rrd
Monitoring shared processor pools with lpar2rrd
Monitoring shared processor pools with lpar2rrd

Create successful ePaper yourself
Turn your PDF publications into a flip-book with our unique Google optimized e-Paper software.
<strong>Monitoring</strong> <strong>shared</strong> <strong>processor</strong> <strong>pools</strong> <strong>with</strong> <strong>lpar2rrd</strong><br />
Monitor and report on <strong>shared</strong> <strong>processor</strong> usage on IBM Power<br />
Systems<br />
Skill Level: Introductory<br />
Chris Gibson<br />
AIX Specialist<br />
Southern Cross Computer Systems<br />
18 May 2010<br />
This article describes how to use the <strong>lpar2rrd</strong> tool to monitor and report on <strong>shared</strong><br />
<strong>processor</strong> pool usage. It is based on a customer's experience <strong>with</strong> the tool.<br />
Introduction<br />
In this article, I will share <strong>with</strong> you some of the benefits of using the free <strong>lpar2rrd</strong><br />
tool. After using this for several years, I have come to rely on it as an excellent<br />
monitoring and reporting tool for <strong>shared</strong> <strong>processor</strong> <strong>pools</strong> on IBM Power based<br />
systems. I will briefly describe the <strong>lpar2rrd</strong> tool and illustrate how I implemented it to<br />
monitor the <strong>shared</strong> <strong>processor</strong> pool across four Power6 systems.<br />
I love this tool as it allows me to quickly review and report on <strong>shared</strong> <strong>processor</strong> pool<br />
usage across several systems. Since I started using it almost 3 years ago, I have<br />
tried to spread the word about this amazing tool. I mention it to anyone who is willing<br />
to listen and I am surprised by how many people are not aware of this tool and what<br />
it can do.<br />
I am hoping this article will encourage others to take it up in their environment.<br />
Perhaps one day it may be officially supported by IBM, just like the nmon utility. One<br />
can only hope.<br />
<strong>Monitoring</strong> <strong>shared</strong> <strong>processor</strong> <strong>pools</strong> <strong>with</strong> <strong>lpar2rrd</strong> Trademarks<br />
© Copyright IBM Corporation 2010. All rights reserved. Page 1 of 17
developerWorks® ibm.com/developerWorks<br />
Overview of <strong>lpar2rrd</strong><br />
The <strong>lpar2rrd</strong> tool has been available for several years now (going back to 2006).<br />
When I first looked at it, I liked the idea of what it promised, such as monitoring and<br />
reporting for a <strong>shared</strong> <strong>processor</strong> pool. However, the tool was still in its infancy, and I<br />
had a few issues getting it up and running. When I looked at it 12 months later,<br />
things had certainly changed. It had improved substantially, and I was able to get the<br />
tool up and running very quickly (in about 30 minutes).<br />
I was amazed by the information it was able to provide. When I considered how I<br />
had previously been monitoring and reporting on my <strong>shared</strong> <strong>processor</strong> pool, this was<br />
a breath of fresh air.<br />
We can thank Pavel Hampl, an IBM employee in the Czech Republic, for this<br />
amazing project. He is the creator of the tool, and he has done a great job of pulling<br />
it altogether and continuing to develop and improve this utility.<br />
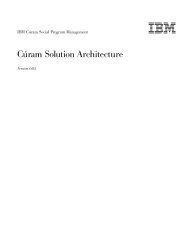
The <strong>lpar2rrd</strong> tool is capable of collecting historical CPU utilization data for <strong>shared</strong><br />
<strong>processor</strong> partitions and systems. It is intended for use <strong>with</strong> HMC attached,<br />
micro-partitioned systems <strong>with</strong> <strong>shared</strong> <strong>processor</strong> <strong>pools</strong>. It is agentless, so there is no<br />
need to install an agent on each LPAR.<br />
Utilization data is collected from the HMC (via lslparutil). The <strong>lpar2rrd</strong> utility connects<br />
to the nominated HMC(s), via SSH, to collect the performance data. This data is<br />
stored in an RRD database on the <strong>lpar2rrd</strong> system. The data is processed and<br />
graphs are generated for <strong>shared</strong> <strong>processor</strong> usage for each LPAR and the <strong>shared</strong><br />
<strong>processor</strong> <strong>pools</strong>.<br />
The graphs are then accessible via a Web server (HTTP) running on the <strong>lpar2rrd</strong><br />
server system. It is a very straightforward architecture, which is detailed in the<br />
following diagram (Figure 1) from the <strong>lpar2rrd</strong> website.<br />
Figure 1. <strong>lpar2rrd</strong> architecture overview<br />
<strong>Monitoring</strong> <strong>shared</strong> <strong>processor</strong> <strong>pools</strong> <strong>with</strong> <strong>lpar2rrd</strong> Trademarks<br />
© Copyright IBM Corporation 2010. All rights reserved. Page 2 of 17
ibm.com/developerWorks developerWorks®<br />
Data is collected at regular intervals (which you can decide). Historical data is<br />
available and can provide you <strong>with</strong> a great view of an LPAR, or an entire system,<br />
<strong>shared</strong> <strong>processor</strong> usage over days, months, or years.<br />
When you are ready to install the tool, I recommend you visit the <strong>lpar2rrd</strong> site,<br />
download the latest distribution of the code and then follow the detailed installation<br />
instructions.<br />
Make sure you have nominated a system that will act as the <strong>lpar2rrd</strong> server and that<br />
you have installed all the pre-requisites. Also, ensure you have a functioning Web<br />
server on this system. The installation notes will walk you through the "<strong>lpar2rrd</strong> to<br />
HMC" SSH communications setup.<br />
The <strong>lpar2rrd</strong> server can be hosted on any UNIX type system, as all that is required is<br />
SSH, a Web server, Perl and RRDTool. For me, it made sense to host <strong>lpar2rrd</strong> on<br />
one of my AIX LPARs, in particular one of my NIM servers.<br />
<strong>Monitoring</strong> <strong>shared</strong> <strong>processor</strong> <strong>pools</strong> <strong>with</strong> <strong>lpar2rrd</strong> Trademarks<br />
© Copyright IBM Corporation 2010. All rights reserved. Page 3 of 17
developerWorks® ibm.com/developerWorks<br />
I have used <strong>lpar2rrd</strong> since version 1.83 and just recently, I upgraded to version 2.51.<br />
Version 2 has many new features such as support for multiple <strong>shared</strong> <strong>processor</strong><br />
<strong>pools</strong>, not to mention an improved Web front-end. The upgrade from 1.83 to 2.51<br />
was painless. Pavel's documentation provided simple instructions for performing the<br />
update.<br />
The very latest version, 2.59 (as of 02/26/2010) now has support for LEA/HEA<br />
network statistics, IVM support, and real-time refresh of LPAR/pool usage graphs.<br />
And according to the wiki, there are also future plans to support the very latest<br />
technologies on Power such as Active Memory Sharing.<br />
Aside from CPU statistics, the tool can also provide data relating to memory<br />
allocation and LPAR configuration and state change history.<br />
IBM does not officially support this tool. However, if you have a genuine issue <strong>with</strong><br />
<strong>lpar2rrd</strong>, you could contact its creator via e-mail and ask for assistance. For<br />
example, if you review the release notes on the <strong>lpar2rrd</strong> site, you will find this entry:<br />
1.85 (16-May-2008)<br />
fixed a problem <strong>with</strong> LANG variable on HMC set to other than en_US <strong>with</strong> date format<br />
different from MM/DD/YYYY<br />
That was me! I had an issue <strong>with</strong> the tool and I contacted Pavel. He responded very<br />
quickly <strong>with</strong> a resolution to my problem and then set about updating <strong>lpar2rrd</strong> <strong>with</strong> a<br />
permanent fix. Keep in mind that this is a project that is only conducted during "free<br />
time" and is not sponsored by IBM. So please do not inundate the developer <strong>with</strong><br />
e-mail's requesting support!<br />
Using <strong>lpar2rrd</strong><br />
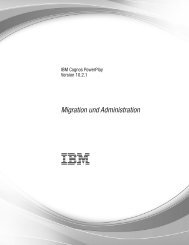
In my environment, we have four IBM POWER6 <strong>shared</strong> <strong>processor</strong> <strong>pools</strong> that need to<br />
be monitored. We have one p6 570 (9117-MMA) and three p6 595s (9119-FHA).<br />
Each system has a <strong>shared</strong> <strong>processor</strong> pool. We use <strong>lpar2rrd</strong> tool to collect usage<br />
data for each of the frames and then use the resulting graphs for reporting on overall<br />
<strong>processor</strong> pool usage. We also use it to monitor and report on individual LPAR<br />
(<strong>shared</strong>) <strong>processor</strong> usage.<br />
In Figure 2, there are two HMCs from which <strong>lpar2rrd</strong> is collecting utilization data. We<br />
have an HMC (hhmc01) at one site connected to 570-1, 595-1 and 595-2. The other<br />
HMC (bhmc01) is connected to 595-3, located at our disaster recovery site.<br />
Figure 2. The customers POWER6 environment<br />
<strong>Monitoring</strong> <strong>shared</strong> <strong>processor</strong> <strong>pools</strong> <strong>with</strong> <strong>lpar2rrd</strong> Trademarks<br />
© Copyright IBM Corporation 2010. All rights reserved. Page 4 of 17
ibm.com/developerWorks developerWorks®<br />
Note: A larger version of Figure 2 is available, if needed.<br />
To give you an idea of how we use <strong>lpar2rrd</strong> and the benefits it provided to us, I have<br />
included some screen shots.<br />
The <strong>lpar2rrd</strong> code is installed on one of our NIM masters (hxnim1) on 570-1. Apache<br />
is also installed on the NIM master. To access the tool, I simply point my Web<br />
browser at the URL, http://hxnim1/<strong>lpar2rrd</strong>.<br />
The <strong>lpar2rrd</strong> main page provides a link to both HMCs (Figure3).<br />
Figure 3. – The <strong>lpar2rrd</strong> main page<br />
<strong>Monitoring</strong> <strong>shared</strong> <strong>processor</strong> <strong>pools</strong> <strong>with</strong> <strong>lpar2rrd</strong> Trademarks<br />
© Copyright IBM Corporation 2010. All rights reserved. Page 5 of 17
developerWorks® ibm.com/developerWorks<br />
After selecting an HMC (in this case hhmc01), I am presented <strong>with</strong> some <strong>processor</strong><br />
pool data for one of my managed systems, 570-1 (Figure 4). This page displays the<br />
<strong>shared</strong> <strong>processor</strong> pool usage for 570-1 over the last day, week, month and year.<br />
Figure 4. Shared <strong>processor</strong> pool usage for 570-1<br />
<strong>Monitoring</strong> <strong>shared</strong> <strong>processor</strong> <strong>pools</strong> <strong>with</strong> <strong>lpar2rrd</strong> Trademarks<br />
© Copyright IBM Corporation 2010. All rights reserved. Page 6 of 17
ibm.com/developerWorks developerWorks®<br />
On the left-hand side, under MANAGED SYSTEMS, there is a list of each of the<br />
Power systems connected to this HMC. If I want to look at a different frame, I simply<br />
click on the managed system name. Or if I want to look at different managed system,<br />
on another HMC, I simply click on the HMC name, under HMC(s) and select the<br />
desired managed system name.<br />
To view usage data for an individual LPAR, I can select the LPAR name under the<br />
LPAR(s) list on the left-hand side. Shared CPU usage data is shown for the LPAR<br />
over the last day, week and year. Figure 5 is an example of this.<br />
Figure 5. Shared <strong>processor</strong> usage for an LPAR on 595-1<br />
Another great feature of <strong>lpar2rrd</strong> is the aggregated LPAR view. This gives you a<br />
view of all the LPARs on a frame and how much <strong>processor</strong> each is consuming (see<br />
Figure 6 below).<br />
Figure 6. Aggregated LPAR view for all LPARs on 595-1<br />
<strong>Monitoring</strong> <strong>shared</strong> <strong>processor</strong> <strong>pools</strong> <strong>with</strong> <strong>lpar2rrd</strong> Trademarks<br />
© Copyright IBM Corporation 2010. All rights reserved. Page 7 of 17
developerWorks® ibm.com/developerWorks<br />
The Total CPU util per HMC view is also interesting. You can quickly observe which<br />
of the managed systems connected to an HMC is using the most <strong>processor</strong>. It may<br />
help you determine where you could move an LPAR to balance your workload. For<br />
an example, you can refer to Figure 7.<br />
Figure 7. Total CPU utilization per HMC view<br />
<strong>Monitoring</strong> <strong>shared</strong> <strong>processor</strong> <strong>pools</strong> <strong>with</strong> <strong>lpar2rrd</strong> Trademarks<br />
© Copyright IBM Corporation 2010. All rights reserved. Page 8 of 17
ibm.com/developerWorks developerWorks®<br />
A search function is also available if you are looking for an LPAR on a particular<br />
managed system. Under LPAR Search, simply enter the name of the LPAR, click<br />
search and you will be presented <strong>with</strong> a link to that systems data. Note: I have found<br />
that I had to tick Case sensitive when entering data into the search box, otherwise<br />
nothing would return from the search. For a screen shot example, you can refer to<br />
Figures 8 and 9, below.<br />
Figure 8. LPAR search box<br />
Figure 9. LPAR search results<br />
<strong>Monitoring</strong> <strong>shared</strong> <strong>processor</strong> <strong>pools</strong> <strong>with</strong> <strong>lpar2rrd</strong> Trademarks<br />
© Copyright IBM Corporation 2010. All rights reserved. Page 9 of 17
developerWorks® ibm.com/developerWorks<br />
It is also possible to produce historical reports based on your own date and time<br />
criteria. Do not forget to select the correct HMC sample rate, otherwise you will not<br />
see any matching data! For example, in Figure 10, I selected hvio3. The result, in<br />
Figure 11, shows me the <strong>shared</strong> <strong>processor</strong> usage for hvio3 from midnight 15 th Dec<br />
2009 to midnight 16 th Dec 2009. Note: there is also a handy Export to CSV link on<br />
the right of the page.<br />
Figure 10. Generating a historical report for an LPAR on 595-1<br />
<strong>Monitoring</strong> <strong>shared</strong> <strong>processor</strong> <strong>pools</strong> <strong>with</strong> <strong>lpar2rrd</strong> Trademarks<br />
© Copyright IBM Corporation 2010. All rights reserved. Page 10 of 17
ibm.com/developerWorks developerWorks®<br />
Figure 11. Historical CPU usage graph for an LPAR on 595-1<br />
To collect utilization data on the HMC, data collection must be enabled for each<br />
managed system(Figure 12). This is performed via the HMC and is covered in the<br />
<strong>lpar2rrd</strong> setup guide.<br />
<strong>Monitoring</strong> <strong>shared</strong> <strong>processor</strong> <strong>pools</strong> <strong>with</strong> <strong>lpar2rrd</strong> Trademarks<br />
© Copyright IBM Corporation 2010. All rights reserved. Page 11 of 17
developerWorks® ibm.com/developerWorks<br />
Figure 12. Enable the capture of utilization data via the HMC<br />
You can also customize the sampling rate for which data is collected (Figure 13).<br />
Prior to release 2.01, the default setting was one hour. This can now be changed to<br />
less than that, depending on what you need (possible sample rates are 30s, 60s,<br />
300s, 1800s and 3600s).<br />
Figure 13. Changing the sample rate via the HMC<br />
<strong>Monitoring</strong> <strong>shared</strong> <strong>processor</strong> <strong>pools</strong> <strong>with</strong> <strong>lpar2rrd</strong> Trademarks<br />
© Copyright IBM Corporation 2010. All rights reserved. Page 12 of 17
ibm.com/developerWorks developerWorks®<br />
The <strong>lpar2rrd</strong> environment and data<br />
To give you an idea of what a typical <strong>lpar2rrd</strong> installation and its data files may look<br />
like, I have provided some output below. After I had followed the installation and<br />
configuration steps outlined on the <strong>lpar2rrd</strong> Web site, there was very little left to do. I<br />
have rarely needed to manage the underlying <strong>lpar2rrd</strong> environment, but it is always<br />
helpful to know a little about what’s "under the hood."<br />
The environment resided on my NIM server (hxnim1) in a directory under the<br />
<strong>lpar2rrd</strong> users home directory (e.g. /home/<strong>lpar2rrd</strong>/<strong>lpar2rrd</strong>).<br />
<strong>lpar2rrd</strong>@hxnim1 /home/<strong>lpar2rrd</strong> $ ls -ltr<br />
total 400<br />
drwxr-xr-x 4 <strong>lpar2rrd</strong> staff 4096 Feb 11 2007 <strong>lpar2rrd</strong><br />
The <strong>lpar2rrd</strong> user on hxnim1 was able to ssh directly to both of my HMCs <strong>with</strong>out a<br />
password.<br />
<strong>lpar2rrd</strong>@hxnim1 /home/<strong>lpar2rrd</strong>/.ssh $ ssh hhmc01 date<br />
Wed Nov 25 09:36:32 EST 2009<br />
<strong>lpar2rrd</strong>@hxnim1 /home/<strong>lpar2rrd</strong>/.ssh $ ssh bhmc01 date<br />
Wed Nov 25 10:08:40 EST 2009<br />
I created a new cron job for the load.sh script. It would run every hour, to<br />
correspond <strong>with</strong> my one hour sample rate on the HMCs.<br />
<strong>lpar2rrd</strong>@hxnim1 /home/<strong>lpar2rrd</strong>/<strong>lpar2rrd</strong> $ crontab -l<br />
05 * * * * /home/<strong>lpar2rrd</strong>/<strong>lpar2rrd</strong>/load.sh > /home/<strong>lpar2rrd</strong>/<strong>lpar2rrd</strong>/rrdload.err 2>&1<br />
I customized the <strong>lpar2rrd</strong> configuration file (as part of the installation instructions) to<br />
fit my environment. I have highlighted the variables that I changed below.<br />
# Directory where the tool is installed<br />
INPUTDIR=/home/<strong>lpar2rrd</strong>/<strong>lpar2rrd</strong><br />
# WWW directory where the tool places graphs, directory must exist before the first run,<br />
# make sure that rights are correct<br />
#WEBDIR=/home/apache/html/<strong>lpar2rrd</strong><br />
WEBDIR=/opt/freeware/apache/share/htdocs/<strong>lpar2rrd</strong><br />
# user for download data from HMC, it must exist on HMC and must have allowed access<br />
# via ssh-keys<br />
HMC_USER=<strong>lpar2rrd</strong><br />
# HMC hostname (you can specify list of hostnames separated by a space)<br />
HMC_HOSTAME="hhmc01 bhmc01"<br />
<strong>Monitoring</strong> <strong>shared</strong> <strong>processor</strong> <strong>pools</strong> <strong>with</strong> <strong>lpar2rrd</strong> Trademarks<br />
© Copyright IBM Corporation 2010. All rights reserved. Page 13 of 17
developerWorks® ibm.com/developerWorks<br />
When I ran the load.sh script for the first time, data was collected from both HMCs<br />
for all the managed systems.<br />
Working for managed name : SN1001C70_p570-1<br />
Load data for hhmc01<br />
Load hourly stats<br />
fetching hhmc01:SN1001C70_p570-1 lpar data<br />
fetching hhmc01:SN1001C70_p570-1 pool data<br />
fetching hhmc01:SN1001C70_p570-1 mem data<br />
updating rrd db : hhmc01:data : /home/<strong>lpar2rrd</strong>/<strong>lpar2rrd</strong>/data/<br />
SN1001C70_p570-1/hhmc01/in-h<br />
updating rrd db : hhmc01:mem : /home/<strong>lpar2rrd</strong>/<strong>lpar2rrd</strong>/data/<br />
SN1001C70_p570-1/hhmc01/mem.in-h<br />
updating rrd db : hhmc01:pool : /home/<strong>lpar2rrd</strong>/<strong>lpar2rrd</strong>/data/<br />
SN1001C70_p570-1/hhmc01/pool.in-h<br />
Drawing charts for : hvio1<br />
Create graphs for hhmc01:SN1001C70_p570-1:hvio1:d<br />
...<br />
creating html pages for LPAR: hxaix66<br />
creating html pages for LPAR: hxaix68adm<br />
creating html pages for LPAR: hxaix69<br />
creating html pages for LPAR: hxaix70<br />
creating html pages for LPAR: hxaix71adm<br />
creating html pages for LPAR: hxaix97<br />
creating html pages for LPAR: hxnim3<br />
The data for each system is stored in the <strong>lpar2rrd</strong> data directory. Remarkably, it<br />
requires very little disk space, depending on the sample rate, the number of<br />
managed systems and LPARs. The du output below is from an <strong>lpar2rrd</strong> installation<br />
that has been running for several years. Only a little over 160MB of data exists for<br />
around 100 LPARs <strong>with</strong> a sample rate of one hour.<br />
<strong>lpar2rrd</strong>@hxnim1 /home/<strong>lpar2rrd</strong>/<strong>lpar2rrd</strong>/data $ ls -ltr<br />
total 0<br />
drwxr-xr-x 3 <strong>lpar2rrd</strong> staff 256 May 16 2008 SN1001C70_p570-1<br />
drwxr-xr-x 3 <strong>lpar2rrd</strong> staff 256 Jan 20 2009 SN8379A60_p595-3<br />
drwxr-xr-x 3 <strong>lpar2rrd</strong> staff 256 Jan 27 2009 SN8379A80_p595-2<br />
drwxr-xr-x 3 <strong>lpar2rrd</strong> staff 256 Feb 11 2009 SN8379A70_p595-1<br />
<strong>lpar2rrd</strong>@hxnim1 /home/<strong>lpar2rrd</strong> $ du -sm .<br />
162.29 .<br />
Inside the data directory for a system, you will find RRD data files for each LPAR, as<br />
expected (no surprises there).<br />
<strong>lpar2rrd</strong>@hxnim1 /home/<strong>lpar2rrd</strong>/<strong>lpar2rrd</strong>/data/SN1001C70_p570-1 $ ls -ltr<br />
total 8<br />
drwxr-xr-x 2 <strong>lpar2rrd</strong> staff 4096 Sep 01 00:05 hhmc01<br />
total 56320<br />
-rw-r--r-- 1 <strong>lpar2rrd</strong> staff 434776 May 24 2008 hxaix21.rrd<br />
-rw-r--r-- 1 <strong>lpar2rrd</strong> staff 434776 Sep 24 2008 hxaix05.rrd<br />
-rw-r--r-- 1 <strong>lpar2rrd</strong> staff 434776 Sep 24 2008 hxaix03.rrd<br />
-rw-r--r-- 1 <strong>lpar2rrd</strong> staff 434776 Nov 24 2008 hxaix05.rrh<br />
-rw-r--r-- 1 <strong>lpar2rrd</strong> staff 434776 Nov 24 2008 hxaix03.rrh<br />
-rw-r--r-- 1 <strong>lpar2rrd</strong> staff 434776 Nov 25 00:05 pool.rrd<br />
-rw-r--r-- 1 <strong>lpar2rrd</strong> staff 109120 Nov 25 00:05 mem.rrd<br />
-rw-r--r-- 1 <strong>lpar2rrd</strong> staff 434776 Nov 25 00:05 hxnim1.rrd<br />
-rw-r--r-- 1 <strong>lpar2rrd</strong> staff 434776 Nov 25 00:05 hxaix99.rrd<br />
<strong>Monitoring</strong> <strong>shared</strong> <strong>processor</strong> <strong>pools</strong> <strong>with</strong> <strong>lpar2rrd</strong> Trademarks<br />
© Copyright IBM Corporation 2010. All rights reserved. Page 14 of 17
ibm.com/developerWorks developerWorks®<br />
-rw-r--r-- 1 <strong>lpar2rrd</strong> staff 434776 Nov 25 00:05 hxaix60.rrd<br />
-rw-r--r-- 1 <strong>lpar2rrd</strong> staff 434776 Nov 25 00:05 hxaix53.rrd<br />
-rw-r--r-- 1 <strong>lpar2rrd</strong> staff 434776 Nov 25 00:05 hxaix50.rrd<br />
-rw-r--r-- 1 <strong>lpar2rrd</strong> staff 434776 Nov 25 00:05 hxaix46.rrd<br />
-rw-r--r-- 1 <strong>lpar2rrd</strong> staff 434776 Nov 25 00:05 hxaix32.rrd<br />
-rw-r--r-- 1 <strong>lpar2rrd</strong> staff 434776 Nov 25 00:05 hxaix31.rrd<br />
-rw-r--r-- 1 <strong>lpar2rrd</strong> staff 434776 Nov 25 00:05 hxaix30.rrd<br />
-rw-r--r-- 1 <strong>lpar2rrd</strong> staff 434776 Nov 25 00:05 hxaix29.rrd<br />
-rw-r--r-- 1 <strong>lpar2rrd</strong> staff 434776 Nov 25 00:05 hxaix28.rrd<br />
-rw-r--r-- 1 <strong>lpar2rrd</strong> staff 434776 Nov 25 00:05 hxaix27.rrd<br />
-rw-r--r-- 1 <strong>lpar2rrd</strong> staff 434776 Nov 25 00:05 hxaix26.rrd<br />
-rw-r--r-- 1 <strong>lpar2rrd</strong> staff 434776 Nov 25 00:05 hxaix25.rrd<br />
-rw-r--r-- 1 <strong>lpar2rrd</strong> staff 434776 Nov 25 00:05 hxaix20.rrd<br />
...<br />
-rw-r--r-- 1 <strong>lpar2rrd</strong> staff 434776 Nov 25 09:05 hxaix07.rrh<br />
-rw-r--r-- 1 <strong>lpar2rrd</strong> staff 434776 Nov 25 09:05 hxaix06.rrh<br />
-rw-r--r-- 1 <strong>lpar2rrd</strong> staff 434776 Nov 25 09:05 hxaix04.rrh<br />
-rw-r--r-- 1 <strong>lpar2rrd</strong> staff 434776 Nov 25 09:05 hxaix02.rrh<br />
-rw-r--r-- 1 <strong>lpar2rrd</strong> staff 434776 Nov 25 09:05 hxaix01.rrh<br />
-rw-r--r-- 1 <strong>lpar2rrd</strong> staff 434776 Nov 25 09:05 hvio2.rrh<br />
-rw-r--r-- 1 <strong>lpar2rrd</strong> staff 434776 Nov 25 09:05 hvio12.rrh<br />
-rw-r--r-- 1 <strong>lpar2rrd</strong> staff 434776 Nov 25 09:05 hvio11.rrh<br />
-rw-r--r-- 1 <strong>lpar2rrd</strong> staff 434776 Nov 25 09:05 hvio1.rrh<br />
-rw-r--r-- 1 <strong>lpar2rrd</strong> staff 59960 Nov 25 09:05 in-d<br />
-rw-r--r-- 1 <strong>lpar2rrd</strong> staff 1560 Nov 25 09:05 pool.in-d<br />
-rw-r--r-- 1 <strong>lpar2rrd</strong> staff 624 Nov 25 09:05 mem.in-d<br />
The good news is, once it is configured, you don’t really need to worry about any of<br />
this again! In addition, if you want a quick way to view your current <strong>lpar2rrd</strong><br />
configuration file, you can do this via the Web interface. Simply select<br />
Configuration under LPAR2RRD and the <strong>lpar2rrd</strong>.cfg file will be displayed<br />
(Figure 14).<br />
Figure 14. <strong>lpar2rrd</strong> configuration file<br />
<strong>Monitoring</strong> <strong>shared</strong> <strong>processor</strong> <strong>pools</strong> <strong>with</strong> <strong>lpar2rrd</strong> Trademarks<br />
© Copyright IBM Corporation 2010. All rights reserved. Page 15 of 17
developerWorks® ibm.com/developerWorks<br />
In addition, if you would like to see what, if any, errors were generated during the<br />
last run of the load.sh script, you can also view this from the Web interface (Figure<br />
15). Under LPAR2RRD, select Error log.<br />
Figure 15. <strong>lpar2rrd</strong> error log<br />
Summary<br />
As you can probably tell, I’m a big fan of this tool. I have attempted to demonstrate<br />
why I believe <strong>lpar2rrd</strong> is the best free tool for monitoring and reporting on <strong>shared</strong><br />
<strong>processor</strong> pool usage on IBM Power based systems. I have not come across any<br />
other tools (except maybe Ganglia, another excellent free tool) that can do what<br />
<strong>lpar2rrd</strong> does so well. I have also not come across an implementation of any<br />
products (that cost real money) that can do any better. The Web front-end may not<br />
look pretty but the simplicity and functionality of this tool allow us to overlook any<br />
cosmetic shortcomings. I highly recommend <strong>lpar2rrd</strong>.<br />
<strong>Monitoring</strong> <strong>shared</strong> <strong>processor</strong> <strong>pools</strong> <strong>with</strong> <strong>lpar2rrd</strong> Trademarks<br />
© Copyright IBM Corporation 2010. All rights reserved. Page 16 of 17
ibm.com/developerWorks developerWorks®<br />
Resources<br />
Learn<br />
• LPAR2RRD - LPAR CPU statistics and documentation tool for IBM Power<br />
Systems.<br />
• <strong>lpar2rrd</strong> Demo Site<br />
Discuss<br />
• Follow developerWorks on Twitter.<br />
• Get involved in the My developerWorks community.<br />
• Participate in the AIX and UNIX® forums:<br />
• AIX Forum<br />
• AIX Forum for developers<br />
• Cluster Systems Management<br />
• IBM Support Assistant Forum<br />
• Performance Tools Forum<br />
• Virtualization Forum<br />
• More AIX and UNIX Forums<br />
About the author<br />
Chris Gibson<br />
Chris Gibson is an AIX systems specialist located in Melbourne,<br />
Australia. He is an IBM CATE, System p platform and AIX 5L, and a<br />
co-author of the IBM Redbooks publication, "NIM from A to Z in AIX<br />
5L."<br />
<strong>Monitoring</strong> <strong>shared</strong> <strong>processor</strong> <strong>pools</strong> <strong>with</strong> <strong>lpar2rrd</strong> Trademarks<br />
© Copyright IBM Corporation 2010. All rights reserved. Page 17 of 17