IBM Cognos Real-Time Monitoring Sizing Guide
IBM Cognos Real-Time Monitoring Sizing Guide
IBM Cognos Real-Time Monitoring Sizing Guide

You also want an ePaper? Increase the reach of your titles
YUMPU automatically turns print PDFs into web optimized ePapers that Google loves.
SIZING GUIDE
I OVERVIEW<br />
This document will help sales/pre-sales as well as solution architects correctly recommend the<br />
appropriate environment for the <strong>Real</strong>-time <strong>Monitoring</strong> capability within the <strong>Cognos</strong> 10 portfolio.<br />
<strong>IBM</strong> <strong>Cognos</strong>® <strong>Real</strong>-time <strong>Monitoring</strong> is an actionable business intelligence solution which addresses an<br />
enterprise’s real-time monitoring needs for the operational frontline. Designed for the Fortune 1000<br />
enterprise, <strong>IBM</strong> <strong>Cognos</strong> <strong>Real</strong>-time <strong>Monitoring</strong> delivers self-service, interactive dashboards with easy to<br />
develop operational KPIs and measures to support your organization’s operational KPI monitoring<br />
agenda.<br />
<strong>IBM</strong> <strong>Cognos</strong> <strong>Real</strong>-time <strong>Monitoring</strong> is a solution for consumers of actionable business intelligence that<br />
provides an organization’s frontline with rich, visual operational KPIs and measures for supporting up-tothe-moment<br />
decision making needs. Actionable BI provides the business with immediate contextual<br />
intelligence giving workers insight into relevant operational drivers to make accelerated decisions. These<br />
accelerated decisions drive actions that have optimal impact on business operations in real-time such as<br />
call center agent utilization, marketing lead monitoring and SLA monitoring.<br />
Customers can choose to deploy <strong>Real</strong>-time <strong>Monitoring</strong> standalone, or in conjunction with other <strong>Cognos</strong><br />
10 platform capabilities. This sizing guide focuses only on the <strong>Real</strong>-time <strong>Monitoring</strong> component, but<br />
where relevant includes <strong>Cognos</strong> 10 platform requirements if leveraged.<br />
Licensed Materials – Property of <strong>IBM</strong> 2<br />
Copyright <strong>IBM</strong> Corp. 2003, 2010.
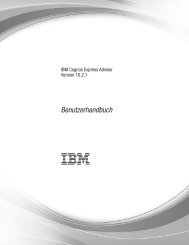
II. ARCHITECTURE OVERVIEW<br />
<strong>IBM</strong> <strong>Cognos</strong> <strong>Real</strong>-time <strong>Monitoring</strong> can access a wide variety of operational data sources, such as<br />
transactional databases via scheduled JDBC queries, Messaging sources such as MQ Series and Java<br />
Messaging Service, and Web Services sources via either push or pull approaches.<br />
The key benefit of the <strong>Real</strong>-time <strong>Monitoring</strong> architecture is the embedded in-memory streaming data<br />
store. This data store aggregates pre-determined information on the fly from data in flight sources. This<br />
allows end users visibility into transactional environments without the burden of ad-hoc analysis placed on<br />
these operational systems. Every end user analysis, drill-down, etc is served up by the streaming data<br />
store, and NOT by the original data source. Data extraction to the streaming data store is via a known<br />
schedule or a simple listen to a message queue, thus eliminating operational system performance<br />
degradations.<br />
Licensed Materials – Property of <strong>IBM</strong> 3<br />
Copyright <strong>IBM</strong> Corp. 2003, 2010.
III. REAL-TIME MONITORING SERVER CAPACITY GUIDELINES<br />
Capacity is a term often used to refer to an application’s ability to meet performance expectations when<br />
under load. When determining capacity for <strong>Real</strong>-time <strong>Monitoring</strong> three categories are considered:<br />
• Data: data throughput, in-memory data, data model complexity<br />
• Users: active user population<br />
• Content: dashboards, monitor objects, reports<br />
1. Server Processor Capacity<br />
For the <strong>Real</strong>-time <strong>Monitoring</strong> server processor capacity, we will use the processor licensing metric PVU,<br />
as in Processor Value Unit. This measure allows one to consistently use a single measure regardless of<br />
the type of hardware leveraged. For further information on PVUs, see:<br />
http://www-01.ibm.com/software/lotus/passportadvantage/pvu_licensing_for_customers.html<br />
Also, for how PVUs are measured in virtualization environments:<br />
http://www-<br />
01.ibm.com/software/lotus/passportadvantage/Counting_Software_licenses_using_specific_virtualization<br />
_technologies.html<br />
The PVU measurement is for the server running the <strong>Real</strong>-time <strong>Monitoring</strong> application server, which can<br />
be distributed from other components such as the web server and metadata database.<br />
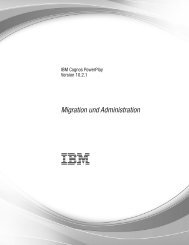
To determine the recommended server capacity for your application, answer the following questions:<br />
1. How much event processing do<br />
you need the server to process?<br />
If this includes a data at rest<br />
source (i.e. database) than treat<br />
each database row as an event<br />
(i.e. 100000 new rows added per<br />
hour = ~28 msgs per sec)<br />
2. How many people would typically<br />
be logged on at once to a <strong>Real</strong>time<br />
<strong>Monitoring</strong> application?<br />
IF… Then use this number of<br />
PVUs in your server…<br />
More than 2000 events<br />
800<br />
per sec<br />
Between 100 and 2000<br />
events per sec<br />
Less than 100 events per<br />
sec<br />
Licensed Materials – Property of <strong>IBM</strong> 4<br />
Copyright <strong>IBM</strong> Corp. 2003, 2010.<br />
600<br />
400<br />
More than 500 people 800<br />
Between 200 & 500<br />
people<br />
600<br />
Less than 200 people 400<br />
More than 10 600<br />
3. How many dashboard metrics are<br />
envisioned that have less than<br />
one minute refresh intervals? Less than 10 400<br />
Based on answers to the three questions above, use the closet number of PVUs in the <strong>Real</strong>-time<br />
<strong>Monitoring</strong> server to the maximum number of PVUs stated for each question. For example, if you need to<br />
process 80 events per sec, for 100 users, with less than 10 dashboard metrics, the recommendation is<br />
400 PVUs. On a System x M3 server, at 70 PVUs per core, you could start with 1 hexa core CPU
(6X70=420 PVUs) and be slightly over the recommended 400 PVUs. This will also give you room to grow<br />
with another processor slot if the event rate increases in future.<br />
As another example, if you need to process 150 events per sec, for 100 users, with less than 10<br />
dashboard metrics, the recommendation is 600 PVUs. On a Linux for System z9 server, at 100 PVUs per<br />
IFL (Integrated Facility for Linux), you could start with 6 IFLs and be equated to the recommended 600<br />
PVUs.<br />
<strong>Real</strong>-time <strong>Monitoring</strong> has been benchmarked for event throughput up to 15,000 events per sec. Actual<br />
processing performance depends on the implementation. For use-cases needing event throughout<br />
beyond this level, customers should inquire about the Infosphere Streams product that can be deployed<br />
in conjunction with <strong>Real</strong>-time <strong>Monitoring</strong>.<br />
2. Estimating Memory Requirements<br />
<strong>IBM</strong> <strong>Cognos</strong> <strong>Real</strong>-time <strong>Monitoring</strong> maintains data in high-speed RAM, using an in-memory streaming data<br />
store, an analytics engine and cache. The amount of streaming data being monitored per second and the<br />
amount of total data held in memory impact the amount of memory required by the in-memory data store.<br />
The complexity of the data model affects both RAM and CPU utilization, particularly when computing<br />
measure values. For example; some statistical functions such as mean or standard deviation may require<br />
holding a data population in-memory in order to quickly present results. How much is stored in memory is<br />
determined by the dimensionality and time period associated with the measure. Memory requirements<br />
required to select an appropriately sized <strong>Real</strong>-time <strong>Monitoring</strong> server can be estimated by looking at<br />
requirements for events, lookup tables, views & cubes, streaming data windows, active users, and<br />
content. However, the best method of estimating memory usage is to leverage a proof of concept to see<br />
actual memory usage for a given use-case. Since this is not always feasible, the sections below are for<br />
information purposes only, and the summary section guidelines only. We recommend even for the<br />
smallest deployments, 32 Gb of RAM be the entry level used. Ensure whatever environment is chosen,<br />
both memory and processor capacity can be scaled as your system requirements grow.<br />
2.1. Event Data<br />
There are two ways to bring data from external data sources into <strong>Real</strong>-time <strong>Monitoring</strong>; by defining data<br />
streams and by creating lookup tables.<br />
Data Stream definitions do not have a significant fixed memory footprint, but they do use memory and<br />
CPU as they are being processed. Memory consumption for data streams varies based on event load and<br />
the frequency of event feeds. The memory requirements for a single event can be estimated based upon<br />
the raw data size coming into the server. <strong>Real</strong>-time <strong>Monitoring</strong> allocates and releases memory as<br />
needed to process these events in real or near-real time.<br />
Memory requirements for events is estimated as the sum of the raw data size for all events per<br />
second that will execute simultaneously during the busiest processing window. For example; if<br />
you will never have more than three events executing at the same time – then the memory<br />
requirements for events can be estimated to be the sum of the raw data feed size for those three<br />
events.<br />
Example: You are monitoring 3 event streams. At the peak period, the streaming flow may be<br />
estimated as follows:<br />
• Event Stream 1: 450 bytes per event with 3 events per second = 1,350 bytes per second<br />
• Event Stream 2: 280 bytes per event with 1 event per second = 280 bytes per second<br />
• Event Stream 3: 30 bytes per event with 10 events per second = 3,000 bytes per second<br />
• Total streamlining data: 4,630 bytes per second<br />
Licensed Materials – Property of <strong>IBM</strong> 5<br />
Copyright <strong>IBM</strong> Corp. 2003, 2010.
2.2. Lookup Tables<br />
Lookup tables also increase memory requirements and their impact on memory utilization is greater if prefetch<br />
is used or if lookup tables are configured with long in-memory retention times. The pre-fetch option<br />
causes <strong>Real</strong>-time <strong>Monitoring</strong> to load lookup table data into cache memory and is implemented in some<br />
scenarios to optimize performance. Without pre-fetch, lookup table data is loaded into memory as needed<br />
and memory utilization is controlled though configurable table load and in-memory retention parameters.<br />
Memory requirements for lookup tables can be estimated as the sum of all data to be loaded into<br />
memory at one time. This includes all data for tables using the pre-fetch option as well as the<br />
maximum amount of lookup table data to be held in memory at one time (based upon in-memory<br />
load and retention settings).<br />
Example: You have 15 lookup tables defined in the application. An example lookup table could<br />
be made up of two columns; column 1 being a 4 byte numeric ID, and column 2 being a string of<br />
30 2-byte characters. This gives us a row size of 64 bytes. Each look up table has an average of<br />
20 rows. 8 tables use the pre-fetch option.<br />
• Average size of a lookup table = 64 bytes * 20 = 1,280 bytes<br />
• Minimum estimated RAM (pre-fetched tables): 10.2 KB<br />
• Maximum estimated RAM (all tables): 19.2 KB<br />
2.3. Views & Cubes<br />
Once data is brought into <strong>Real</strong>-time <strong>Monitoring</strong> through either data streams or lookup tables; views and<br />
cubes can be created to support analysis activities.<br />
Views generally have lower memory requirements than cubes - unless they are used to maintain raw<br />
event data in memory. Only result sets are maintained in memory for views and these results sets are<br />
updated incrementally – thereby reducing the overall memory utilization for views.<br />
Memory requirements for a view relies upon how data is grouped and what attributes are used in the<br />
view. More granular the attributes result in more data being maintained in the view, which in turn results in<br />
larger memory requirements. Memory requirements will still be less than the size of the raw data as the<br />
view aggregates the raw data based on the defined grouping.<br />
The memory utilization requirements for a view can be estimated by analyzing the size of raw<br />
data, and how it will be used – the level of detail for attributes and grouping to be used.<br />
Memory requirements for cubes in <strong>Real</strong>-time <strong>Monitoring</strong> are driven by the number of dimensions in the<br />
cube and the size or granularity of data for each dimension. For example, a cube with a dimension<br />
tracking time at the granularity of seconds will result in a larger amount of data than one using minutes or<br />
hours. Since cubes are maintained in memory, a larger data size for cubes translates into larger memory<br />
requirements to hold the cube. Future requirements for cube growth should be taken into account when<br />
estimating memory requirements.<br />
Similar to views; the memory utilization requirements for a cube can be estimated by analyzing<br />
the size of raw data, and how it will be used – the level of detail for attributes and grouping to be<br />
used.<br />
2.4. <strong>Time</strong>-Based Windows<br />
<strong>Real</strong>-time <strong>Monitoring</strong> provides the ability to monitor collections of streaming data events through timebased<br />
windows that can be defined based upon a number of events or a collection of events within a time<br />
period. <strong>Time</strong>-based windows are defined as part of the view and cube creation process.<br />
The estimated memory required for a time-based window can be based on the level of detail (or<br />
granularity), the kind of calculation being computed, the number of unique groups in that window, and the<br />
size of the window in time. The type of window being implemented also has an impact upon memory<br />
Licensed Materials – Property of <strong>IBM</strong> 6<br />
Copyright <strong>IBM</strong> Corp. 2003, 2010.
utilization. Windows can be either sliding or tumbling; sliding windows have a fixed size once full, whereas<br />
tumbling windows may grow and shrink as the window tumbles and fills again.<br />
The memory requirements for a time-based window can be estimated by considering the<br />
window’s size, type, and granularity.<br />
3. Estimating Active User Requirements<br />
As the <strong>Real</strong>-time <strong>Monitoring</strong> dashboard objects actively monitor changes in data; each user accessing a<br />
<strong>Real</strong>-time <strong>Monitoring</strong> application is considered an active user. As the number of active users requires<br />
both some CPU and RAM, the number of requests that can be handled by a single model is limited by the<br />
hardware configuration. The summary table which follows this section identifies the anticipated user load<br />
that could be supported by each model.<br />
Active <strong>Real</strong>-time <strong>Monitoring</strong> users add to memory and CPU requirements as they create dashboards, and<br />
perform analysis activities, resulting in queries that are created at run-time with the <strong>Real</strong>-time <strong>Monitoring</strong><br />
server. The server caches user queries and results, keeping them in memory and expiring them as part of<br />
normal memory management functions.<br />
Active users are defined as the total number of users that are expected to be actively utilizing<br />
system resources (such as RAM and CPU) at any given time. In short, all users simultaneously<br />
logged into <strong>Real</strong>-time <strong>Monitoring</strong> dashboards.<br />
4. Non-production Environments<br />
The sizing requirements in this document primarily relate to production environments and requirements<br />
for these situations. For non-production environments, ideally you will size a test/development<br />
environment similarly. However, if the test/dev environment is under much less load, the server CPU<br />
capacity could be reduced as per section 1 according to the data throughput needs of the non-production<br />
data sources. Also, recommended minimums in section 5 could be reduced in half (e.g. 400 PVUs in<br />
production could be 200 PVUs for non-production) if processing speed and user performance is not<br />
important.<br />
It is important that memory sizings for non-production environments match the production environments,<br />
as the same implementation model must run in the non-production environment. Trying to save nonproduction<br />
environment dollars on memory will only lead to testing and development headaches later.<br />
Any non-production staging environment should always mimic the production environment in both<br />
memory and CPU capacity. This is also true for disaster recovery environments, which are included in<br />
the production licensing for active-passive deployments.<br />
Licensed Materials – Property of <strong>IBM</strong> 7<br />
Copyright <strong>IBM</strong> Corp. 2003, 2010.
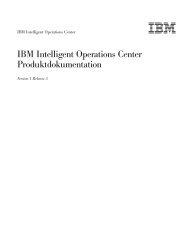
5. Summary<br />
This table identifies recommended system requirements for typical Small, Medium and Large<br />
deployments. If your application would function in the upper limits of several areas for a given<br />
configuration, then you should consider moving to the next level of deployment. These are guidelines<br />
only. Ensure the environment chosen is scalable as much as possible in terms of CPU processing<br />
capacity as well as addressable memory.<br />
Specs<br />
Users<br />
Installed RAM<br />
(scalable to 128 Gb<br />
for all)<br />
CPU (PVU<br />
measurement)<br />
Average # of active<br />
users<br />
Small Medium Large<br />
32 Gb 64 Gb 128 Gb<br />
As per<br />
Section 1<br />
(400 Min)<br />
As per<br />
Section 1<br />
(600 Min)<br />
As per<br />
Section 1<br />
(800 Min)<br />
100 300 500<br />
IV. REAL-TIME MONITORING CLIENT CAPACITY GUIDELINES<br />
The <strong>Real</strong>-time <strong>Monitoring</strong> client runs either Internet Explorer or Firefox, and is processing dynamic data<br />
refreshes provided by the server. Thus the demands on the client environment are much higher than ondemand<br />
refresh type BI applications.<br />
It is recommended the client system have processing capacity of at least one (preferable two) dual-core<br />
x86 Intel chipset. In addition, the client system RAM should be at least 2 Gb as use of client-side caching<br />
is leveraged for real-time performance.<br />
Licensed Materials – Property of <strong>IBM</strong> 8<br />
Copyright <strong>IBM</strong> Corp. 2003, 2010.