A Map of Toronto's Cultural Facilities - ERA Architects Inc.
A Map of Toronto's Cultural Facilities - ERA Architects Inc.
A Map of Toronto's Cultural Facilities - ERA Architects Inc.

Create successful ePaper yourself
Turn your PDF publications into a flip-book with our unique Google optimized e-Paper software.
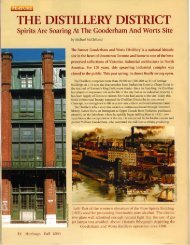
The large percentage <strong>of</strong> City-owned <strong>Cultural</strong> Memory Sites in the former City <strong>of</strong> Toronto<br />
(36%) may in part relate to the cost <strong>of</strong> maintenance for heritage properties and the lack <strong>of</strong><br />
incentives for private ownership. As an example the Design Exchange, housed in the old Stock<br />
Exchange Building, and other <strong>Cultural</strong> Memory Sites like the Roundhouse in Roundhouse<br />
Park, have been transferred to City-ownership as part <strong>of</strong> site specific development approvals to<br />
ensure their long-term preservation. This could not be as easily assured if they remained in private<br />
ownership. An even greater role for non-City owned <strong>Cultural</strong> Memory Sites in the South<br />
District could be encouraged by a program <strong>of</strong> improved tax or planning incentives for heritage<br />
conservation.<br />
In the North, East and West Districts the City owns the vast majority <strong>of</strong> the facilities, indicating<br />
in many cases the activities <strong>of</strong> each <strong>of</strong> the former municipalities in establishing local museums,<br />
maintaining historic municipal properties, and occasionally adapting them for cultural<br />
uses. The very low numbers <strong>of</strong> non-City owned <strong>Cultural</strong> Memory Sites, particularly in relation<br />
to the relatively high numbers <strong>of</strong> City-owned sites suggests the difficulty for the private<br />
sector to make these properties financially viable unless they are, as they are in the South<br />
District, part <strong>of</strong> a larger cluster <strong>of</strong> cultural facilities.<br />
6.4 Service Gaps and Needs Assessment<br />
If one were to compare <strong>Map</strong> 2 entitled “Where do children in low-income families live?” from<br />
the Toronto Report Card on Children, 1999, with the cultural facilities mapping it could be<br />
observed that low-income families live in areas that are poorly served by community amenities,<br />
including cultural facilities. To fully examine and understand this relationship well however<br />
will require much more detailed analysis, using the cultural facilities map, community input,<br />
and socio-economic statistics. In the absence <strong>of</strong> such information it would be difficult to conclude<br />
from the correlation <strong>of</strong> these two disparate maps how the under-serviced areas <strong>of</strong> the city<br />
might be improved.<br />
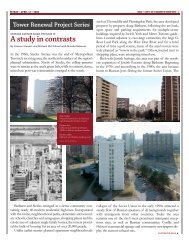
<strong>Cultural</strong> facilities require large commitments <strong>of</strong> time and money from host communities. A<br />
close look at two communities outside the downtown area – Oakwood/Vaughan and Weston<br />
Village — reveals that an articulated need for programs and space fueled by community will,<br />
tenacity and financial resources are the driving forces behind the creation and operation <strong>of</strong><br />
community-based cultural facilities. <strong>Cultural</strong> facilities that are imposed upon communities<br />
rarely succeed. From the examples below, it is clear that the respective cultural facilities were<br />
the result <strong>of</strong> determined and focused community work and commitment.<br />
<strong>Cultural</strong> Facility Analysis page 20 <strong>of</strong> 27