IRIS RECOGNITION BASED ON HILBERT–HUANG TRANSFORM 1 ...
IRIS RECOGNITION BASED ON HILBERT–HUANG TRANSFORM 1 ...
IRIS RECOGNITION BASED ON HILBERT–HUANG TRANSFORM 1 ...

Create successful ePaper yourself
Turn your PDF publications into a flip-book with our unique Google optimized e-Paper software.
632 Z.Yang,Z.Yang&L.Yang<br />
Main Frequency Center<br />
0.07<br />
0.06<br />
0.05<br />
0.04<br />
0.03<br />
(a) (b) (c)<br />
0 20 40 60 80<br />
Orientation<br />
100 120 140 160<br />
(d)<br />
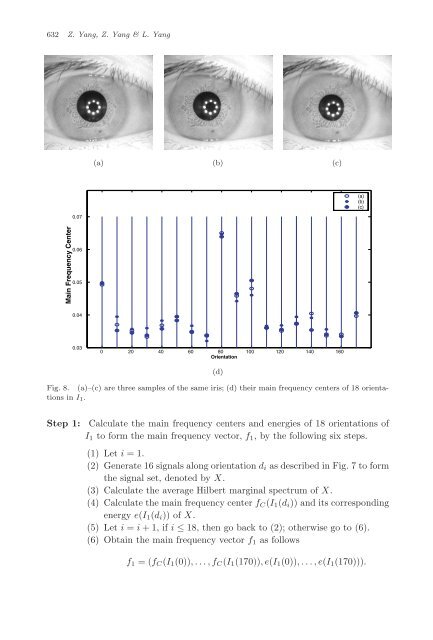
Fig. 8. (a)–(c) are three samples of the same iris; (d) their main frequency centers of 18 orientations<br />
in I1.<br />
Step 1: Calculate the main frequency centers and energies of 18 orientations of<br />
I1 to form the main frequency vector, f1, by the following six steps.<br />
(1) Let i =1.<br />
(2) Generate 16 signals along orientation di as described in Fig. 7 to form<br />
the signal set, denoted by X.<br />
(3) Calculate the average Hilbert marginal spectrum of X.<br />
(4) Calculate the main frequency center fC(I1(di)) and its corresponding<br />
energy e(I1(di)) of X.<br />
(5) Let i = i +1, if i ≤ 18, then go back to (2); otherwise go to (6).<br />
(6) Obtain the main frequency vector f1 as follows<br />
f1 =(fC(I1(0)),...,fC(I1(170)),e(I1(0)),...,e(I1(170))).<br />
(a)<br />
(b)<br />
(c)