IRIS RECOGNITION BASED ON HILBERT–HUANG TRANSFORM 1 ...
IRIS RECOGNITION BASED ON HILBERT–HUANG TRANSFORM 1 ...
IRIS RECOGNITION BASED ON HILBERT–HUANG TRANSFORM 1 ...

You also want an ePaper? Increase the reach of your titles
YUMPU automatically turns print PDFs into web optimized ePapers that Google loves.
628 Z.Yang,Z.Yang&L.Yang<br />
Hilbert marginal spectrum of xj(t). The average Hilbert marginal spectrum of X<br />
is defined as<br />
H(f) = 1<br />
N<br />
hj(f). (4)<br />
N<br />
j=1<br />
f H m is called as the average main frequency of X if f H m satisfies H(f H m ) ≥ H(f), ∀f.<br />
For a given set of signal series, in which signals are approximately periodic, the<br />
main frequency can characterize the approximate period very well. Unfortunately, in<br />
some cases a signal may not have a unique main frequency. To handle this situation,<br />
all the possible main frequencies have to be considered. Therefore, we can utilize<br />
the gravity frequencies, which is called the “main frequency center”, instead of the<br />
“main frequency”.<br />
Definition 3 (Main frequency center). Let H(fi) (j =1, 2,...,W)bethe<br />
average Hilbert marginal spectrum of X = {xj(t)|j =1, 2,...,N}. Assume H(fi)<br />
is monotone decreasing respect to i. The main frequency center of X is defined as<br />
fC(X) =<br />
M<br />
i=1 fiH(fi)<br />
M<br />
i=1<br />
H(fi) , (5)<br />
where M is the minimum integer satisfying M i=1 H(fi) ≥ P W i=1 H(fi), and 0 <<br />
P < 1 is a given constant. Then e =(1/M ) M i=1 H(fi) is called the energy of<br />
fC(X).<br />
As can be seen from its definition, the main frequency center is the weighted<br />
mean of several frequencies whose Hilbert marginal spectrums are largest. There<br />
and the main frequency center<br />
is a gap between the average main frequency f H m<br />
fC, but the main frequency center will be a steadier recognition feature. Therefore<br />
the main frequency center fC is used instead of the average main frequency f H m to<br />
characterize the approximate period of signal series.<br />
3.3. Iris feature extraction<br />
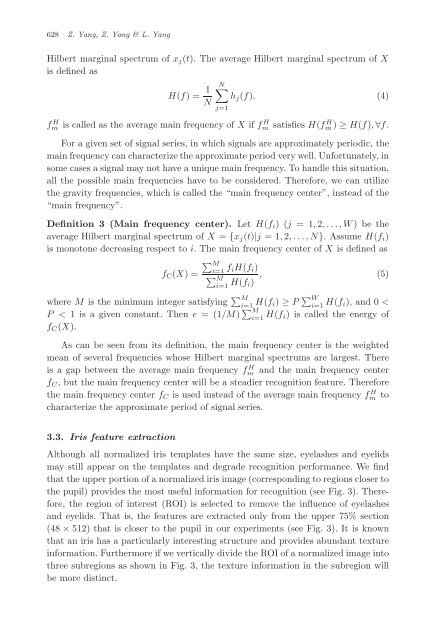
Although all normalized iris templates have the same size, eyelashes and eyelids<br />
may still appear on the templates and degrade recognition performance. We find<br />
that the upper portion of a normalized iris image (corresponding to regions closer to<br />
the pupil) provides the most useful information for recognition (see Fig. 3). Therefore,<br />
the region of interest (ROI) is selected to remove the influence of eyelashes<br />
and eyelids. That is, the features are extracted only from the upper 75% section<br />
(48 × 512) that is closer to the pupil in our experiments (see Fig. 3). It is known<br />
that an iris has a particularly interesting structure and provides abundant texture<br />
information. Furthermore if we vertically divide the ROI of a normalized image into<br />
three subregions as shown in Fig. 3, the texture information in the subregion will<br />
be more distinct.