IRIS RECOGNITION BASED ON HILBERT–HUANG TRANSFORM 1 ...
IRIS RECOGNITION BASED ON HILBERT–HUANG TRANSFORM 1 ...
IRIS RECOGNITION BASED ON HILBERT–HUANG TRANSFORM 1 ...

Create successful ePaper yourself
Turn your PDF publications into a flip-book with our unique Google optimized e-Paper software.
630 Z.Yang,Z.Yang&L.Yang<br />
210<br />
200<br />
190<br />
180<br />
170<br />
160<br />
150<br />
140<br />
130<br />
120<br />
320 340 360 380 400 ϖϖ<br />
420 440<br />
210<br />
200<br />
190<br />
180<br />
170<br />
160<br />
150<br />
140<br />
130<br />
120<br />
320 340 360 380 400 420 440<br />
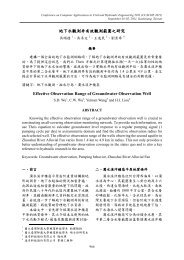
Fig. 5. Left, the original signal (solid line) and the third IMF (dash line) in the interval [320,<br />
450]. Right, the original signal (solid line) and the fourth IMF (dash line) in [320, 450].<br />
Frequency Content<br />
700<br />
600<br />
500<br />
400<br />
300<br />
200<br />
100<br />
0<br />
0 0.038 0.068 0.1 0.2<br />
Frequency (Hz)<br />
0.3 0.4 0.45<br />
Frequency Content<br />
700<br />
600<br />
500<br />
400<br />
300<br />
200<br />
100<br />
0<br />
0 0.036 0.069 0.1 0.2<br />
Frequency (Hz)<br />
0.3 0.4 0.45<br />
Frequency Content<br />
700<br />
600<br />
500<br />
400<br />
300<br />
200<br />
100<br />
f C<br />
0<br />
0 0.051 0.1 0.2<br />
Frequency (Hz)<br />
0.3 0.4 0.45<br />
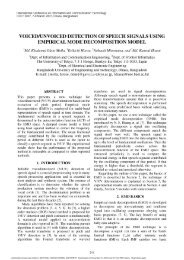
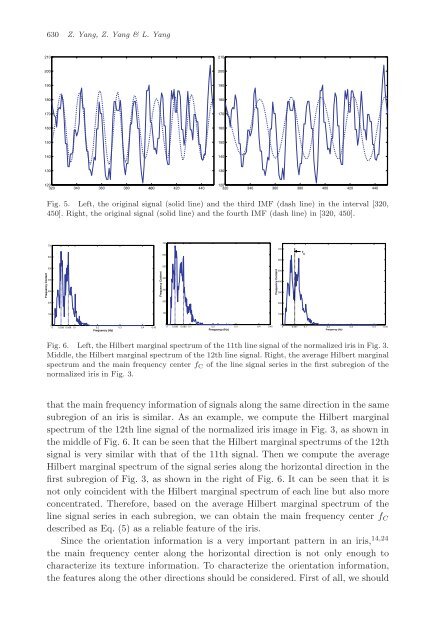
Fig. 6. Left, the Hilbert marginal spectrum of the 11th line signal of the normalized iris in Fig. 3.<br />
Middle, the Hilbert marginal spectrum of the 12th line signal. Right, the average Hilbert marginal<br />
spectrum and the main frequency center fC of the line signal series in the first subregion of the<br />
normalized iris in Fig. 3.<br />
that the main frequency information of signals along the same direction in the same<br />
subregion of an iris is similar. As an example, we compute the Hilbert marginal<br />
spectrum of the 12th line signal of the normalized iris image in Fig. 3, as shown in<br />
the middle of Fig. 6. It can be seen that the Hilbert marginal spectrums of the 12th<br />
signal is very similar with that of the 11th signal. Then we compute the average<br />
Hilbert marginal spectrum of the signal series along the horizontal direction in the<br />
first subregion of Fig. 3, as shown in the right of Fig. 6. It can be seen that it is<br />
not only coincident with the Hilbert marginal spectrum of each line but also more<br />
concentrated. Therefore, based on the average Hilbert marginal spectrum of the<br />
line signal series in each subregion, we can obtain the main frequency center fC<br />
described as Eq. (5) as a reliable feature of the iris.<br />
Since the orientation information is a very important pattern in an iris, 14,24<br />
the main frequency center along the horizontal direction is not only enough to<br />
characterize its texture information. To characterize the orientation information,<br />
the features along the other directions should be considered. First of all, we should