etadd_48(1) - Division on Autism and Developmental Disabilities
etadd_48(1) - Division on Autism and Developmental Disabilities
etadd_48(1) - Division on Autism and Developmental Disabilities

Create successful ePaper yourself
Turn your PDF publications into a flip-book with our unique Google optimized e-Paper software.
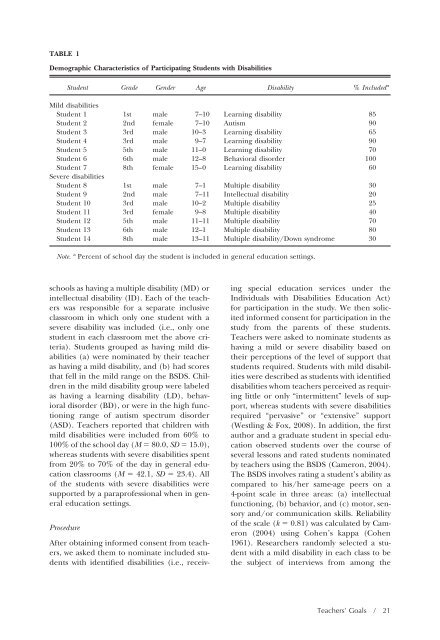
TABLE 1<br />
Demographic Characteristics of Participating Students with <strong>Disabilities</strong><br />
schools as having a multiple disability (MD) or<br />
intellectual disability (ID). Each of the teachers<br />
was resp<strong>on</strong>sible for a separate inclusive<br />
classroom in which <strong>on</strong>ly <strong>on</strong>e student with a<br />
severe disability was included (i.e., <strong>on</strong>ly <strong>on</strong>e<br />
student in each classroom met the above criteria).<br />
Students grouped as having mild disabilities<br />
(a) were nominated by their teacher<br />
as having a mild disability, <strong>and</strong> (b) had scores<br />
that fell in the mild range <strong>on</strong> the BSDS. Children<br />
in the mild disability group were labeled<br />
as having a learning disability (LD), behavioral<br />
disorder (BD), or were in the high functi<strong>on</strong>ing<br />
range of autism spectrum disorder<br />
(ASD). Teachers reported that children with<br />
mild disabilities were included from 60% to<br />
100% of the school day (M 80.0, SD 15.0),<br />
whereas students with severe disabilities spent<br />
from 20% to 70% of the day in general educati<strong>on</strong><br />
classrooms (M 42.1, SD 23.4). All<br />
of the students with severe disabilities were<br />
supported by a paraprofessi<strong>on</strong>al when in general<br />
educati<strong>on</strong> settings.<br />
Procedure<br />
Student Grade Gender Age Disability % Included a<br />
Mild disabilities<br />
Student 1 1st male 7–10 Learning disability 85<br />
Student 2 2nd female 7–10 <strong>Autism</strong> 90<br />
Student 3 3rd male 10–3 Learning disability 65<br />
Student 4 3rd male 9–7 Learning disability 90<br />
Student 5 5th male 11–0 Learning disability 70<br />
Student 6 6th male 12–8 Behavioral disorder 100<br />
Student 7 8th female 15–0 Learning disability 60<br />
Severe disabilities<br />
Student 8 1st male 7–1 Multiple disability 30<br />
Student 9 2nd male 7–11 Intellectual disability 20<br />
Student 10 3rd male 10–2 Multiple disability 25<br />
Student 11 3rd female 9–8 Multiple disability 40<br />
Student 12 5th male 11–11 Multiple disability 70<br />
Student 13 6th male 12–1 Multiple disability 80<br />
Student 14 8th male 13–11 Multiple disability/Down syndrome 30<br />
Note. a Percent of school day the student is included in general educati<strong>on</strong> settings.<br />
After obtaining informed c<strong>on</strong>sent from teachers,<br />
we asked them to nominate included students<br />
with identified disabilities (i.e., receiv-<br />
ing special educati<strong>on</strong> services under the<br />
Individuals with <strong>Disabilities</strong> Educati<strong>on</strong> Act)<br />
for participati<strong>on</strong> in the study. We then solicited<br />
informed c<strong>on</strong>sent for participati<strong>on</strong> in the<br />
study from the parents of these students.<br />
Teachers were asked to nominate students as<br />
having a mild or severe disability based <strong>on</strong><br />
their percepti<strong>on</strong>s of the level of support that<br />
students required. Students with mild disabilities<br />
were described as students with identified<br />
disabilities whom teachers perceived as requiring<br />
little or <strong>on</strong>ly “intermittent” levels of support,<br />
whereas students with severe disabilities<br />
required “pervasive” or “extensive” support<br />
(Westling & Fox, 2008). In additi<strong>on</strong>, the first<br />
author <strong>and</strong> a graduate student in special educati<strong>on</strong><br />
observed students over the course of<br />
several less<strong>on</strong>s <strong>and</strong> rated students nominated<br />
by teachers using the BSDS (Camer<strong>on</strong>, 2004).<br />
The BSDS involves rating a student’s ability as<br />
compared to his/her same-age peers <strong>on</strong> a<br />
4-point scale in three areas: (a) intellectual<br />
functi<strong>on</strong>ing, (b) behavior, <strong>and</strong> (c) motor, sensory<br />
<strong>and</strong>/or communicati<strong>on</strong> skills. Reliability<br />
of the scale (k 0.81) was calculated by Camer<strong>on</strong><br />
(2004) using Cohen’s kappa (Cohen<br />
1961). Researchers r<strong>and</strong>omly selected a student<br />
with a mild disability in each class to be<br />
the subject of interviews from am<strong>on</strong>g the<br />
Teachers’ Goals / 21