etadd_48(1) - Division on Autism and Developmental Disabilities
etadd_48(1) - Division on Autism and Developmental Disabilities
etadd_48(1) - Division on Autism and Developmental Disabilities

You also want an ePaper? Increase the reach of your titles
YUMPU automatically turns print PDFs into web optimized ePapers that Google loves.
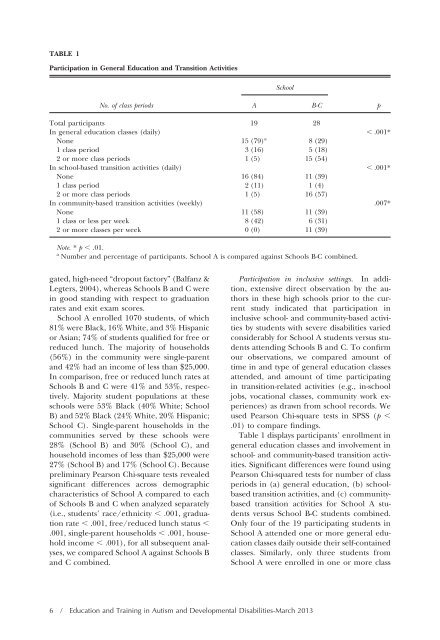
TABLE 1<br />
Participati<strong>on</strong> in General Educati<strong>on</strong> <strong>and</strong> Transiti<strong>on</strong> Activities<br />
gated, high-need “dropout factory” (Balfanz &<br />
Legters, 2004), whereas Schools B <strong>and</strong> C were<br />
in good st<strong>and</strong>ing with respect to graduati<strong>on</strong><br />
rates <strong>and</strong> exit exam scores.<br />
School A enrolled 1070 students, of which<br />
81% were Black, 16% White, <strong>and</strong> 3% Hispanic<br />
or Asian; 74% of students qualified for free or<br />
reduced lunch. The majority of households<br />
(56%) in the community were single-parent<br />
<strong>and</strong> 42% had an income of less than $25,000.<br />
In comparis<strong>on</strong>, free or reduced lunch rates at<br />
Schools B <strong>and</strong> C were 41% <strong>and</strong> 53%, respectively.<br />
Majority student populati<strong>on</strong>s at these<br />
schools were 53% Black (40% White; School<br />
B) <strong>and</strong> 52% Black (24% White, 20% Hispanic;<br />
School C). Single-parent households in the<br />
communities served by these schools were<br />
28% (School B) <strong>and</strong> 30% (School C), <strong>and</strong><br />
household incomes of less than $25,000 were<br />
27% (School B) <strong>and</strong> 17% (School C). Because<br />
preliminary Pears<strong>on</strong> Chi-square tests revealed<br />
significant differences across demographic<br />
characteristics of School A compared to each<br />
of Schools B <strong>and</strong> C when analyzed separately<br />
(i.e., students’ race/ethnicity .001, graduati<strong>on</strong><br />
rate .001, free/reduced lunch status <br />
.001, single-parent households .001, household<br />
income .001), for all subsequent analyses,<br />
we compared School A against Schools B<br />
<strong>and</strong> C combined.<br />
School<br />
No. of class periods A B-C p<br />
Total participants 19 28<br />
In general educati<strong>on</strong> classes (daily) .001*<br />
N<strong>on</strong>e 15 (79) a<br />
8 (29)<br />
1 class period 3 (16) 5 (18)<br />
2 or more class periods 1 (5) 15 (54)<br />
In school-based transiti<strong>on</strong> activities (daily) .001*<br />
N<strong>on</strong>e 16 (84) 11 (39)<br />
1 class period 2 (11) 1 (4)<br />
2 or more class periods 1 (5) 16 (57)<br />
In community-based transiti<strong>on</strong> activities (weekly) .007*<br />
N<strong>on</strong>e 11 (58) 11 (39)<br />
1 class or less per week 8 (42) 6 (31)<br />
2 or more classes per week 0 (0) 11 (39)<br />
Note. * p .01.<br />
a Number <strong>and</strong> percentage of participants. School A is compared against Schools B-C combined.<br />
Participati<strong>on</strong> in inclusive settings. In additi<strong>on</strong>,<br />
extensive direct observati<strong>on</strong> by the authors<br />
in these high schools prior to the current<br />
study indicated that participati<strong>on</strong> in<br />
inclusive school- <strong>and</strong> community-based activities<br />
by students with severe disabilities varied<br />
c<strong>on</strong>siderably for School A students versus students<br />
attending Schools B <strong>and</strong> C. To c<strong>on</strong>firm<br />
our observati<strong>on</strong>s, we compared amount of<br />
time in <strong>and</strong> type of general educati<strong>on</strong> classes<br />
attended, <strong>and</strong> amount of time participating<br />
in transiti<strong>on</strong>-related activities (e.g., in-school<br />
jobs, vocati<strong>on</strong>al classes, community work experiences)<br />
as drawn from school records. We<br />
used Pears<strong>on</strong> Chi-square tests in SPSS (p <br />
.01) to compare findings.<br />
Table 1 displays participants’ enrollment in<br />
general educati<strong>on</strong> classes <strong>and</strong> involvement in<br />
school- <strong>and</strong> community-based transiti<strong>on</strong> activities.<br />
Significant differences were found using<br />
Pears<strong>on</strong> Chi-squared tests for number of class<br />
periods in (a) general educati<strong>on</strong>, (b) schoolbased<br />
transiti<strong>on</strong> activities, <strong>and</strong> (c) communitybased<br />
transiti<strong>on</strong> activities for School A students<br />
versus School B-C students combined.<br />
Only four of the 19 participating students in<br />
School A attended <strong>on</strong>e or more general educati<strong>on</strong><br />
classes daily outside their self-c<strong>on</strong>tained<br />
classes. Similarly, <strong>on</strong>ly three students from<br />
School A were enrolled in <strong>on</strong>e or more class<br />
6 / Educati<strong>on</strong> <strong>and</strong> Training in <strong>Autism</strong> <strong>and</strong> <strong>Developmental</strong> <strong>Disabilities</strong>-March 2013