designated market area overview - Cushman & Wakefield's Global ...
designated market area overview - Cushman & Wakefield's Global ...
designated market area overview - Cushman & Wakefield's Global ...

You also want an ePaper? Increase the reach of your titles
YUMPU automatically turns print PDFs into web optimized ePapers that Google loves.
DESIGNATED MARKET<br />
AREA OVERVIEW<br />
UNITED STATES - NORTHEAST CORRIDOR<br />
INTRODUCTION DMA OVERVIEW<br />
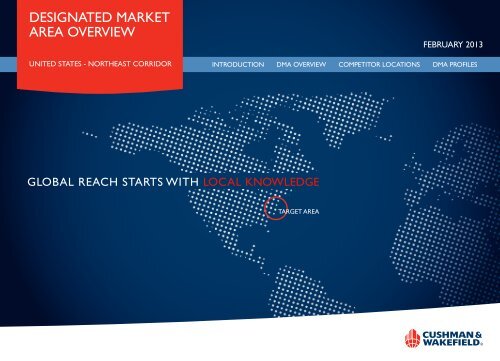
GLOBAL REACH STARTS WITH LOCAL KNOWLEDGE<br />
TARGET AREA<br />
COMPETITOR LOCATIONS<br />
FEBRUARY 2013<br />
DMA PROFILES
INTRODUCTION<br />
Project Objectives & Methodology<br />
STUDY NOTES<br />
• The Study Area sits along the Atlantic<br />
Coast of the U.S., extending from Boston,<br />
Massachusetts in the north, moving south to<br />
Washington, DC.<br />
• This <strong>area</strong> is sometimes collectively<br />
referred to as the “Northeast Corridor”<br />
and comprises the following Designated<br />
Market Areas* (DMAs): Boston/Manchester,<br />
Providence/New Bedford, Hartford/New<br />
Haven, New York, Philadelphia, Baltimore, and<br />
Washington, DC/ Hagerstown.<br />
• The Study Area accounts for roughly 15.7%<br />
of the total U.S. population and 16.9%<br />
percent of U.S. retail sales.<br />
• I-95 Interstate Highway (Motorway) and the<br />
Amtrak national railroad train lines connect<br />
the major <strong>market</strong>s within the corridor.<br />
• <strong>Cushman</strong> & Wakefield (C&W) utilized C&W<br />
Research, C&W Mapping Services, input from<br />
C&W retail professionals from each of the<br />
<strong>market</strong> <strong>area</strong>s, as well as 3rd party sources to<br />
compile the information.<br />
*A DMA is a geographic <strong>area</strong> that represents<br />
individual television/ media <strong>market</strong>s as<br />
defined by Nielsen Media Research. Each<br />
DMA comprises the major television viewing<br />
audience located in the particular metropolitan<br />
<strong>area</strong>. DMAs often correspond with the<br />
standard metropolitan statistical <strong>area</strong>.<br />
NORTHEAST CORRIDOR / STUDY AREA<br />
INTRODUCTION DMA OVERVIEW<br />
COMPETITOR LOCATIONS<br />
NORTHEAST<br />
CORRIDOR<br />
RETAIL STUDY<br />
DMA PROFILES<br />
CUSHMAN & WAKEFIELD
DMA OVERVIEW<br />
Demographic Comparison<br />
DEMOGRAPHIC CHARACTERISTICS SUMMARY<br />
DMA COMPARISON<br />
CHARACTERISTIC BOSTON PROVIDENCE /<br />
NEW BEDFORD<br />
HARTFORD /<br />
NEW HAVEN<br />
NEW YORK PHILADELPHIA BALTIMORE WASHINGTON,<br />
D.C.<br />
DMA TOTAL US<br />
Population (Mil) 6.3 1.6 2.6 20.9 8.0 2.9 6.5 49.1 313.0<br />
Median Age 38.8 39.2 39.4 37.8 38.0 37.7 36.7 37.9 36.7<br />
Average HH Income $85,043 $67,625 $78,691 $86,976 $75,305 $80,862 $98,298 $84,781 $67,315<br />
Median HH Income $64,192 $52,307 $61,212 $61,423 $56,587 $62,284 $75,509 $62,456 $49,545<br />
INCOME BREAKDOWN<br />
< $15,000 10% 14% 10% 13% 12% 10% 7% 11% 13%<br />
$15,000 to $34,999 16% 20% 17% 17% 19% 17% 12% 16% 22%<br />
$35,000 to $74,999 31% 33% 33% 29% 33% 33% 30% 31% 35%<br />
$75,000 to $99,999 14% 13% 15% 13% 13% 14% 15% 13% 12%<br />
$100,000 + 28% 19% 25% 29% 23% 26% 35% 28% 18%<br />
EDUCATION<br />
< High School 4% 8% 4% 8% 4% 4% 5% 6% 6%<br />
High School<br />
< Diploma<br />
6% 9% 7% 8% 9% 8% 6% 7% 8%<br />
High School Graduate 26% 29% 30% 27% 32% 28% 22% 27% 29%<br />
Some College 17% 17% 18% 16% 18% 20% 18% 17% 21%<br />
College Degree<br />
< Bachelor<br />
8% 8% 8% 7% 7% 6% 6% 7% 7%<br />
Bachelor Degree 23% 18% 18% 21% 19% 19% 23% 21% 18%<br />
Advanced Degree 17% 10% 14% 15% 12% 14% 20% 15% 10%<br />
CLICK TO VIEW COMPARISON OF DMA RETAIL SALES<br />
INTRODUCTION DMA OVERVIEW<br />
COMPETITOR LOCATIONS<br />
NORTHEAST<br />
CORRIDOR<br />
RETAIL STUDY<br />
DMA PROFILES<br />
CUSHMAN & WAKEFIELD
COMPARISON OF DMA RETAIL SALES<br />
DMA TOTAL RETAIL SALES % OF DMAS % OF US<br />
New York, NY $314,912,333,654 40.7% 6.9%<br />
Philadelphia, PA $124,395,892,389 16.1% 2.7%<br />
Washington, DC/Hagerstown, MD $111,714,381,870 14.5% 2.4%<br />
Boston, MA $106,046,310,119 13.5% 2.3%<br />
Baltimore, MD $47,155,046,068 6.1% 1.0%<br />
Hartford/New Haven, CT $44,133,583,643 5.7% 1.0%<br />
Providence, RI/New Bedford, MA $24,704,955,697 3.2% 0.5%<br />
DMA Total $773,062,503,440 100.0% 16.9%<br />
Entire US $4,575,878,708,220 N/A N/A<br />
NORTHEAST<br />
CORRIDOR<br />
RETAIL STUDY<br />
CUSHMAN & WAKEFIELD
COMPETITIVE & COMPLEMENTARY RETAILER LOCATIONS<br />
Demographic Comparison and Competitor Locations<br />
RETAILER MATRIx - NUMBER OF STORES BY DMA<br />
RETAILER BOSTON PROVIDENCE /<br />
NEW BEDFORD<br />
HARTFORD /<br />
NEW HAVEN<br />
NEW YORK PHILADELPHIA BALTIMORE WASHINGTON, D.C. DMA TOTAL US<br />
Century 21 0 0 0 7 0 0 0 7 7<br />
Forever 21 12 3 6 35 13 8 8 85 455<br />
H&M 8 4 5 46 15 7 13 98 251<br />
Old Navy 27 7 11 66 29 11 21 172 953<br />
TJMaxx 52 12 20 69 25 9 23 210 983<br />
Uniqlo 0 0 0 4 0 0 0 4 4<br />
Zara 2 0 0 12 1 0 3 18 45<br />
Total 101 26 42 239 83 35 68 594 2,698<br />
CLICK LOGOS TO VIEW STORE LOCATIONS<br />
INTRODUCTION DMA OVERVIEW<br />
COMPETITOR LOCATIONS<br />
NORTHEAST<br />
CORRIDOR<br />
RETAIL STUDY<br />
DMA PROFILES<br />
CUSHMAN & WAKEFIELD
LOCATION MAP - NORTHEAST DMAs<br />
8 Boston<br />
4 Providence/New Bedford<br />
5 Hartford/New Haven<br />
46 New York<br />
15 Philadelphia<br />
7 Baltimore<br />
13 Washington D.C./Hagerstown<br />
98 Total<br />
DATA IS FROM SOURCES DEEMED RELIABLE BUY MAY BE SUBJECT TO ERRORS, OMISSIONS, OR<br />
MODIFICATIONS. THE INFORMATION HEREIN IS PROVIDED WITHOUT REPRESENTATION OR WARRANTY<br />
NORTHEAST<br />
CORRIDOR<br />
RETAIL STUDY<br />
CUSHMAN & WAKEFIELD
LOCATION MAP - NORTHEAST DMAs<br />
27 Boston<br />
7 Providence/New Bedford<br />
11 Hartford/New Haven<br />
66 New York<br />
29 Philadelphia<br />
11 Baltimore<br />
21 Washington D.C./Hagerstown<br />
172 Total<br />
DATA IS FROM SOURCES DEEMED RELIABLE BUY MAY BE SUBJECT TO ERRORS, OMISSIONS, OR<br />
MODIFICATIONS. THE INFORMATION HEREIN IS PROVIDED WITHOUT REPRESENTATION OR WARRANTY<br />
NORTHEAST<br />
CORRIDOR<br />
RETAIL STUDY<br />
CUSHMAN & WAKEFIELD
LOCATION MAP - NORTHEAST DMAs<br />
52 Boston<br />
12 Providence/New Bedford<br />
20 Hartford/New Haven<br />
69 New York<br />
25 Philadelphia<br />
9 Baltimore<br />
23 Washington D.C./Hagerstown<br />
210 Total<br />
DATA IS FROM SOURCES DEEMED RELIABLE BUY MAY BE SUBJECT TO ERRORS, OMISSIONS, OR<br />
MODIFICATIONS. THE INFORMATION HEREIN IS PROVIDED WITHOUT REPRESENTATION OR WARRANTY<br />
NORTHEAST<br />
CORRIDOR<br />
RETAIL STUDY<br />
CUSHMAN & WAKEFIELD
LOCATION MAP - NORTHEAST DMAs<br />
0 Boston<br />
0 Providence/New Bedford<br />
0 Hartford/New Haven<br />
7 New York<br />
0 Philadelphia<br />
0 Baltimore<br />
0 Washington D.C./Hagerstown<br />
7 Total<br />
DATA IS FROM SOURCES DEEMED RELIABLE BUY MAY BE SUBJECT TO ERRORS, OMISSIONS, OR<br />
MODIFICATIONS. THE INFORMATION HEREIN IS PROVIDED WITHOUT REPRESENTATION OR WARRANTY<br />
NORTHEAST<br />
CORRIDOR<br />
RETAIL STUDY<br />
CUSHMAN & WAKEFIELD
LOCATION MAP - NORTHEAST DMAs<br />
0 Boston<br />
0 Providence/New Bedford<br />
0 Hartford/New Haven<br />
4 New York<br />
0 Philadelphia<br />
0 Baltimore<br />
0 Washington D.C./Hagerstown<br />
4 Total<br />
DATA IS FROM SOURCES DEEMED RELIABLE BUY MAY BE SUBJECT TO ERRORS, OMISSIONS, OR<br />
MODIFICATIONS. THE INFORMATION HEREIN IS PROVIDED WITHOUT REPRESENTATION OR WARRANTY<br />
NORTHEAST<br />
CORRIDOR<br />
RETAIL STUDY<br />
CUSHMAN & WAKEFIELD
LOCATION MAP - NORTHEAST DMAs<br />
12 0 Boston<br />
3 7 Providence/New New York Bedford<br />
6 0 Hartford/New Philadelphia Haven<br />
35 0 New Baltimore York<br />
13 0 Philadelphia Washington D.C.<br />
8 7 Baltimore Total<br />
8 Washington D.C./Hagerstown<br />
85 Total<br />
DATA IS FROM SOURCES DEEMED RELIABLE BUY MAY BE SUBJECT TO ERRORS, OMISSIONS, OR<br />
MODIFICATIONS. THE INFORMATION HEREIN IS PROVIDED WITHOUT REPRESENTATION OR WARRANTY<br />
NORTHEAST<br />
CORRIDOR<br />
RETAIL STUDY<br />
CUSHMAN & WAKEFIELD
LOCATION MAP - NORTHEAST DMAs<br />
2 Boston<br />
0 Providence/New Bedford<br />
0 Hartford/New Haven<br />
12 New York<br />
1 Philadelphia<br />
0 Baltimore<br />
3 Washington D.C./Hagerstown<br />
18 Total<br />
DATA IS FROM SOURCES DEEMED RELIABLE BUY MAY BE SUBJECT TO ERRORS, OMISSIONS, OR<br />
MODIFICATIONS. THE INFORMATION HEREIN IS PROVIDED WITHOUT REPRESENTATION OR WARRANTY<br />
NORTHEAST<br />
CORRIDOR<br />
RETAIL STUDY<br />
CUSHMAN & WAKEFIELD
DMA PROFILES<br />
DMA PROFILES<br />
A DMA is a geographic <strong>area</strong> that<br />
represents individual television/<br />
media <strong>market</strong>s as defined by<br />
Nielsen Media Research. Each DMA<br />
comprises the major television<br />
viewing audience located in the<br />
particular metropolitan <strong>area</strong>. DMAs<br />
often correspond with the standard<br />
metropolitan statistical <strong>area</strong>.<br />
Click images to view individual DMA<br />
NEW YORK DMA<br />
BOSTON DMA<br />
PHILADELPHIA DMA<br />
INTRODUCTION DMA OVERVIEW<br />
PROVIDENCE /<br />
NEW BEDFORD DMA<br />
BALTIMORE DMA<br />
COMPETITOR LOCATIONS<br />
WASHINGTON, D.C. /<br />
HAGERSTOWN DMA<br />
NORTHEAST<br />
CORRIDOR<br />
RETAIL STUDY<br />
DMA PROFILES<br />
HARTFORD / NEW HAVEN DMA<br />
CUSHMAN & WAKEFIELD
BOSTON DMA<br />
DMA HIGHLIGHTS<br />
• More than 6.3 million residents (7th largest DMA in U.S.)<br />
• Median household income is 29.5% higher than national median<br />
• Highly educated population; 40% of residents hold at least a college degree<br />
(6th highest in U.S.); 17% hold post graduate degrees<br />
• Home to some of the world’s top universities and has the highest percentage<br />
of college students of any major city in the U.S.<br />
INTRODUCTION DMA OVERVIEW<br />
TOTAL RETAIL SALES<br />
$106 billion<br />
% OF 7 DMA RETAIL SALES<br />
13.5%<br />
% OF US RETAIL SALES<br />
2.3%<br />
Economic Overview Demographic Overview Retail Overview Back to Market Profiles<br />
COMPETITOR LOCATIONS<br />
NORTHEAST<br />
CORRIDOR<br />
RETAIL STUDY<br />
DMA PROFILES<br />
BOSTON DMA<br />
CLICK MAP FOR DRIVING<br />
TIME & DISTANCE FROM<br />
BOSTON DMA<br />
CUSHMAN & WAKEFIELD
DRIVE TIME & DISTANCE FROM BOSTON DMA<br />
DATA IS FROM SOURCES DEEMED RELIABLE BUY MAY BE SUBJECT TO ERRORS, OMISSIONS, OR<br />
MODIFICATIONS. THE INFORMATION HEREIN IS PROVIDED WITHOUT REPRESENTATION OR WARRANTY<br />
This map shows the driving time and<br />
distance from the Boston DMA to<br />
other DMAs in the Northeast corridor.<br />
NORTHEAST<br />
CORRIDOR<br />
RETAIL STUDY<br />
Close<br />
CUSHMAN & WAKEFIELD
BOSTON DMA<br />
ECONOMIC OVERVIEW<br />
• A large concentration of universities and medical<br />
research facilities contribute to the <strong>area</strong>’s<br />
economic strength<br />
• Business Services, Healthcare, Education and<br />
Technology are among most prominent industries<br />
CHARACTERISTIC BOSTON U.S.<br />
2012 EST. CIVILIAN EMPLOYED POPULATION AGE 16+<br />
Blue Collar 15.7% 21.1%<br />
White Collar 67.9% 60.6%<br />
Service & Farm 16.4% 18.2%<br />
Total Employment 100.0% 100.0%<br />
CHARACTERISTIC BOSTON U.S.<br />
2012 EST. CIVILIAN EMPLOYED POPULATION AGE 16+<br />
Architect/Engineer 2.5% 1.9%<br />
Arts/Entertain/Sports 2.2% 1.9%<br />
Building Grounds Maint 3.4% 3.9%<br />
Business/Financial Ops 5.7% 4.4%<br />
Community/Soc Svcs 1.7% 1.6%<br />
Computer/Mathematical 3.8% 2.4%<br />
Construction/Extraction 4.4% 5.6%<br />
Edu/Training/Library 7.0% 6.0%<br />
Farm/Fish/Forestry 0.2% 0.7%<br />
Food Prep/Serving 5.0% 5.5%<br />
Health Practitioner/Tec 6.0% 5.3%<br />
Healthcare Support 2.3% 2.4%<br />
Maintenance Repair 2.6% 3.4%<br />
Legal 1.6% 1.2%<br />
Life/Phys/Soc Science 1.9% 0.9%<br />
Management 11.2% 9.7%<br />
Office/Admin Support 13.4% 14.0%<br />
Production Occupations 4.5% 6.1%<br />
Protective Svcs 2.1% 2.2%<br />
Sales/Related 10.9% 11.2%<br />
Personal Care/Svc 3.4% 3.5%<br />
Transportation/Moving 4.2% 6.0%<br />
Total Employment 100.0% 100.0%<br />
Close
BOSTON DMA<br />
DEMOGRAPHIC OVERVIEW<br />
The demographic characteristics of the Boston DMA are profiled in the table below and include age, income and education levels.<br />
Click forward to view population concentrations and median household income.<br />
CHARACTERISTIC BOSTON US<br />
Population (Mil) 6.3 313.0<br />
Median Age 38.8 36.7<br />
Average HH Income $85,043 $67,315<br />
Median HH Income $64,192 $49,545<br />
INCOME BREAKDOWN<br />
< $15,000 10% 13%<br />
$15,000 to $34,999 16% 22%<br />
$35,000 to $74,999 31% 35%<br />
$75,000 to $99,999 14% 12%<br />
$100,000 + 28% 18%<br />
EDUCATION<br />
< High School 4% 6%<br />
High School < Diploma 6% 8%<br />
High School Graduate 26% 29%<br />
Some College 17% 21%<br />
College Degree < Bachelor 8% 7%<br />
Bachelor Degree 23% 18%<br />
Advanced Degree 17% 10%<br />
PLACEHOLDER<br />
Population Concentrations
BOSTON DMA<br />
BOSTON DMA<br />
POPULATION CONCENTRATION<br />
PLACEHOLDER<br />
DATA IS FROM SOURCES DEEMED RELIABLE BUY MAY BE SUBJECT TO ERRORS, OMISSIONS, OR<br />
Back to Demographic Overview Median Household Income<br />
MODIFICATIONS. THE INFORMATION HEREIN IS PROVIDED WITHOUT REPRESENTATION OR WARRANTY
BOSTON DMA<br />
BOSTON DMA<br />
MEDIAN HOUSEHOLD INCOME<br />
PLACEHOLDER<br />
DATA IS FROM SOURCES DEEMED RELIABLE BUY MAY BE SUBJECT TO ERRORS, OMISSIONS, OR<br />
Back to Population Concentration Close<br />
MODIFICATIONS. THE INFORMATION HEREIN IS PROVIDED WITHOUT REPRESENTATION OR WARRANTY
BOSTON DMA<br />
RETAIL OVERVIEW<br />
This section provides key information on major retail shopping centers, high streets (if applicable) and competitive and complementary retailers.<br />
PLACEHOLDER<br />
Retail Center Summary
1<br />
2<br />
3<br />
4<br />
5<br />
6<br />
7<br />
8<br />
9<br />
BOSTON DMA<br />
RETAIL CENTER SUMMARY<br />
(800,000+ sqft)<br />
MALL/<br />
CENTER NAME<br />
South Shore<br />
Plaza<br />
Natick Mall<br />
& Natick<br />
Collection<br />
Holyoke Mall<br />
at Ingleside<br />
ADDRESS CITY STATE ZIP<br />
CODE<br />
250 Granite St Braintree MA 02184 Super<br />
Regional Mall<br />
1245<br />
Worcester St<br />
Burlington Mall 75 Middlesex<br />
Tpke<br />
Northshore<br />
Mall<br />
Emerald<br />
Square<br />
Silver City<br />
Galleria<br />
Square One<br />
Mall<br />
The Mall at<br />
Rockingham<br />
Park<br />
Natick MA 01760 Super<br />
Regional Mall<br />
50 Holyoke St Holyoke MA 01040 Super<br />
Regional Mall<br />
210 Andover<br />
St<br />
999 S<br />
Washington St<br />
2 Galleria Mall<br />
Dr<br />
1201<br />
Broadway<br />
99 Rockingham<br />
Park Blvd<br />
Burlington MA 01803 Super<br />
Regional Mall<br />
Peabody MA 01960 Super<br />
Regional Mall<br />
North<br />
Attleboro<br />
MA 02760 Super<br />
Regional Mall<br />
Taunton MA 02780 Super<br />
Regional Mall<br />
Saugus MA 01906 Super<br />
Regional Mall<br />
Salem NH 03079 Super<br />
Regional Mall<br />
RETAIL TYPE SIZE (SF) SALES<br />
(PSF)<br />
1,714,937 $675 -<br />
$725<br />
1,700,000 $475 -<br />
$500<br />
NO. OF<br />
ANCHORS<br />
NO. OF<br />
SPECIALTY<br />
STORES<br />
ANCHOR TENANTS<br />
4 180 Lord & Taylor, Macy's, Sears,<br />
Filenes<br />
6 270 JC Penney, Lord & Taylor, Macy’s,<br />
Nordstrom, Neiman Marcus,<br />
Sears<br />
1,600,000 - 4 177 H & M, JCPenney, Sears, Target<br />
1,295,000 $725 -<br />
$775<br />
1,215,889 $475 -<br />
$550<br />
1,023,000 $325 -<br />
$360<br />
1,007,284 $225 -<br />
$300<br />
4 155 Filene's, Lord & Taylor, Macy's<br />
and Sears<br />
5 104 Filene's, JCPenney, Lord & Taylor,<br />
Macy's, and Sears<br />
4 165 Macy's, Macy's Men's & Home,<br />
Sears<br />
7 130 Best Buy, Dick's Sporting<br />
Goods, JCPenney, Macy's, Old<br />
Navy, Regal Cinemas, Sears<br />
930,047 - 5 115 Best Buy, Dick's Sporting<br />
Goods, Macy's, Sears, T.J. Maxx<br />
896,292 $900+ 4 140<br />
PLACEHOLDER<br />
Macy’s, Sears<br />
Go to Map Back to Retail Overview Next
10<br />
11<br />
12<br />
BOSTON DMA<br />
RETAIL CENTER SUMMARY<br />
(800,000+ sqft)<br />
MALL/<br />
CENTER NAME<br />
Solomon<br />
Pond Mall<br />
Pheasant<br />
Lane Mall<br />
ADDRESS CITY STATE ZIP<br />
CODE<br />
573-601<br />
Donald J.<br />
Lynch Blvd<br />
288-310 Daniel<br />
Webster Hwy<br />
Eastfield Mall 1655 Boston<br />
Rd<br />
Marlborough MA 01752 Super<br />
Regional Mall<br />
Nashua NH 03060 Super<br />
Regional Mall<br />
Springfield MA 01129 Super<br />
Regional Mall<br />
RETAIL TYPE SIZE (SF) SALES<br />
(PSF)<br />
895,970 $325 -<br />
$375<br />
868,569 $475 -<br />
$550<br />
NO. OF<br />
ANCHORS<br />
NO. OF<br />
SPECIALTY<br />
STORES<br />
PLACEHOLDER<br />
ANCHOR TENANTS<br />
4 115 Macy’s Regal Cinemas<br />
5 135 Sears, JCPenney, Target,<br />
Filenes, and Macy's<br />
824,000 $311 4 83 Macy's, Old Navy, Sears,<br />
Showcase Cinemas<br />
Back<br />
Retail Center Summary Map
BOSTON DMA<br />
RETAIL CENTER SUMMARY MAP<br />
DATA IS FROM SOURCES DEEMED RELIABLE BUY MAY BE SUBJECT TO ERRORS, OMISSIONS, OR<br />
MODIFICATIONS. THE INFORMATION HEREIN IS PROVIDED WITHOUT REPRESENTATION OR WARRANTY<br />
Back to Retail Center Summary<br />
Click on the<br />
PLACEHOLDER numbered locations<br />
to see corresponding<br />
mall/shopping center<br />
summary<br />
High Streets
BOSTON DMA<br />
HIGH STREETS<br />
MARKET OVERVIEW<br />
KEY AREAS / STREETS /<br />
SHOPPING CENTERS<br />
CONSUMER<br />
PROFILE<br />
Newbury Street Tourist, Local Business<br />
Density, Local<br />
Shoppers<br />
Downtown Crossing Tourist, Local Business<br />
Density, Local<br />
Shoppers<br />
Prudential Center & Copley Place<br />
Mall<br />
Tourist, Local Business<br />
Density, Local<br />
Shoppers<br />
Faneuil Hall Marketplace Tourist, Local Business<br />
Density, Local<br />
Shoppers<br />
MAJOR RETAILERS<br />
PRESENT<br />
H&M, American Apparel, Forever 21,Zara,<br />
Urban Outfitters, Banana Republic, Ann<br />
Taylor<br />
Macy’s, H&M, TJ Maxx, DSW, Eddie Bauer<br />
Outlet, Footlocker<br />
Saks Fifth Avenue, Lord & Taylor, Sephora,<br />
Neiman Marcus, Barneys New York, Tiffany<br />
& Co., Jimmy Choo<br />
Ann Taylor, Godiva Chocolatier, Coach,<br />
Urban Outfitters, Victoria’s Secrete<br />
Back to Retail Center Summary<br />
NEW<br />
ENTRANTS<br />
Forever 21,<br />
Converse, Levi’s<br />
B Good, Edible<br />
Arrangements<br />
Cheesecake<br />
Factory, bebe,<br />
Giuseppe<br />
Zanotti<br />
Abercrombie &<br />
Fitch<br />
TYPICAL RENT<br />
FOR UNIT OF<br />
2,000 SQFT<br />
RANGE OF UNIT<br />
SIZES<br />
UNIT SIZES 1,000-16,000 SF<br />
Varied $ 1,000-7,700 SF<br />
Varied $ Varied SF<br />
Varied $ 450 – 6,050 SF<br />
Competitive & Complementary Retailers
BOSTON DMA<br />
COMPETITIVE & COMPLEMENTARY RETAILERS<br />
DATA IS FROM SOURCES DEEMED RELIABLE BUY MAY BE SUBJECT TO ERRORS, OMISSIONS, OR<br />
MODIFICATIONS. THE INFORMATION HEREIN IS PROVIDED WITHOUT REPRESENTATION OR WARRANTY<br />
ExECUTIVE SUMMARY<br />
PLACEHOLDER<br />
Back to High Streets Close
PROVIDENCE / NEW BEDFORD DMA<br />
DMA HIGHLIGHTS<br />
• 1.6 million residents (53rd largest DMA in U.S.)<br />
• Comprises State of Rhode Island, as well as the southwestern coastal <strong>area</strong>s<br />
of Massachusetts<br />
• The City of Providence is Rhode Island’s state capital<br />
• Median annual household income is 5.6% higher than the U.S. median<br />
• 10% of population holds advanced degrees, on par with the U.S. average<br />
INTRODUCTION DMA OVERVIEW<br />
TOTAL RETAIL SALES<br />
$24.7 billion<br />
% OF 7 DMA RETAIL SALES<br />
3.2%<br />
% OF US RETAIL SALES<br />
0.5%<br />
Economic Overview Demographic Overview Retail Overview Back to Market Profiles<br />
COMPETITOR LOCATIONS<br />
PROVIDENCE /<br />
NEW BEDFORD DMA<br />
NORTHEAST<br />
CORRIDOR<br />
RETAIL STUDY<br />
DMA PROFILES<br />
CLICK MAP FOR DRIVING TIME &<br />
DISTANCE FROM PROVIDENCE /<br />
NEW BEDFORD DMA<br />
CUSHMAN & WAKEFIELD
DRIVE TIME & DISTANCE FROM PROVIDENCE / NEW BEDFORD DMA<br />
DATA IS FROM SOURCES DEEMED RELIABLE BUY MAY BE SUBJECT TO ERRORS, OMISSIONS, OR<br />
MODIFICATIONS. THE INFORMATION HEREIN IS PROVIDED WITHOUT REPRESENTATION OR WARRANTY<br />
This map shows the driving time and distance<br />
from the Providence / New Bedford DMA to<br />
other DMAs in the Northeast corridor.<br />
NORTHEAST<br />
CORRIDOR<br />
RETAIL STUDY<br />
Close<br />
CUSHMAN & WAKEFIELD
PROVIDENCE / NEW BEDFORD DMA<br />
ECONOMIC OVERVIEW<br />
• The largest employers in the DMA region are in<br />
the healthcare and financial services sectors<br />
• The <strong>area</strong> is home to the headquarters of two<br />
Fortune 500 companies, CVS Caremark and<br />
Textron<br />
CHARACTERISTIC PROVIDENCE<br />
NEW BEDFORD<br />
U.S.<br />
2012 EST. CIVILIAN EMPLOYED POPULATION AGE 16+<br />
Blue Collar 19.9% 21.1%<br />
White Collar 61.2% 60.6%<br />
Service & Farm 18.9% 18.2%<br />
Total Employment 100.0% 100.0%<br />
CHARACTERISTIC PROVIDENCE<br />
NEW BEDFORD<br />
2012 EST. CIVILIAN EMPLOYED POPULATION AGE 16+<br />
U.S.<br />
Architect/Engineer 1.7% 1.9%<br />
Arts/Entertain/Sports 1.8% 1.9%<br />
Building Grounds Maint 3.3% 3.9%<br />
Business/Financial Ops 4.2% 4.4%<br />
Community/Soc Svcs 2.0% 1.6%<br />
Computer/Mathematical 2.1% 2.4%<br />
Construction/Extraction 5.0% 5.6%<br />
Edu/Training/Library 6.6% 6.0%<br />
Farm/Fish/Forestry 0.3% 0.7%<br />
Food Prep/Serving 5.9% 5.5%<br />
Health Practitioner/Tec 5.8% 5.3%<br />
Healthcare Support 3.4% 2.4%<br />
Maintenance Repair 2.8% 3.4%<br />
Legal 1.0% 1.2%<br />
Life/Phys/Soc Science 1.2% 0.9%<br />
Management 9.4% 9.7%<br />
Office/Admin Support 14.4% 14.0%<br />
Production Occupations 6.9% 6.1%<br />
Protective Svcs 2.3% 2.2%<br />
Sales/Related 11.1% 11.2%<br />
Personal Care/Svc 3.8% 3.5%<br />
Transportation/Moving 5.2% 6.0%<br />
Total Employment 100.0% 100.0%<br />
Close
PROVIDENCE / NEW BEDFORD DMA<br />
DEMOGRAPHIC OVERVIEW<br />
The demographic characteristics of the Providence / New Bedford DMA are profiled in the table below and include age, income and education levels.<br />
Click forward to view population concentrations and median household income.<br />
CHARACTERISTIC PROVIDENCE /<br />
NEW BEDFORD<br />
Population (Mil) 1.6 313.0<br />
Median Age 39.2 36.7<br />
Average HH Income $67,625 $67,315<br />
Median HH Income $52,307 $49,545<br />
INCOME BREAKDOWN<br />
< $15,000 14% 13%<br />
$15,000 to $34,999 20% 22%<br />
$35,000 to $74,999 33% 35%<br />
$75,000 to $99,999 13% 12%<br />
$100,000 + 19% 18%<br />
EDUCATION<br />
< High School 8% 6%<br />
High School < Diploma 9% 8%<br />
High School Graduate 29% 29%<br />
Some College 17% 21%<br />
College Degree < Bachelor 8% 7%<br />
Bachelor Degree 18% 18%<br />
Advanced Degree 10% 10%<br />
US<br />
Population Concentrations
PROVIDENCE / NEW BEDFORD DMA<br />
POPULATION CONCENTRATION<br />
• xxxxxxx<br />
DATA IS FROM SOURCES DEEMED RELIABLE BUY MAY BE SUBJECT TO ERRORS, OMISSIONS, OR<br />
Back to Demographic Overview Median Household Income<br />
MODIFICATIONS. THE INFORMATION HEREIN IS PROVIDED WITHOUT REPRESENTATION OR WARRANTY
PROVIDENCE / NEW BEDFORD DMA<br />
MEDIAN HOUSEHOLD INCOME<br />
DATA IS FROM SOURCES DEEMED RELIABLE BUY MAY BE SUBJECT TO ERRORS, OMISSIONS, OR<br />
Back to Population Concentration Close<br />
MODIFICATIONS. THE INFORMATION HEREIN IS PROVIDED WITHOUT REPRESENTATION OR WARRANTY
PROVIDENCE / NEW BEDFORD DMA<br />
RETAIL OVERVIEW<br />
This section provides key information on major retail shopping centers, high streets (if applicable) and competitive and complementary retailers.<br />
Retail Center Summary
1<br />
PROVIDENCE / NEW BEDFORD DMA<br />
RETAIL CENTER SUMMARY<br />
(800,000+ sqft)<br />
MALL/<br />
CENTER NAME<br />
Providence<br />
Place Mall<br />
ADDRESS CITY STATE ZIP<br />
CODE<br />
1 Providence Pl Providence RI 02903 Super<br />
Regional Mall<br />
RETAIL TYPE SIZE (SF) SALES<br />
(PSF)<br />
NO. OF<br />
ANCHORS<br />
NO. OF<br />
SPECIALTY<br />
STORES<br />
ANCHOR TENANTS<br />
1,263,207 TBD 3 170 JCPenney, Macy's,<br />
Nordstrom<br />
Back to Retail Overview<br />
Retail Center Summary Map
PROVIDENCE / NEW BEDFORD DMA<br />
RETAIL CENTER SUMMARY MAP<br />
DATA IS FROM SOURCES DEEMED RELIABLE BUY MAY BE SUBJECT TO ERRORS, OMISSIONS, OR<br />
MODIFICATIONS. THE INFORMATION HEREIN IS PROVIDED WITHOUT REPRESENTATION OR WARRANTY<br />
Back<br />
Competitive & Complementary Retailers
PROVIDENCE / NEW BEDFORD DMA<br />
COMPETITIVE & COMPLEMENTARY RETAILERS<br />
DATA IS FROM SOURCES DEEMED RELIABLE BUY MAY BE SUBJECT TO ERRORS, OMISSIONS, OR<br />
MODIFICATIONS. THE INFORMATION HEREIN IS PROVIDED WITHOUT REPRESENTATION OR WARRANTY<br />
Back to Retail Center Summary Close
HARTFORD / NEW HAVEN DMA<br />
DMA HIGHLIGHTS<br />
• 2.6 million residents (30th largest DMA in U.S.)<br />
• Functionally co-exists with Springfield, Massachusetts to make up the “The Knowledge<br />
Corridor” in the center of the strategic Boston-New York economic region<br />
• Median household income 23.5% higher than U.S. average<br />
• Highly educated workforce (34.6% with a college degree)<br />
• A diverse economy including high tech, defense manufacturing and insurance<br />
• Major employers include United Technologies Corporation, Aetna Life Insurance, St. Paul<br />
Travelers, The Hartford Financial Services Group, CIGNA, Hartford Steam Boiler, and<br />
Phoenix Life Insurance<br />
• Features a strong transportation network<br />
INTRODUCTION DMA OVERVIEW<br />
TOTAL RETAIL SALES<br />
$44.1 billion<br />
% OF 7 DMA RETAIL SALES<br />
5.7%<br />
% OF US RETAIL SALES<br />
1.0%<br />
Economic Overview Demographic Overview Retail Overview Back to Market Profiles<br />
COMPETITOR LOCATIONS<br />
NORTHEAST<br />
CORRIDOR<br />
RETAIL STUDY<br />
DMA PROFILES<br />
HARTFORD /<br />
NEW HAVEN DMA<br />
CLICK MAP FOR DRIVING TIME<br />
& DISTANCE FROM HARTFORD /<br />
NEW HAVEN DMA<br />
CUSHMAN & WAKEFIELD
DRIVE TIME & DISTANCE FROM HARTFORD / NEW HAVEN DMA<br />
DATA IS FROM SOURCES DEEMED RELIABLE BUY MAY BE SUBJECT TO ERRORS, OMISSIONS, OR<br />
MODIFICATIONS. THE INFORMATION HEREIN IS PROVIDED WITHOUT REPRESENTATION OR WARRANTY<br />
This map shows the driving time and distance<br />
from the Hartford / New Haven DMA to<br />
other DMAs in the Northeast corridor.<br />
NORTHEAST<br />
CORRIDOR<br />
RETAIL STUDY<br />
Close<br />
CUSHMAN & WAKEFIELD
HARTFORD / NEW HAVEN DMA<br />
ECONOMIC OVERVIEW<br />
• Located within the Knowledge Corridor, which<br />
runs from Metropolitan Hartford north to<br />
western Massachusetts<br />
• One of the nation’s largest financial centers<br />
• Region is a center of high technology and defense<br />
manufacturing<br />
CHARACTERISTIC HARTFORD<br />
NEW HAVEN<br />
U.S.<br />
2012 EST. CIVILIAN EMPLOYED POPULATION AGE 16+<br />
Blue Collar 18.5% 21.1%<br />
White Collar 63.9% 60.6%<br />
Service & Farm 17.6% 18.2%<br />
Total Employment 100.0% 100.0%<br />
CHARACTERISTIC HARTFORD<br />
NEW HAVEN<br />
U.S.<br />
2012 EST. CIVILIAN EMPLOYED POPULATION AGE 16+<br />
Architect/Engineer 2.3% 1.9%<br />
Arts/Entertain/Sports 2.0% 1.9%<br />
Building Grounds Maint 3.4% 3.9%<br />
Business/Financial Ops 4.7% 4.4%<br />
Community/Soc Svcs 2.1% 1.6%<br />
Computer/Mathematical 2.7% 2.4%<br />
Construction/Extraction 4.5% 5.6%<br />
Edu/Training/Library 7.0% 6.0%<br />
Farm/Fish/Forestry 0.2% 0.7%<br />
Food Prep/Serving 4.9% 5.5%<br />
Health Practitioner/Tec 6.1% 5.3%<br />
Healthcare Support 3.2% 2.4%<br />
Maintenance Repair 3.0% 3.4%<br />
Legal 1.4% 1.2%<br />
Life/Phys/Soc Science 1.2% 0.9%<br />
Management 9.6% 9.7%<br />
Office/Admin Support 14.0% 14.0%<br />
Production Occupations 6.2% 6.1%<br />
Protective Svcs 2.1% 2.2%<br />
Sales/Related 10.7% 11.2%<br />
Personal Care/Svc 3.8% 3.5%<br />
Transportation/Moving 4.7% 6.0%<br />
Total Employment 100.0% 100.0%<br />
Close
HARTFORD / NEW HAVEN DMA<br />
DEMOGRAPHIC OVERVIEW<br />
The demographic characteristics of the Hartford / New Haven DMA are profiled in the table below and include age, income and education levels.<br />
Click forward to view population concentrations and median household income.<br />
CHARACTERISTIC HARTFORD /<br />
NEW HAVEN<br />
Population (Mil) 2.6 313.0<br />
Median Age 39.4 36.7<br />
Average HH Income $78,691 $67,315<br />
Median HH Income $61,212 $49,545<br />
INCOME BREAKDOWN<br />
< $15,000 10% 13%<br />
$15,000 to $34,999 17% 22%<br />
$35,000 to $74,999 33% 35%<br />
$75,000 to $99,999 15% 12%<br />
$100,000 + 25% 18%<br />
EDUCATION<br />
< High School 4% 6%<br />
High School < Diploma 7% 8%<br />
High School Graduate 30% 29%<br />
Some College 18% 21%<br />
College Degree < Bachelor 8% 7%<br />
Bachelor Degree 18% 18%<br />
Advanced Degree 14% 10%<br />
US<br />
Population Concentrations
HARTFORD / NEW HAVEN DMA<br />
POPULATION DENSITY MAP<br />
• xxxxxxx<br />
DATA IS FROM SOURCES DEEMED RELIABLE BUY MAY BE SUBJECT TO ERRORS, OMISSIONS, OR<br />
Back to Demographic Overview Median Household Income<br />
MODIFICATIONS. THE INFORMATION HEREIN IS PROVIDED WITHOUT REPRESENTATION OR WARRANTY
HARTFORD / NEW HAVEN DMA<br />
MEDIAN HOUSEHOLD INCOME<br />
DATA IS FROM SOURCES DEEMED RELIABLE BUY MAY BE SUBJECT TO ERRORS, OMISSIONS, OR<br />
Back to Population Concentration Close<br />
MODIFICATIONS. THE INFORMATION HEREIN IS PROVIDED WITHOUT REPRESENTATION OR WARRANTY
HARTFORD / NEW HAVEN DMA<br />
RETAIL OVERVIEW<br />
This section provides key information on major retail shopping centers, high streets (if applicable) and competitive and complementary retailers.<br />
Retail Center Summary
1<br />
2<br />
HARTFORD / NEW HAVEN DMA<br />
RETAIL CENTER SUMMARY<br />
(800,000+ sqft)<br />
MALL/<br />
CENTER NAME<br />
West Farms<br />
Mall<br />
The Shoppes<br />
at Buckland<br />
Hills<br />
ADDRESS CITY STATE ZIP<br />
CODE<br />
500 Westfarms<br />
Mall<br />
194 Buckland<br />
Hills Dr<br />
Farmington CT 06032 Super<br />
Regional Mall<br />
Manchester CT 06042 Super<br />
Regional Mall<br />
RETAIL TYPE SIZE (SF) SALES<br />
(PSF)<br />
NO. OF<br />
ANCHORS<br />
NO. OF<br />
SPECIALTY<br />
STORES<br />
ANCHOR TENANTS<br />
1,289,000 TBD 5 167 JCPenney, Lord & Taylor,<br />
Macy's Men's & Home,<br />
Nordstrom<br />
898,533 TBD 4 145 Barnes & Noble, Dick's<br />
Sporting Goods, JCPenney,<br />
Macy's<br />
Back to Retail Overview<br />
Retail Center Summary Map
HARTFORD / NEW HAVEN DMA<br />
RETAIL CENTER SUMMARY MAP<br />
DATA IS FROM SOURCES DEEMED RELIABLE BUY MAY BE SUBJECT TO ERRORS, OMISSIONS, OR<br />
MODIFICATIONS. THE INFORMATION HEREIN IS PROVIDED WITHOUT REPRESENTATION OR WARRANTY<br />
Back<br />
Click on the<br />
numbered locations<br />
to see corresponding<br />
mall/shopping center<br />
summary<br />
Competitive & Complementary Retailers
HARTFORD / NEW HAVEN DMA<br />
COMPETITIVE & COMPLEMENTARY RETAILERS<br />
DATA IS FROM SOURCES DEEMED RELIABLE BUY MAY BE SUBJECT TO ERRORS, OMISSIONS, OR<br />
MODIFICATIONS. THE INFORMATION HEREIN IS PROVIDED WITHOUT REPRESENTATION OR WARRANTY<br />
Back to Retail Center Summary Close
BALTIMORE DMA<br />
DMA HIGHLIGHTS<br />
• More than 2.9 million people (27th largest DMA in the U.S.)<br />
• DMA comprises Baltimore City and 10 surrounding counties<br />
• Median Household Income is 25.7% greater than U.S. average<br />
• Relatively low cost of living<br />
• 33% of the DMA holds bachelor’s or advanced degree<br />
• Education ranks among the best in the U.S.—State of Maryland was named the #1 in<br />
US in 2012 by Education Week<br />
• Key economic center for the State of Maryland and home to numerous prominent<br />
businesses of all sizes<br />
• Well-connected to urban regions along the Northeast Corridor<br />
INTRODUCTION DMA OVERVIEW<br />
TOTAL RETAIL SALES<br />
$47.1 billion<br />
% OF 7 DMA RETAIL SALES<br />
6.1%<br />
% OF US RETAIL SALES<br />
1.0%<br />
Economic Overview Demographic Overview Retail Overview Back to Market Profiles<br />
COMPETITOR LOCATIONS<br />
BALTIMORE DMA<br />
NORTHEAST<br />
CORRIDOR<br />
RETAIL STUDY<br />
DMA PROFILES<br />
CLICK MAP FOR DRIVING TIME &<br />
DISTANCE FROM BALTIMORE DMA<br />
CUSHMAN & WAKEFIELD
DRIVE TIME & DISTANCE FROM BALTIMORE DMA<br />
DATA IS FROM SOURCES DEEMED RELIABLE BUY MAY BE SUBJECT TO ERRORS, OMISSIONS, OR<br />
MODIFICATIONS. THE INFORMATION HEREIN IS PROVIDED WITHOUT REPRESENTATION OR WARRANTY<br />
This map shows the driving time and<br />
distance from the Baltimore DMA to<br />
other DMAs in the Northeast corridor.<br />
NORTHEAST<br />
CORRIDOR<br />
RETAIL STUDY<br />
CUSHMAN & WAKEFIELD
BALTIMORE DMA<br />
ECONOMIC OVERVIEW<br />
• Area consistently outperformed the U.S. average for<br />
employment<br />
• A highly educated labor force works in diversified<br />
industries including IT, Biosciences, Health Care, Financial<br />
Services, Government Contracting, Manufacturing,<br />
Logistics and Legal Services<br />
CHARACTERISTIC BALTIMORE U.S.<br />
2012 EST. CIVILIAN EMPLOYED POPULATION AGE 16+<br />
Blue Collar 16.2% 21.1%<br />
White Collar 67.7% 60.6%<br />
Service & Farm 16.1% 18.2%<br />
Total Employment 100.0% 100.0%<br />
CHARACTERISTIC BOSTON U.S.<br />
2012 EST. CIVILIAN EMPLOYED POPULATION AGE 16+<br />
Architect/Engineer 2.4% 1.9%<br />
Arts/Entertain/Sports 1.9% 1.9%<br />
Building Grounds Maint 3.2% 3.9%<br />
Business/Financial Ops 5.4% 4.4%<br />
Community/Soc Svcs 1.8% 1.6%<br />
Computer/Mathematical 4.4% 2.4%<br />
Construction/Extraction 4.7% 5.6%<br />
Edu/Training/Library 6.1% 6.0%<br />
Farm/Fish/Forestry 0.2% 0.7%<br />
Food Prep/Serving 4.4% 5.5%<br />
Health Practitioner/Tec 6.3% 5.3%<br />
Healthcare Support 2.0% 2.4%<br />
Maintenance Repair 3.1% 3.4%<br />
Legal 1.4% 1.2%<br />
Life/Phys/Soc Science 1.3% 0.9%<br />
Management 11.4% 9.7%<br />
Office/Admin Support 14.9% 14.0%<br />
Production Occupations 3.5% 6.1%<br />
Protective Svcs 2.9% 2.2%<br />
Sales/Related 10.3% 11.2%<br />
Personal Care/Svc 3.3% 3.5%<br />
Transportation/Moving 5.0% 6.0%<br />
Total Employment 100.0% 100.0%<br />
Close
BALTIMORE DMA<br />
DEMOGRAPHIC OVERVIEW<br />
The demographic characteristics of the Baltimore DMA are profiled in the table below and include age, income and education levels.<br />
Click forward to view population concentrations and median household income.<br />
CHARACTERISTIC BALTIMORE US<br />
Population (Mil) 2.9 313.0<br />
Median Age 37.7 36.7<br />
Average HH Income $80,862 $67,315<br />
Median HH Income $62,284 $49,545<br />
INCOME BREAKDOWN<br />
< $15,000 10% 13%<br />
$15,000 to $34,999 17% 22%<br />
$35,000 to $74,999 33% 35%<br />
$75,000 to $99,999 14% 12%<br />
$100,000 + 26% 18%<br />
EDUCATION<br />
< High School 4% 6%<br />
High School < Diploma 8% 8%<br />
High School Graduate 28% 29%<br />
Some College 20% 21%<br />
College Degree < Bachelor 6% 7%<br />
Bachelor Degree 19% 18%<br />
Advanced Degree 14% 10%<br />
Population Concentrations
BALTIMORE DMA<br />
POPULATION DENSITY MAP<br />
DATA IS FROM SOURCES DEEMED RELIABLE BUY MAY BE SUBJECT TO ERRORS, OMISSIONS, OR<br />
Back to Demographic Overview Median Household Income<br />
MODIFICATIONS. THE INFORMATION HEREIN IS PROVIDED WITHOUT REPRESENTATION OR WARRANTY
BALTIMORE DMA<br />
MEDIAN HOUSEHOLD INCOME<br />
DATA IS FROM SOURCES DEEMED RELIABLE BUY MAY BE SUBJECT TO ERRORS, OMISSIONS, OR<br />
MODIFICATIONS. THE INFORMATION HEREIN IS PROVIDED WITHOUT REPRESENTATION OR WARRANTY<br />
Back to Population Concentration Close
BALTIMORE DMA<br />
RETAIL OVERVIEW<br />
This section provides key information on major retail shopping centers, high streets (if applicable) and competitive and complementary retailers.<br />
Retail Center Summary
1<br />
2<br />
3<br />
4<br />
5<br />
6<br />
7<br />
8<br />
9<br />
BALTIMORE DMA<br />
RETAIL CENTER SUMMARY<br />
(800,000+ sqft)<br />
MALL/<br />
CENTER NAME<br />
Westfield<br />
Annapolis<br />
White<br />
Marsh Mall<br />
The Mall In<br />
Columbia<br />
Security<br />
Square<br />
ADDRESS CITY STATE ZIP<br />
CODE<br />
2002 Annapolis<br />
Mall<br />
8352 Honeygo<br />
Blvd<br />
10300 Little<br />
Patuxent Pky<br />
6901 Security<br />
Blvd<br />
Arundel Mills 7000 Arundel<br />
Mills Cir<br />
Marley Station 7900 Ritchie<br />
Hwy<br />
Owings<br />
Mills Mall<br />
Towson<br />
Town Center<br />
Hunt Valley<br />
Towne Centre<br />
10300 Mill Run<br />
Cir<br />
825 Dulaney<br />
Valley Rd<br />
Annapolis MD 21401 Super<br />
Regional Mall<br />
Baltimore MD 21236 Super<br />
Regional Mall<br />
Columbia MD 21044 Super<br />
Regional Mall<br />
Woodlawn MD 21244 Super<br />
Regional Mall<br />
Hanover MD 21076 Super<br />
Regional Mall<br />
Glen<br />
Burnie<br />
Owings<br />
Mills<br />
MD 21061 Super<br />
Regional Mall<br />
MD 21117 Super<br />
Regional Mall<br />
Towson MD 21204 Super<br />
Regional Mall<br />
RETAIL TYPE SIZE (SF) SALES<br />
(PSF)<br />
2,251,953 $525 -<br />
$550<br />
NO. OF<br />
ANCHORS<br />
NO. OF<br />
SPECIALTY<br />
STORES<br />
ANCHOR TENANTS<br />
5 241 Macy's, JCPenney, Sears,<br />
Nordstrom, Lord & Taylor<br />
1,562,583 - 5 142 IKEA, Macy's, Sears, JCPenney,<br />
Sports Authority<br />
1,482,734 $675 -<br />
$700<br />
6 202 Sears, Nordstrom, Lord & Taylor,<br />
Macy's, JCPenney, L.L. Bean Outlet<br />
1,423,397 - 3 120 Sears, Macy's, Burlington Coat<br />
Factory<br />
1,293,657 $375 -<br />
$425<br />
1,266,453 $325 -<br />
$375<br />
13 170 Bass Pro Shops, Last Call,<br />
Burlington Coat Factory, Dave<br />
& Buster's, Best Buy, Bed Bath<br />
& Beyond,T.J. Maxx, Off 5th,<br />
Old Navy, Off Broadway Shoe<br />
Warehouse, Books-A-Million,<br />
Modell's<br />
3 125 Sears, Macy's, JCPenney<br />
1,138,056 - 2 148 Macy's, JCPenney<br />
1,050,000 - 4 195 Nordstrom, Macy's, H & M,<br />
Nordstrom Rack<br />
118 Shawan Rd Hunt Valley MD 21030 Power Center 853,289 - 7 47 Sears, Wegmans, Burlington Coat<br />
Factory, Dick's Sporting Goods,<br />
Brandon Home Furnishings,<br />
Greetings & Readings, Inc., DSW<br />
Back to Retil Overview<br />
Retail Center Summary Map
BALTIMORE DMA<br />
RETAIL CENTER SUMMARY MAP<br />
DATA IS FROM SOURCES DEEMED RELIABLE BUY MAY BE SUBJECT TO ERRORS, OMISSIONS, OR<br />
MODIFICATIONS. THE INFORMATION HEREIN IS PROVIDED WITHOUT REPRESENTATION OR WARRANTY<br />
Click on the<br />
numbered locations<br />
to see corresponding<br />
mall/shopping center<br />
summary<br />
Back to Retail Center Summary High Streets
BALTIMORE DMA<br />
HIGH STREETS<br />
MARKET OVERVIEW<br />
KEY AREAS / STREETS /<br />
SHOPPING CENTERS<br />
CONSUMER<br />
PROFILE<br />
Inner Harbor Tourists, local business<br />
density<br />
Harbor East Local shoppers,<br />
tourists<br />
MAJOR RETAILERS<br />
PRESENT<br />
Urban Outfitters, Jos. A Bank, Banana<br />
Republic, Forever 21<br />
Whole Foods, J. Crew, Lululemon, MAC<br />
Cosmetics, Gordon Biersch<br />
Federal Hill Local shoppers American Apparel, B’More Betty, Cottage<br />
Kidz Boutique<br />
Mount Vernon Tourists, local business<br />
density, local shoppers<br />
Fells Point & Canton Local shoppers,<br />
tourists<br />
Towson Local shoppers,<br />
tourists<br />
Bedazzled, Plaza Artist Materials , Eddie’s of<br />
Mount Vernon, Charm City Cupcakes<br />
Ten Thousand Villages, Brassworks, Sticky<br />
Rice, Ulta<br />
Macy’s, T.J. Maxx, Nordstrom Rack, Crate &<br />
Barrel, South Moon Under<br />
NEW<br />
ENTRANTS<br />
TYPICAL RENT<br />
FOR UNIT OF<br />
2,000 SQFT<br />
RANGE OF UNIT<br />
SIZES<br />
H&M $40 - $55 2,000 – 20,000 SF<br />
Under Armour $35 - $45 2,000 – 20,000 SF<br />
N/A $30 - $40 2,000 – 5,000 SF<br />
N/A $30 - $40 2,000 – 10,000 SF<br />
Target, Old Navy $30 - $40 2,000 – 50,000 SF<br />
Athleta, LVMH $40 - $60 2,000 – 50,000 SF<br />
Back to Retail Center Summary Competitive & Complementary Retailers
BALTIMORE DMA<br />
COMPETITIVE & COMPLEMENTARY RETAILERS<br />
DATA IS FROM SOURCES DEEMED RELIABLE BUY MAY BE SUBJECT TO ERRORS, OMISSIONS, OR<br />
MODIFICATIONS. THE INFORMATION HEREIN IS PROVIDED WITHOUT REPRESENTATION OR WARRANTY<br />
Back to High Streets Close
PHILADELPHIA DMA<br />
DMA HIGHLIGHTS<br />
• 8.0 million residents (4th largest DMA in U.S.)<br />
• Comprises 19 counties located in the states of Pennsylvania, Delaware, and New Jersey<br />
• Household income average is 14.4% above U.S. average<br />
• Educated workforce; 31% of population holds at least a bachelors degree, nearly 11%<br />
above national average<br />
INTRODUCTION DMA OVERVIEW<br />
TOTAL RETAIL SALES<br />
$47.1 billion<br />
% OF 7 DMA RETAIL SALES<br />
6.1%<br />
% OF US RETAIL SALES<br />
1.0%<br />
Economic Overview Demographic Overview Retail Overview Back to Market Profiles<br />
COMPETITOR LOCATIONS<br />
PHILADELPHIA DMA<br />
NORTHEAST<br />
CORRIDOR<br />
RETAIL STUDY<br />
DMA PROFILES<br />
CLICK MAP FOR DRIVING<br />
TIME & DISTANCE FROM<br />
PHILADELPHIA DMA<br />
CUSHMAN & WAKEFIELD
DRIVE TIME & DISTANCE FROM PHILADELPHIA DMA<br />
DATA IS FROM SOURCES DEEMED RELIABLE BUY MAY BE SUBJECT TO ERRORS, OMISSIONS, OR<br />
MODIFICATIONS. THE INFORMATION HEREIN IS PROVIDED WITHOUT REPRESENTATION OR WARRANTY<br />
This map shows the driving time and<br />
distance from the Philadelphia DMA to<br />
other DMAs in the Northeast corridor.<br />
NORTHEAST<br />
CORRIDOR<br />
RETAIL STUDY<br />
Close<br />
CUSHMAN & WAKEFIELD
PHILADELPHIA DMA<br />
ECONOMIC OVERVIEW<br />
• Once highly dependent on manufacturing, the<br />
region has developed a more diverse economy<br />
geared toward information and service-based<br />
businesses<br />
• Healthcare and education are among the most<br />
prominent industry sectors<br />
CHARACTERISTIC PHILADELPHIA U.S.<br />
2012 EST. CIVILIAN EMPLOYED POPULATION AGE 16+<br />
Blue Collar 18.2% 21.1%<br />
White Collar 64.6% 60.6%<br />
Service & Farm 17.3% 18.2%<br />
Total Employment 100.0% 100.0%<br />
CHARACTERISTIC PHILADELPHIA U.S.<br />
2012 EST. CIVILIAN EMPLOYED POPULATION AGE 16+<br />
Architect/Engineer 1.8% 1.9%<br />
Arts/Entertain/Sports 1.7% 1.9%<br />
Building Grounds Maint 3.4% 3.9%<br />
Business/Financial Ops 5.0% 4.4%<br />
Community/Soc Svcs 2.0% 1.6%<br />
Computer/Mathematical 2.7% 2.4%<br />
Construction/Extraction 4.4% 5.6%<br />
Edu/Training/Library 6.5% 6.0%<br />
Farm/Fish/Forestry 0.3% 0.7%<br />
Food Prep/Serving 5.3% 5.5%<br />
Health Practitioner/Tec 6.3% 5.3%<br />
Healthcare Support 2.4% 2.4%<br />
Maintenance Repair 3.0% 3.4%<br />
Legal 1.5% 1.2%<br />
Life/Phys/Soc Science 1.4% 0.9%<br />
Management 10.0% 9.7%<br />
Office/Admin Support 14.9% 14.0%<br />
Production Occupations 5.0% 6.1%<br />
Protective Svcs 2.4% 2.2%<br />
Sales/Related 10.8% 11.2%<br />
Personal Care/Svc 3.4% 3.5%<br />
Transportation/Moving 5.8% 6.0%<br />
Total Employment 100.0% 100.0%<br />
Close
PHILADELPHIA DMA<br />
DEMOGRAPHIC OVERVIEW<br />
The demographic characteristics of the Philadelphia DMA are profiled in the table below and include age, income and education levels.<br />
Click forward to view population concentrations and median household income.<br />
CHARACTERISTIC PHILADELPHIA US<br />
Population (Mil) 8.0 313.0<br />
Median Age 38.0 36.7<br />
Average HH Income $75,305 $67,315<br />
Median HH Income $56,587 $49,545<br />
INCOME BREAKDOWN<br />
< $15,000 12% 13%<br />
$15,000 to $34,999 19% 22%<br />
$35,000 to $74,999 33% 35%<br />
$75,000 to $99,999 13% 12%<br />
$100,000 + 23% 18%<br />
EDUCATION<br />
< High School 4% 6%<br />
High School < Diploma 9% 8%<br />
High School Graduate 32% 29%<br />
Some College 18% 21%<br />
College Degree < Bachelor 7% 7%<br />
Bachelor Degree 19% 18%<br />
Advanced Degree 12% 10%<br />
Population Concentrations
PHILADELPHIA DMA<br />
POPULATION DENSITY MAP<br />
DATA IS FROM SOURCES DEEMED RELIABLE BUY MAY BE SUBJECT TO ERRORS, OMISSIONS, OR<br />
MODIFICATIONS. THE INFORMATION HEREIN IS PROVIDED WITHOUT REPRESENTATION OR WARRANTY<br />
Back to Demographic Overview<br />
Median Household Income
PHILADELPHIA DMA<br />
MEDIAN HOUSEHOLD INCOME<br />
TO COME<br />
DATA IS FROM SOURCES DEEMED RELIABLE BUY MAY BE SUBJECT TO ERRORS, OMISSIONS, OR<br />
Back to Population Concentration Close<br />
MODIFICATIONS. THE INFORMATION HEREIN IS PROVIDED WITHOUT REPRESENTATION OR WARRANTY
PHILADELPHIA DMA<br />
RETAIL OVERVIEW<br />
This section provides key information on major retail shopping centers, high streets (if applicable) and competitive and complementary retailers.<br />
Retail Center Summary
1<br />
2<br />
3<br />
4<br />
5<br />
6<br />
7<br />
8<br />
PHILADELPHIA DMA<br />
RETAIL CENTER SUMMARY<br />
800,000+ sq ft<br />
MALL/<br />
CENTER NAME<br />
King of Prussia<br />
Mall<br />
ADDRESS CITY STATE ZIP<br />
CODE<br />
160 North<br />
Gulph Road<br />
Franklin Mills 1455 Franklin<br />
Mills Circle<br />
Park City<br />
Center<br />
142 Park City<br />
Center<br />
King of<br />
Prussia<br />
RETAIL<br />
TYPE<br />
PA 19406 Super<br />
Regional<br />
Mall<br />
Philadelphia PA 19154 Super<br />
Regional<br />
Mall<br />
Lancaster PA 17601 Regional<br />
Mall<br />
Cherry Hill Mall 2000 Route 38 Cherry Hill NJ 08002 Super<br />
Regional<br />
Mall<br />
The Metroplex<br />
Shopping<br />
Center<br />
2200-2290<br />
Chemical Road<br />
The Gallery 901-1001<br />
Market Street<br />
Lehigh Valley Mall 250 Lehigh<br />
Valley Mall<br />
Oxford Valley Mall 2300 East<br />
Lincoln<br />
Highway<br />
Go to Map<br />
Plymouth<br />
Meeting<br />
PA 19462 Super<br />
Regional<br />
Mall<br />
Philadelphia PA 19107 Super<br />
Regional<br />
Mall<br />
Whitehall PA 18052 Super<br />
Regional<br />
Mall<br />
Langhorne PA 19047 Super<br />
Regional<br />
Mall<br />
SIZE (SF) SALES<br />
(PSF)<br />
NO. OF<br />
ANCHORS<br />
NO. OF<br />
SPECIALTY<br />
STORES<br />
ANCHOR TENANTS<br />
3,318,876 $600+ 6 368 Bloomingdale’s, Nordstrom, JC<br />
Penney, Neiman Marcus, Lord &<br />
Taylor, Sears<br />
1,743,212 - 8 185 Bed Bath & Beyond, Burlington<br />
Coat Factory, JC Penney,<br />
Marshalls, Dave & Buster’s,<br />
Modell’s Sporting Goods, Off<br />
Broadway Shoe Warehouse, H&M<br />
1,551,981 - 5 170 Kohl’s, JCPenney, Boscov’s, Sears,<br />
Bon-Ton<br />
1,500,511 $550 -<br />
$600<br />
4 172 Nordstrom, Macy's, Hollister Co.,<br />
JCPenney<br />
1,373,387 - 4 - Lowe's, Target, American<br />
Signature Furniture, GIANT Food<br />
Stores of Carlisle<br />
1,366,968 - 2 - Kmart, Burlington Coat Factory<br />
1,335,716 - 3 138 Boscov's, Macy's, JCPenney<br />
1,318,891 $300 -<br />
$350<br />
3 144 JCPenney, Macy’s, Sears<br />
Back to Retail Overview<br />
Next
9<br />
10<br />
11<br />
12<br />
13<br />
14<br />
15<br />
16<br />
17<br />
18<br />
19<br />
PHILADELPHIA DMA<br />
RETAIL CENTER SUMMARY<br />
800,000+ sq ft<br />
MALL/<br />
CENTER<br />
NAME<br />
Cumberland<br />
Mall<br />
ADDRESS CITY STATE ZIP<br />
CODE<br />
1 Cumberland<br />
Mall<br />
Deptford Mall 1750 Deptford<br />
Center Road<br />
Willow Grove<br />
Park<br />
Montgomery<br />
Mall<br />
Plymouth<br />
Meeting Mall<br />
Exton Square<br />
Mall<br />
2400-2500 West<br />
Moreland Road<br />
230<br />
Montgomery<br />
Mall<br />
1150 Plymouth<br />
Meeting Mall<br />
260 Exton<br />
Square Parkway<br />
Christiana Mall 100-808<br />
Christiana Mall<br />
Moorestown<br />
Mall<br />
Neshaminy<br />
Mall<br />
Vineland NJ 08360 Super<br />
Regional Mall<br />
Deptford NJ 08096 Super Regional<br />
Mall<br />
Willow Grove PA 19090 Super Regional<br />
Mall<br />
Montgomeryville PA 18936 Super Regional<br />
Mall<br />
Plymouth<br />
Meeting<br />
PA 19462 Super Regional<br />
Mall<br />
Exton PA 19341 Super Regional<br />
Mall<br />
Newark DE 19702 Super Regional<br />
Mall<br />
400 Route 38 Moorestown NJ 08057 Super Regional<br />
Mall<br />
3900 Rockhill<br />
Boulevard<br />
Hamilton Mall 4403-4411 Black<br />
Horse Pike<br />
Concord Mall 4727-4747<br />
Concord Pike<br />
Go to Map<br />
Bensalem PA 19020 Super Regional<br />
Mall<br />
Mays Landing NJ 08330 Super Regional<br />
Mall<br />
Wilmington DE 19803 Super Regional<br />
Mall<br />
RETAIL TYPE SIZE (SF) SALES<br />
(PSF)<br />
NO. OF<br />
ANCHORS<br />
NO. OF<br />
SPECIALTY<br />
STORES<br />
ANCHOR TENANTS<br />
1,269,577 $308 5 80 Home Depot, BJ’s Wholesale<br />
Club, Boscov’s, Burlington<br />
Coat Factory, Toys”R”Us<br />
1,240,126 $475 -<br />
$500<br />
1,221,529 $375 -<br />
$425<br />
4 144 Macy's, Boscov's, Sears,<br />
JCPenney<br />
3 108 Sears, Bloomingdale's, Macy's<br />
1,185,926 - 3 143 Macy's, Sears, JCPenney<br />
1,116,828 $315 -<br />
$350<br />
2 92 Macy's, Boscov's<br />
1,098,748 $320 4 138 Boscov's, Macy's, JCPenney,<br />
Sears<br />
1,083,027 - 2 130 Macy's, JCPenney<br />
1,059,000 $350 -<br />
$400<br />
1,022,007 $325 -<br />
$350<br />
1 100 Macy's<br />
4 120 Boscov's, Sears, AMC<br />
Theatres, Barnes & Noble<br />
988,052 - 3 139 JCPenney, Macy's, Sears<br />
952,373 $405 2 89 Sears, Boscov's<br />
Back<br />
Next
20<br />
21<br />
22<br />
23<br />
24<br />
PHILADELPHIA DMA<br />
RETAIL CENTER SUMMARY<br />
800,000+ sq ft<br />
MALL/<br />
CENTER<br />
NAME<br />
Granite Run<br />
Mall<br />
Burlington<br />
Center Mall<br />
Brandywine<br />
Town Center<br />
Voorhees<br />
Town Center<br />
Wrangleboro<br />
Consumer<br />
Square<br />
ADDRESS CITY STATE ZIP<br />
CODE<br />
1067 West<br />
Baltimore Pike<br />
2501 Mt. Holly<br />
Rd<br />
5190<br />
Brandywine<br />
Parkway<br />
1285 Echelon<br />
Mall<br />
200-2300<br />
Wrangleboro<br />
Road<br />
Media PA 19063 Super Regional<br />
Mall<br />
RETAIL TYPE SIZE (SF) SALES<br />
(PSF)<br />
NO. OF<br />
ANCHORS<br />
NO. OF<br />
SPECIALTY<br />
STORES<br />
ANCHOR TENANTS<br />
949,264 - 4 122 Sears, Boscov’s, JC Penney, Acme<br />
Market<br />
Burlington NJ 08016 Regional Mall 915,559 - 2 120 Sears, JCPenney<br />
Wilmington DE 19803 Regional Mall 893,571 $310 7 - Target, Regal Cinemas, Access<br />
Group, Inc., Dick's Sporting<br />
Goods, Bed Bath & Beyond,<br />
TransUnion Settlement<br />
Solutions, hhgregg<br />
Voorhees NJ 08043 Regional Mall 842,000 $225 -<br />
$300<br />
Mays<br />
Landing<br />
2 65 Boscov's, Macy's<br />
NJ 08330 Regional Mall 841,700 - 8 58 Target, Kohl's, Dick's Sporting<br />
Goods, Best Buy, Babies "R" Us,<br />
Michaels, PetSmart, Staples<br />
Back<br />
Retail Center Summary Map
PHILADELPHIA DMA<br />
RETAIL CENTER SUMMARY MAP<br />
DATA IS FROM SOURCES DEEMED RELIABLE BUY MAY BE SUBJECT TO ERRORS, OMISSIONS, OR<br />
MODIFICATIONS. THE INFORMATION HEREIN IS PROVIDED WITHOUT REPRESENTATION OR WARRANTY<br />
Click on the<br />
numbered locations<br />
to see corresponding<br />
mall/shopping center<br />
summary<br />
Back to Retail Center Summary High Streets
PHILADELPHIA DMA<br />
HIGH STREETS<br />
MARKET OVERVIEW<br />
KEY AREAS / STREETS /<br />
SHOPPING CENTERS<br />
CONSUMER<br />
PROFILE<br />
Walnut Street Luxury, high-end<br />
fashion, tourists<br />
Chestnut Street Local, tourists, CBD<br />
employees<br />
MAJOR RETAILERS<br />
PRESENT<br />
Brooks Brothers, Club Monaco, Urban<br />
Outfitters, Burberry, Coach, American<br />
Apparel<br />
Boyds, Sephora, Foot Locker, Express, J.<br />
Crew<br />
Market Street CBD employees, local Old Navy, Burlington Coat Factory, Big<br />
Kmart, Walgreen’s<br />
South Street Local, hip, trendsetters Adidas, Whole Foods, Dr. Denim, EModa,<br />
Whole Foods<br />
West Philadelphia/University City Tourists, students,<br />
healthcare workers<br />
Old City Local, tourists Sugarcube, Mr. Bar Stool, Jonathan Adler,<br />
Scarlett Alley<br />
NEW<br />
ENTRANTS<br />
Ulta, Intermix,<br />
Lush, Dr.<br />
Martens, Jack<br />
Willis, Swarovski<br />
Hope Chest,<br />
Kembrel, Blink,<br />
Laila Rowe<br />
TYPICAL RENT<br />
FOR UNIT OF<br />
2,000 SQFT<br />
RANGE OF UNIT<br />
SIZES<br />
$85-$120 2,000-4,000<br />
$40-$80 2,000-4,000<br />
Marshall’s $30-$60 2,000-10,000<br />
The Lite<br />
Choice, Serpico,<br />
Redwood<br />
$20-$60 2,000-4,000<br />
Eastern Mountain Sports, Penn Brookstone, Doc Magrogan’s $30-$75 2,000-4,000<br />
Retail Center Summary<br />
Craft & Claw,<br />
Fire & Ice<br />
$30-$60 2,000-4,000<br />
Competitive & Complementary Retailers
PHILADELPHIA DMA<br />
COMPETITIVE & COMPLEMENTARY RETAILERS<br />
DATA IS FROM SOURCES DEEMED RELIABLE BUY MAY BE SUBJECT TO ERRORS, OMISSIONS, OR<br />
MODIFICATIONS. THE INFORMATION HEREIN IS PROVIDED WITHOUT REPRESENTATION OR WARRANTY<br />
Back to High Streets Close
NEW YORK DMA<br />
DMA HIGHLIGHTS<br />
• 21 million residents (Largest DMA in the U.S.)<br />
• Comprises New York City as well as 24 outlying counties throughout the states<br />
of New York, New Jersey, Pennsylvania, and Connecticut<br />
• Median household income of $61,423, which is 24% above U.S. average<br />
• A strong, diverse, well-educated labor force (more 36% of residents have at least<br />
a bachelor’s degree)<br />
INTRODUCTION DMA OVERVIEW<br />
TOTAL RETAIL SALES<br />
$314.9 billion<br />
% OF 7 DMA RETAIL SALES<br />
40.7%<br />
% OF US RETAIL SALES<br />
6.9%<br />
Economic Overview Demographic Overview Retail Overview Back to Market Profiles<br />
COMPETITOR LOCATIONS<br />
NORTHEAST<br />
CORRIDOR<br />
RETAIL STUDY<br />
DMA PROFILES<br />
NEW YORK DMA<br />
CLICK MAP FOR DRIVING<br />
TIME & DISTANCE FROM<br />
NEW YORK DMA<br />
CUSHMAN & WAKEFIELD
DRIVE TIME & DISTANCE FROM NEW YORK DMA<br />
DATA IS FROM SOURCES DEEMED RELIABLE BUY MAY BE SUBJECT TO ERRORS, OMISSIONS, OR<br />
MODIFICATIONS. THE INFORMATION HEREIN IS PROVIDED WITHOUT REPRESENTATION OR WARRANTY<br />
This map shows the driving time and<br />
distance from the New York DMA to<br />
other DMAs in the Northeast corridor.<br />
NORTHEAST<br />
CORRIDOR<br />
RETAIL STUDY<br />
Close<br />
CUSHMAN & WAKEFIELD
NEW YORK DMA<br />
ECONOMIC OVERVIEW<br />
• A diverse residential and employment base<br />
coupled with a strong tourism industry helps<br />
create a critical mass of consumers<br />
• A global financial center home to multiple global<br />
corporate headquarters<br />
• Highly diversified economy featuring traditional<br />
and new media (“Silicon Alley”), technology,<br />
entertainment, telecommunications, trade, and<br />
tourism<br />
CHARACTERISTIC NEW YORK U.S.<br />
2012 EST. CIVILIAN EMPLOYED POPULATION AGE 16+<br />
Blue Collar 16.4% 21.1%<br />
White Collar 65.3% 60.6%<br />
Service & Farm 18.3% 18.2%<br />
Total Employment 100.0% 100.0%<br />
CHARACTERISTIC NEW YORK U.S.<br />
2012 EST. CIVILIAN EMPLOYED POPULATION AGE 16+<br />
Architect/Engineer 1.3% 1.9%<br />
Arts/Entertain/Sports 3.1% 1.9%<br />
Building Grounds Maint 4.0% 3.9%<br />
Business/Financial Ops 5.5% 4.4%<br />
Community/Soc Svcs 1.8% 1.6%<br />
Computer/Mathematical 2.8% 2.4%<br />
Construction/Extraction 4.9% 5.6%<br />
Edu/Training/Library 6.8% 6.0%<br />
Farm/Fish/Forestry 0.1% 0.7%<br />
Food Prep/Serving 4.6% 5.5%<br />
Health Practitioner/Tec 5.3% 5.3%<br />
Healthcare Support 3.0% 2.4%<br />
Maintenance Repair 2.6% 3.4%<br />
Legal 1.9% 1.2%<br />
Life/Phys/Soc Science 1.0% 0.9%<br />
Management 10.3% 9.7%<br />
Office/Admin Support 14.0% 14.0%<br />
Production Occupations 3.6% 6.1%<br />
Protective Svcs 2.8% 2.2%<br />
Sales/Related 11.5% 11.2%<br />
Personal Care/Svc 3.8% 3.5%<br />
Transportation/Moving 5.4% 6.0%<br />
Total Employment 100.0% 100.0%<br />
Close
NEW YORK DMA<br />
DEMOGRAPHIC OVERVIEW<br />
The demographic characteristics of the New York DMA are profiled in the table below and include age, income and education levels.<br />
Click forward to view population concentrations and median household income.<br />
CHARACTERISTIC NEW YORK US<br />
Population (Mil) 20.9 313.0<br />
Median Age 37.8 36.7<br />
Average HH Income $86,976 $67,315<br />
Median HH Income $61,423 $49,545<br />
INCOME BREAKDOWN<br />
< $15,000 13% 13%<br />
$15,000 to $34,999 17% 22%<br />
$35,000 to $74,999 29% 35%<br />
$75,000 to $99,999 13% 12%<br />
$100,000 + 29% 18%<br />
EDUCATION<br />
< High School 8% 6%<br />
High School < Diploma 8% 8%<br />
High School Graduate 27% 29%<br />
Some College 16% 21%<br />
College Degree < Bachelor 7% 7%<br />
Bachelor Degree 21% 18%<br />
Advanced Degree 15% 10%<br />
Population Concentrations
NEW YORK DMA<br />
POPULATION DENSITY MAP<br />
• xxxxxxx<br />
DATA IS FROM SOURCES DEEMED RELIABLE BUY MAY BE SUBJECT TO ERRORS, OMISSIONS, OR<br />
Back to Demographic Overview Median Household Income<br />
MODIFICATIONS. THE INFORMATION HEREIN IS PROVIDED WITHOUT REPRESENTATION OR WARRANTY
NEW YORK DMA<br />
MEDIAN HOUSEHOLD INCOME<br />
DATA IS FROM SOURCES DEEMED RELIABLE BUY MAY BE SUBJECT TO ERRORS, OMISSIONS, OR<br />
Back to Population Concentration Close<br />
MODIFICATIONS. THE INFORMATION HEREIN IS PROVIDED WITHOUT REPRESENTATION OR WARRANTY
NEW YORK DMA<br />
RETAIL OVERVIEW<br />
This section provides key information on major retail shopping centers, high streets (if applicable) and competitive and complementary retailers.<br />
Retail Center Summary
1<br />
2<br />
3<br />
4<br />
5<br />
6<br />
7<br />
8<br />
9<br />
NEW YORK DMA<br />
RETAIL CENTER SUMMARY<br />
(800,000+ sqft)<br />
MALL/<br />
CENTER NAME<br />
American<br />
Dream at<br />
Meadowlands<br />
Palisades<br />
Center<br />
Roosevelt<br />
Field<br />
ADDRESS CITY STATE ZIP<br />
CODE<br />
Route 120/<br />
Route 3<br />
1000 Palisades<br />
Ctr. Dr.<br />
630 Old<br />
Country Rd.<br />
Green Acres 1150 Green<br />
Acres Mall<br />
Westfield<br />
Garden State<br />
Plaza<br />
Monmouth<br />
Mall<br />
Woodbridge<br />
Center<br />
Freehold<br />
Raceway<br />
Newport<br />
Centre<br />
1 Garden St.<br />
Plaza<br />
180A State Rt.<br />
35S<br />
250<br />
Woodbridge<br />
Ctr. Dr.<br />
E. Rutherford NJ 07072 Super<br />
Regional Mall<br />
W. Nyack NY 10994 Super<br />
Regional Mall<br />
Garden City NY 11530 Super<br />
Regional Mall<br />
Valley Stream NY 11581 Super<br />
Regional Mall<br />
Paramus NJ 07652 Super<br />
Regional Mall<br />
Eatontown NJ 07724 Super<br />
Regional Mall<br />
Woodbridge NJ 07095 Super<br />
Regional Mall<br />
Rt 33/Rt.9 Freehold NJ 07728 Super<br />
Regional Mall<br />
30 Mall Dr.<br />
West<br />
Jersey City NJ 07302 Super<br />
Regional Mall<br />
RETAIL TYPE SIZE (SF) SALES<br />
(PSF)<br />
NO. OF<br />
ANCHORS<br />
NO. OF<br />
SPECIALTY<br />
STORES<br />
ANCHOR TENANTS<br />
3,000,000 - n/a - Opening Fall 2013<br />
2,262,574 $500-$550 12 255 Macy’s JC Penney, Home<br />
Depot, Target, BJ’s<br />
2,210,416 $875-$925 6 256 Macy’s, Bloomingdales, JC<br />
Penney, Dick’s, Nordstrom’s<br />
2,155,194 $503 6 160 Macy’s, Sears, JC Penney,<br />
Best Buy<br />
2,132,112 $702 6 295 JC Penney, Macy’s Neiman<br />
Marcus<br />
1,960,670 $400 5 137 Lord & Taylor, Macy’s,<br />
Neiman Marcus<br />
1,802,265 $300-$350 5 200 JC Penney, Sears, Macy’s,<br />
Lord & Taylor<br />
1,665,399 - 7 215 Sears, Macy's, Dick's, Lord<br />
& Taylor, Nordstrom’s, JC<br />
Penney, Bob's Stores<br />
1,602,118 $500-$600 5 151 Macy's, Sears, JC Penney,<br />
Kohl's, Sear's<br />
Go to Map Back to Retail Overview Next
10<br />
11<br />
12<br />
13<br />
14<br />
15<br />
16<br />
17<br />
18<br />
NEW YORK DMA<br />
RETAIL CENTER SUMMARY<br />
(800,000+ sqft)<br />
MALL/<br />
CENTER NAME<br />
Willowbrook<br />
Mall<br />
Smith Haven<br />
Mall<br />
Staten Island<br />
Mall<br />
Danbury Fair<br />
Mall<br />
Mall At Short<br />
Hills<br />
ADDRESS CITY STATE ZIP<br />
CODE<br />
1400<br />
Willowbrook<br />
Mall<br />
313 Smith<br />
Haven Mall<br />
2655<br />
Richmond Ave.<br />
Wayne NJ 07470 Super<br />
Regional Mall<br />
Lake Grove NY 11755 Super<br />
Regional Mall<br />
Staten Island NY 10314 Super<br />
Regional Mall<br />
7 Backus Ave Danbury CT 06810 Super<br />
Regional Mall<br />
1200 Morris<br />
Tpke<br />
Menlo Park Mall 100-402 Menlo<br />
Park<br />
Westchester’s<br />
Ridge Hill<br />
1 Ridge Hill<br />
Rd.<br />
Jersey Gardens 651 Kapkowski<br />
Rd.<br />
Watchung<br />
Square Mall<br />
1515 US<br />
Highway 22<br />
Short Hills NJ 07078 Super<br />
Regional Mall<br />
Edison NJ 08837 Super<br />
Regional Mall<br />
Yonkers NY 10710 Super<br />
Regional Mall<br />
Elizabeth NJ 07201 Super<br />
Regional Mall<br />
Watchung NJ 07069 Super<br />
Regional Mall<br />
RETAIL TYPE SIZE (SF) SALES<br />
(PSF)<br />
NO. OF<br />
ANCHORS<br />
NO. OF<br />
SPECIALTY<br />
STORES<br />
ANCHOR TENANTS<br />
1,518,873 $660 3 3 Sears, Bloomingdale's,<br />
Lord & Taylor<br />
1,420,159 $650-$700 5 5 Macy's, Sears, JC Penney<br />
1,376,603 $475-$525 3 3 Sears ,JC Penney, Macy's<br />
1,372,382 $586 5 5 Sears, Macy's, JC Penney,<br />
Lord & Taylor, Dick’s<br />
1,342,000 $990 5 5 Macy's, Bloomingdale's,<br />
Nordstrom, Neiman<br />
Marcus, Saks Fifth Avenue<br />
1,315,071 $325-$375 2 2 Macy's, Nordstrom’s<br />
1,300,000 - 3 3 Dick's ,Whole Foods, T.J.<br />
Maxx<br />
1,290,911 $506 8 8 Burlington Coat Factory,<br />
Cohoes Fashions, H & M,<br />
Bed Bath & Beyond, Off<br />
5th,Last Call, Marshalls,<br />
Old Navy<br />
1,270,048 - 13 13 Home Depot, Target, Stop<br />
& Shop, Walmart, Bed<br />
Bath & Beyond<br />
Go to Map Back Next
19<br />
20<br />
21<br />
22<br />
23<br />
24<br />
25<br />
26<br />
27<br />
28<br />
NEW YORK DMA<br />
RETAIL CENTER SUMMARY<br />
(800,000+ sqft)<br />
MALL/<br />
CENTER NAME<br />
Rockaway<br />
TownSquare<br />
Westfield<br />
Sunrise<br />
Bridgewater<br />
Commons<br />
Galleria At<br />
Crystal Run<br />
ADDRESS CITY STATE ZIP<br />
CODE<br />
301 Mount<br />
Hope Ave.<br />
Rockaway NJ 07866 Super<br />
Regional Mall<br />
1 Sunrise Mall Massapequa NY 11758 Super<br />
Regional Mall<br />
400 Commons<br />
Way<br />
1 N. Galleria<br />
Dr.<br />
Kings Plaza 5100 Kings<br />
Plaza<br />
Poughkeepsie<br />
Galleria<br />
1941-2001<br />
South Rd.<br />
Broadway Mall 358 Broadway<br />
Mall<br />
Westfield<br />
Trumbull<br />
Westfield South<br />
Shore<br />
Stamford Town<br />
Center<br />
Bridgewater NJ 08807 Super<br />
Regional Mall<br />
Middletown NY 10941 Super<br />
Regional Mall<br />
Brooklyn NY 11234 Super<br />
Regional Mall<br />
Poughkeepsie NY 12601 Super<br />
Regional Mall<br />
Hicksville NY 11801 Super<br />
Regional Mall<br />
5065 Main St. Trumbull CT 06611 Super<br />
Regional Mall<br />
1701-25<br />
Sunrise Hwy<br />
100 Greyrock<br />
Pl.<br />
Bay Shore NY 11706 Super<br />
Regional Mall<br />
Stamford CT 06901 Super<br />
Regional Mall<br />
RETAIL TYPE SIZE (SF) SALES<br />
(PSF)<br />
NO. OF<br />
ANCHORS<br />
NO. OF<br />
SPECIALTY<br />
STORES<br />
ANCHOR TENANTS<br />
1,243,346 $350-$400 4 163 Sears, Macy's, JC Penney,<br />
Lord & Taylor<br />
1,213,909 $331 4 166 Macy's ,JC Penney, Sears,<br />
Walmart<br />
1,211,255 $675-$725 4 175 Macy's, Bloomingdale's,<br />
Lord & Taylor, Crate &<br />
Barrel<br />
1,200,000 $350-$400 7 132 Macy's, Sears ,JC Penney,<br />
Target, Dick's , F.Y.E. For<br />
Your Entertainment, H&M<br />
1,198,352 $640 4 128 M.A.C, Sears, Old Navy,<br />
Modell's Sporting Goods<br />
1,195,842 $350-$400 10 137 Dick's, Macy's, JC Penney,<br />
Lowe's, Sears, Target, Best<br />
Buy, H&M, DSW, Old Navy<br />
1,164,098 $380 3 106 Macy's, IKEA, Target<br />
1,152,771 $385 4 179 Macy's ,JC Penney, Target,<br />
Lord & Taylor<br />
1,127,597 $325-$375 3 252 Sears, JC Penney, Lord &<br />
Taylor<br />
1,075000 $375-$425 3 120 Macy's, Saks Fifth Avenue<br />
Go to Map Back Next
29<br />
30<br />
31<br />
32<br />
33<br />
34<br />
35<br />
36<br />
37<br />
NEW YORK DMA<br />
RETAIL CENTER SUMMARY<br />
(800,000+ sqft)<br />
MALL/<br />
CENTER NAME<br />
Walt Whitman<br />
Shops<br />
Bay Plaza Power<br />
Center<br />
Bergen Town<br />
Center<br />
ADDRESS CITY STATE ZIP<br />
CODE<br />
150-300 Walt<br />
Whitman Rd.<br />
2090-2210<br />
Bartow Ave<br />
2701 Bergen<br />
Town Center<br />
Livingston Mall 112<br />
Eisenhower<br />
Pkwy<br />
Seaview Square<br />
Mall<br />
2301-11 Route<br />
66<br />
Queens Center 90-15 Queens<br />
Blvd.<br />
Rego Park<br />
Center<br />
Cross County<br />
Shopping Ctr.<br />
Ocean County<br />
Mall<br />
96-05 Queens<br />
Blvd.<br />
Huntington NY 11746 Super<br />
Regional Mall<br />
RETAIL TYPE SIZE (SF) SALES<br />
(PSF)<br />
NO. OF<br />
ANCHORS<br />
NO. OF<br />
SPECIALTY<br />
STORES<br />
ANCHOR TENANTS<br />
1,072,480 $725 5 96 Macy's, Bloomingdale's<br />
,Lord & Taylor, Saks Fifth<br />
Avenue ,Best Buy<br />
Bronx NY 10475 Airport Mall 1,053,922 $602 7 65 Kmart, Pathmark, JC<br />
Penney, Marshalls, Raymour<br />
& Flanigan Toys"R"Us, P.C.<br />
Richard & Son<br />
Paramus NJ 07653 Super<br />
Regional Mall<br />
Livingston NJ 07039 Super<br />
Regional Mall<br />
Ocean NJ 07712 Super<br />
Regional Mall<br />
Elmhurst NY 11373 Super<br />
Regional Mall<br />
Rego Park NY 11374 Power<br />
Center<br />
6K Mall Walk Yonkers NY 10704 Super<br />
Regional Mall<br />
1201 Hooper<br />
Avenue<br />
Toms River NJ 08753 Super<br />
Regional Mall<br />
1,002,631 $350-$450 5 80 Century 21 Department<br />
Store, Target, Marshalls, Off<br />
5th,Whole Foods<br />
979,000 $275-$350 4 109 Sears, Macy's, Lord & Taylor,<br />
Barnes & Noble<br />
972,938 - 2 28 Target, Costco<br />
967,840 $950-<br />
$1,050<br />
2 180 Macy's ,JC Penney<br />
950,000 - 3 34 Sears, Kohl's ,Marshalls<br />
927,476 $575-$625 5 110 Macy's, Stop & Shop, Sears,<br />
Multiplex Cinemas, Bank of<br />
America<br />
890,845 - 3 106 Macy's, JC Penney, Sears<br />
Go to Map Back Next
38<br />
39<br />
40<br />
41<br />
42<br />
43<br />
44<br />
NEW YORK DMA<br />
RETAIL CENTER SUMMARY<br />
(800,000+ sqft)<br />
MALL/<br />
CENTER NAME<br />
Galleria at<br />
White Plains<br />
Princeton<br />
Forrestal Village<br />
Woodbury<br />
Common<br />
Outlets<br />
The<br />
Westchester<br />
Cortlandt Town<br />
Center<br />
Harriman<br />
Commons<br />
ADDRESS CITY STATE ZIP<br />
CODE<br />
100 Main<br />
Street<br />
100-201 Village<br />
Blvd.<br />
498 Red Apple<br />
Ct.<br />
125<br />
Westchester<br />
Ave.<br />
3039-3155 E.<br />
Main St.<br />
215-340 Larkin<br />
Dr.<br />
Orange Plaza 444 Rt. 211<br />
East<br />
White Plains NY 10601 Super<br />
Regional Mall<br />
Princeton NJ 08540 Super<br />
Regional Mall<br />
RETAIL TYPE SIZE (SF) SALES<br />
(PSF)<br />
NO. OF<br />
ANCHORS<br />
NO. OF<br />
SPECIALTY<br />
STORES<br />
ANCHOR TENANTS<br />
878,153 $350-$400 3 115 Macys, Sears, H & M<br />
851,081 - 1 41 Bon Worth<br />
Central Valley NY 10917 Regional Mall 844,246 $800+ 4 220 Last Call, Banana Republic,<br />
Off 5th, Adidas<br />
White Plains NY 10601 Super<br />
Regional Mall<br />
Mohegan<br />
Lake<br />
827,662 $680 3 149 Neiman Marcus,<br />
Nordstrom, Crate & Barrel<br />
NY 10547 Regional Mall 817,474 - 10 51 Home Depot, Walmart,<br />
A&P, Best Buy, Bed Bath<br />
& Beyond, Regal Cinemas,<br />
Marshalls, PetSmart,<br />
OfficeMax, Dressbarn<br />
Monroe NY 10950 Regional Mall 816,625 - 6 45 Walmart, Target, Home<br />
Depot, BJ's Wholesale Club,<br />
Best Buy, T.J. Maxx<br />
Middletown NY 10940 Regional Mall 814,062 - 7 42 Kohl's, Walmart, Home<br />
Depot, Burlington Coat<br />
Factory, Marshalls, Bed<br />
Bath & Beyond, Modell's<br />
Sporting Goods<br />
Back<br />
Retail Center Summary Map
NEW YORK DMA<br />
RETAIL CENTER SUMMARY MAP<br />
DATA IS FROM SOURCES DEEMED RELIABLE BUY MAY BE SUBJECT TO ERRORS, OMISSIONS, OR<br />
MODIFICATIONS. THE INFORMATION HEREIN IS PROVIDED WITHOUT REPRESENTATION OR WARRANTY<br />
Click on the<br />
numbered locations<br />
to see corresponding<br />
mall/shopping center<br />
summary<br />
Back to Retail Center Summary<br />
High Streets
NEW YORK DMA<br />
HIGH STREETS<br />
MARKET OVERVIEW<br />
KEY AREAS/<br />
STREETS/SHOPPING<br />
CENTERS<br />
Fifth Avenue,<br />
42nd to 49th Street<br />
Fifth Avenue,<br />
49th to 60th Street<br />
CONSUMER<br />
PROFILE<br />
MAJOR RETAILERS<br />
PRESENT<br />
Tourists, local business density Zara, H&M, American Girl, Sephora, Aldo,<br />
Urban Outfitters, Lacoste, Fossil, Barnes &<br />
Noble, Benetton<br />
Tourists, local business density, local<br />
shoppers<br />
Saks Fifth Avenue, Michael Kors, Cole Haan,<br />
Bergdorf Goodman, Cartier, Salvatore Ferragamo,<br />
Louis Vuitton, Apple, FAO Schwarz<br />
Madison Avenue Tourists, local shoppers Hermes, Tom Ford, Ralph Lauren, Barneys<br />
New York, Crate & Barrel, Chanel, Escada,<br />
Giorgio Armani, Gucci, Juicy Couture,<br />
Cartier<br />
SoHo Tourists, local shoppers Top Shop, Madewell, Stella McCartney,<br />
Alexander Wang, J. Crew, MAC, Patagonia,<br />
Coach, L’Occitane, Bloomingdale’s, Victoria’s<br />
Secret<br />
Times Square Tourists, local shoppers Sephora, Forever 21, TGI Friday’s, Foot<br />
Locker, Toys R’ Us, Billabong<br />
Meatpacking District Tourists, local shoppers Intermix, Scoop, Diane von Furstenberg,<br />
Dos Caminos, Apple, Stella McCartney, La<br />
Perla<br />
Flatiron Local shoppers Eataly, Restoration Hardware, H&M, Banana<br />
Republic, Anthropologie, Pier 1 Imports,<br />
Sephora<br />
Lower Manhattan Tourists, local business density, local<br />
shoppers<br />
Hermes, Tiffany & Co., Tourbillon, Cipriani,<br />
Century 21<br />
Back to Retail Center Summary<br />
NEW<br />
ENTRANTS<br />
Joe Fresh, Tommy<br />
Bahama, Ted Baker<br />
Zara, Hollister,<br />
Uniqlo, MAC<br />
Belstaff, Baccarat,<br />
Alice & Olivia, Dodo,<br />
Bucellati<br />
Hollister, Lacoste,<br />
C. Wonder, Rebecca<br />
Taylor, Proenza<br />
Schouler<br />
Superdry, Broadway<br />
4D<br />
Christian Louboutin,<br />
Nicholas Kirkwood,<br />
Bond No. 9<br />
TYPICAL RENT<br />
FOR UNIT OF<br />
2,000 SQFT<br />
RANGE OF<br />
UNIT SIZES<br />
$500-$1,000 1,000-45,000 SF<br />
$2,000-$3,000 1,500-250,000 SF<br />
$800-$1,200 500-10,000 SF<br />
$125-$500 500-100,000 SF<br />
$300-$2,000 1,500-115,000 SF<br />
$150-$500 1,500-10,000 SF<br />
Joe Fresh $150-$400 1,500-50,000 SF<br />
TJ Maxx $150-$500 1,000-150,000 SF<br />
Competitive & Complementary Retailers
NEW YORK DMA<br />
COMPETITIVE & COMPLEMENTARY RETAILERS<br />
DATA IS FROM SOURCES DEEMED RELIABLE BUY MAY BE SUBJECT TO ERRORS, OMISSIONS, OR<br />
MODIFICATIONS. THE INFORMATION HEREIN IS PROVIDED WITHOUT REPRESENTATION OR WARRANTY<br />
Back to High Streets Close
WASHINGTON, D.C. / HAGERSTOWN DMA<br />
DMA HIGHLIGHTS<br />
• 6.5 million residents (8th largest DMA in the U.S.)<br />
• Comprises the District of Columbia and surrounding counties within<br />
Maryland, Virginia, West Virginia, and Pennsylvania<br />
• Affluent population with average household income at $75,509 (2nd highest<br />
DMA in U.S. and 52% above U.S. average)<br />
• Highest educated workforce in U.S.; 43 % of residents have a college degree<br />
(Rank #1), and 20% hold a graduate degree (Rank #1)<br />
INTRODUCTION DMA OVERVIEW<br />
TOTAL RETAIL SALES<br />
$111.7 billion<br />
% OF 7 DMA RETAIL SALES<br />
14.5%<br />
% OF US RETAIL SALES<br />
2.4%<br />
Economic Overview Demographic Overview Retail Overview Back to Market Profiles<br />
COMPETITOR LOCATIONS<br />
NORTHEAST<br />
CORRIDOR<br />
RETAIL STUDY<br />
DMA PROFILES<br />
WASHINGTON, D.C. / HAGERSTOWN DMA<br />
CLICK MAP FOR DRIVING TIME &<br />
DISTANCE FROM WASHINGTON, D.C.<br />
/ HAGERSTOWN DMA<br />
CUSHMAN & WAKEFIELD
DRIVE TIME & DISTANCE FROM WASHINGTON, D.C. / HAGERSTOWN DMA<br />
DATA IS FROM SOURCES DEEMED RELIABLE BUY MAY BE SUBJECT TO ERRORS, OMISSIONS, OR<br />
MODIFICATIONS. THE INFORMATION HEREIN IS PROVIDED WITHOUT REPRESENTATION OR WARRANTY<br />
This map shows the driving time and distance<br />
from the Washington, D.C / Hagerstown DMA<br />
to other DMAs in the Northeast corridor.<br />
NORTHEAST<br />
CORRIDOR<br />
RETAIL STUDY<br />
Close<br />
CUSHMAN & WAKEFIELD
WASHINGTON, D.C. / HAGERSTOWN DMA<br />
ECONOMIC OVERVIEW<br />
• Main drivers of the economy are the U.S.<br />
federal government, technology, construction,<br />
international business, and hospitality<br />
• Growth of the private service sector over recent<br />
decades has diversified the economy<br />
• Nation’s most highly educated workforce also a<br />
key driver in economic growth<br />
CHARACTERISTIC WASHINGTON DC<br />
HAGERSTOWN<br />
U.S.<br />
2012 EST. CIVILIAN EMPLOYED POPULATION AGE 16+<br />
Blue Collar 14.3% 21.1%<br />
White Collar 70.1% 60.6%<br />
Service & Farm 15.6% 18.2%<br />
Total Employment 100.0% 100.0%<br />
CHARACTERISTIC WASHINGTON DC<br />
HAGERSTOWN<br />
2012 EST. CIVILIAN EMPLOYED POPULATION AGE 16+<br />
U.S.<br />
Architect/Engineer 2.3% 1.9%<br />
Arts/Entertain/Sports 2.8% 1.9%<br />
Building Grounds Maint 3.4% 3.9%<br />
Business/Financial Ops 7.2% 4.4%<br />
Community/Soc Svcs 1.6% 1.6%<br />
Computer/Mathematical 6.4% 2.4%<br />
Construction/Extraction 5.2% 5.6%<br />
Edu/Training/Library 6.0% 6.0%<br />
Farm/Fish/Forestry 0.2% 0.7%<br />
Food Prep/Serving 4.3% 5.5%<br />
Health Practitioner/Tec 4.2% 5.3%<br />
Healthcare Support 1.7% 2.4%<br />
Maintenance Repair 2.6% 3.4%<br />
Legal 2.8% 1.2%<br />
Life/Phys/Soc Science 1.9% 0.9%<br />
Management 13.0% 9.7%<br />
Office/Admin Support 12.9% 14.0%<br />
Production Occupations 2.4% 6.1%<br />
Protective Svcs 2.8% 2.2%<br />
Sales/Related 9.0% 11.2%<br />
Personal Care/Svc 3.2% 3.5%<br />
Transportation/Moving 4.0% 6.0%<br />
Total Employment 100.0% 100.0%<br />
Close
WASHINGTON, D.C. / HAGERSTOWN DMA<br />
DEMOGRAPHIC OVERVIEW<br />
The demographic characteristics of the Washington, D.C. DMA are profiled in the table below and include age, income and education levels.<br />
Click forward to view population concentrations and median household income.<br />
CHARACTERISTIC WASHINGTON,<br />
D.C.<br />
Population (Mil) 6.5 313.0<br />
Median Age 36.7 36.7<br />
Average HH Income $98,298 $67,315<br />
Median HH Income $75,509 $49,545<br />
INCOME BREAKDOWN<br />
< $15,000 7% 13%<br />
$15,000 to $34,999 12% 22%<br />
$35,000 to $74,999 30% 35%<br />
$75,000 to $99,999 15% 12%<br />
$100,000 + 35% 18%<br />
EDUCATION<br />
< High School 5% 6%<br />
High School < Diploma 6% 8%<br />
High School Graduate 22% 29%<br />
Some College 18% 21%<br />
College Degree < Bachelor 6% 7%<br />
Bachelor Degree 23% 18%<br />
Advanced Degree 20% 10%<br />
US<br />
Population Concentrations
WASHINGTON, D.C. / HAGERSTOWN DMA<br />
POPULATION DENSITY MAP<br />
• xxxxxxx<br />
DATA IS FROM SOURCES DEEMED RELIABLE BUY MAY BE SUBJECT TO ERRORS, OMISSIONS, OR<br />
Back to Demographic Overview Median Household Income<br />
MODIFICATIONS. THE INFORMATION HEREIN IS PROVIDED WITHOUT REPRESENTATION OR WARRANTY
WASHINGTON, D.C. / HAGERSTOWN DMA<br />
MEDIAN HOUSEHOLD INCOME<br />
DATA IS FROM SOURCES DEEMED RELIABLE BUY MAY BE SUBJECT TO ERRORS, OMISSIONS, OR<br />
Back to Population Concentration Close<br />
MODIFICATIONS. THE INFORMATION HEREIN IS PROVIDED WITHOUT REPRESENTATION OR WARRANTY
WASHINGTON, D.C. / HAGERSTOWN DMA<br />
RETAIL OVERVIEW<br />
This section provides key information on major retail shopping centers, high streets (if applicable) and competitive and complementary retailers.<br />
Retail Center Summary
1<br />
2<br />
3<br />
4<br />
5<br />
6<br />
7<br />
WASHINGTON, D.C. / HAGERSTOWN DMA<br />
RETAIL CENTER SUMMARY<br />
(800,000+ sqft)<br />
MALL/<br />
CENTER NAME<br />
Spotsylvania<br />
Towne Centre<br />
Tysons Corner<br />
Center<br />
Go to Map<br />
ADDRESS CITY STATE ZIP<br />
CODE<br />
Spotsylvania<br />
Towne Centre<br />
Tysons Corner<br />
Center<br />
Fredericksburg VA 22407 Super<br />
Regional Mall<br />
McLean VA 22102 Super<br />
Regional Mall<br />
Fair Oaks Mall Fair Oaks Mall Fairfax VA 22033 Super<br />
Regional Mall<br />
Potomac Mills Potomac Mills Woodbridge VA 22192 Super<br />
Regional Mall<br />
Dulles Town<br />
Center<br />
Dulles Town<br />
Center<br />
Sterling VA 20166 Super<br />
Regional Mall<br />
Springfield Mall Springfield Mall Springfield VA 22150 Super<br />
Regional Mall<br />
Milestone<br />
Center<br />
Milestone<br />
Center<br />
Germantown MD 20876 Power<br />
Center<br />
RETAIL TYPE SIZE (SF) SALES<br />
(PSF)<br />
NO. OF<br />
ANCHORS<br />
NO. OF<br />
SPECIALTY<br />
STORES<br />
ANCHOR TENANTS<br />
2,817,902 - 8 186 Belk, Costco, Dick's<br />
Sporting Goods, Havertys,<br />
JCPenney, Macy's, Michaels,<br />
Sears<br />
2,242,582 $700 -<br />
$750<br />
1,570,000 $600 -<br />
$640<br />
1,569,509 $375 -<br />
$400<br />
1,516,974 $425 -<br />
$475<br />
5 279 Bloomingdale's, Lord &<br />
Taylor, Macy's, Nordstrom<br />
4 165 JCPenney, Macy's, Sears,<br />
Lord & Taylor<br />
11 198 Bloomingdale's, Burlington<br />
Coat Factory, Costco,<br />
JCPenney, Last Call,<br />
Marshalls, Nordstrom Rack,<br />
Off 5th, Off Broadway Shoe<br />
Warehouse, T.J. Maxx<br />
6 194 Lord & Taylor, Macy's,<br />
Nordstrom, Old Navy,<br />
Sears, Dick's Sporting<br />
Goods<br />
1,473,238 - 3 245 JCPenney, Macy's, Target<br />
1,397,920 - 10 31 Best Buy, Giant, Home<br />
Depot, Kohl's, Michaels,<br />
PEPBOYS, PetSmart, T.J.<br />
Maxx, Target, Walmart<br />
Back to Retail Overview<br />
Next
8<br />
9<br />
10<br />
11<br />
12<br />
13<br />
14<br />
15<br />
WASHINGTON, D.C. / HAGERSTOWN DMA<br />
RETAIL CENTER SUMMARY<br />
(800,000+ sqft)<br />
MALL/<br />
CENTER NAME<br />
Westfield<br />
Wheaton<br />
Washingtonian<br />
Center<br />
Westfield<br />
Montgomery<br />
ADDRESS CITY STATE ZIP<br />
CODE<br />
11160 Veirs<br />
Mill Rd<br />
9871<br />
Washingtonian<br />
Blvd<br />
7101<br />
Democracy<br />
Blvd<br />
City Place 8661 Colesville<br />
Rd<br />
Virginia<br />
Gateway<br />
13301<br />
Gateway<br />
Center Dr<br />
Lakeforest Mall 701 Russell<br />
Ave<br />
Fashion Centre<br />
At Pentagon<br />
City<br />
Fair Lakes<br />
Center<br />
Go to Map<br />
1100 S Hayes<br />
St<br />
12950-13085<br />
Fair Lakes Pky<br />
Wheaton MD 20902 Super<br />
Regional Mall<br />
Gaithersburg MD 20878 Power<br />
Center<br />
Bethesda MD 20817 Super<br />
Regional Mall<br />
Silver Spring MD 20910 Super<br />
Regional Mall<br />
Gainesville VA 20155 Super<br />
Regional Mall<br />
Gaithersburg MD 20877 Super<br />
Regional Mall<br />
Arlington VA 22202 Super<br />
Regional Mall<br />
Fairfax VA 22033 Super<br />
Regional Mall<br />
RETAIL TYPE SIZE (SF) SALES<br />
(PSF)<br />
1,338,320 $300 -<br />
$350<br />
NO. OF<br />
ANCHORS<br />
NO. OF<br />
SPECIALTY<br />
STORES<br />
ANCHOR TENANTS<br />
4 199 JCPenney, Giant, Macy's,<br />
Target<br />
1,322,075 - 3 39 Dick's Sporting Goods,<br />
Kohl's, Target<br />
1,273,963 $575<br />
-$600<br />
4 192 Sears, Macy's, Nordstrom,<br />
Crate & Barrel<br />
1,234,043 $200 5 55 DSW, Whole Foods,<br />
Marshalls, Burlington Coat<br />
Factory<br />
1,211,116 - 7 87 Best Buy, Giant,<br />
HomeGoods, Lowe's,<br />
PetSmart, Sports Authority,<br />
Target<br />
1,206,695 $250 -<br />
$300<br />
1,194,494 $850 -<br />
$900<br />
4 172 JCPenney, Lord & Taylor,<br />
Macy's, Sears<br />
2 156 Macy's, Nordstrom<br />
1,194,233 - 6 49 Best Buy, BJ's Wholesale,<br />
Bloom, Michaels, Target,<br />
Walmart<br />
Back<br />
Next
16<br />
17<br />
18<br />
19<br />
20<br />
21<br />
22<br />
23<br />
WASHINGTON, D.C. / HAGERSTOWN DMA<br />
RETAIL CENTER SUMMARY<br />
(800,000+ sqft)<br />
MALL/<br />
CENTER NAME<br />
St. Charles<br />
Towne Center<br />
Valley Mall 17301 Valley<br />
Mall Rd<br />
Tysons Galleria 1651-2255<br />
International<br />
Dr<br />
Laurel Shopping<br />
Center<br />
Bowie Town<br />
Center<br />
The Mall At<br />
Prince Georges<br />
Beltway Plaza<br />
Mall<br />
ADDRESS CITY STATE ZIP<br />
CODE<br />
11110 Mall Cir Waldorf MD 20603 Super<br />
Regional Mall<br />
933<br />
Washington<br />
Blvd<br />
15606 Emerald<br />
Way<br />
3500 East<br />
West Hwy<br />
6000<br />
Greenbelt Rd<br />
Hagerstown MD 21740 Super<br />
Regional Mall<br />
McLean VA 22102 Super<br />
Regional Mall<br />
RETAIL TYPE SIZE (SF) SALES<br />
(PSF)<br />
NO. OF<br />
ANCHORS<br />
NO. OF<br />
SPECIALTY<br />
STORES<br />
ANCHOR TENANTS<br />
1,121,445 - 5 140 JCPenney, Kohl's, Macy's,<br />
Sears, Dick's Sporting<br />
Goods<br />
1,024,462 $372 6 98 Bon-Ton, JCPenney, Macy's,<br />
Sears, Toys"R"Us<br />
1,004,588 $725 -<br />
$775<br />
3 117 Neiman Marcus, Saks Fifth<br />
Avenue, Macy's<br />
Laurel MD 20707 Regional Mall 971,095 - 3 67 Dress Barn, Marshalls, CVS<br />
Pharmacy<br />
Bowie MD 20716 Super<br />
Regional Mall<br />
Hyattsville MD 20782 Super<br />
Regional Mall<br />
College Park MD 20740 Super<br />
Regional Mall<br />
Landmark Mall 5801 Duke St Alexandria VA 22304 Super<br />
Regional Mall<br />
Go to Map<br />
935,693 - 7 63 Barnes & Noble, Bed Bath<br />
& Beyond, Best Buy, Macy's<br />
Old Navy, Safeway, Sears<br />
928,274 $390 3 123 JCPenney, Macy's, Target<br />
900,220 $300 6 114 Burlington Coat Factory,<br />
CVS Pharmacy, Giant,<br />
Jo-Ann Stores, Marshalls,<br />
Target<br />
886,712 $275 -<br />
$300<br />
3 117 Sears, Macy's, Lord & Taylor<br />
Back<br />
Next
24<br />
25<br />
WASHINGTON, D.C. / HAGERSTOWN DMA<br />
RETAIL CENTER SUMMARY<br />
(800,000+ sqft)<br />
MALL/<br />
CENTER NAME<br />
Dulles Town<br />
Crossing<br />
ADDRESS CITY STATE ZIP<br />
CODE<br />
45591 Dulles<br />
Eastern Plz<br />
Manassas Mall 8300 Sudley<br />
Rd<br />
Sterling VA 20166 Power<br />
Center<br />
Manassas VA 20109 Super<br />
Regional Mall<br />
RETAIL TYPE SIZE (SF) SALES<br />
(PSF)<br />
NO. OF<br />
ANCHORS<br />
Back<br />
NO. OF<br />
SPECIALTY<br />
STORES<br />
ANCHOR TENANTS<br />
835,382 - 9 28 Bed Bath & Beyond, Best<br />
Buy, Lowe's, Nordstrom,<br />
Nordstrom Rack, Sam's<br />
Club, T.J. Maxx, Walmart<br />
819,068 $275 -<br />
$325<br />
5 113 Macy's, Sears, JCPenney,<br />
Target, Walmart<br />
Retail Center Summary Map
WASHINGTON, D.C. / HAGERSTOWN DMA<br />
RETAIL CENTER SUMMARY MAP<br />
DATA IS FROM SOURCES DEEMED RELIABLE BUY MAY BE SUBJECT TO ERRORS, OMISSIONS, OR<br />
MODIFICATIONS. THE INFORMATION HEREIN IS PROVIDED WITHOUT REPRESENTATION OR WARRANTY<br />
Click on the<br />
numbered locations<br />
to see corresponding<br />
mall/shopping center<br />
summary<br />
Back to Retail Center Summary High Streets
WASHINGTON, D.C. / HAGERSTOWN DMA<br />
HIGH STREETS<br />
MARKET OVERVIEW<br />
KEY AREAS CONSUMER<br />
PROFILE<br />
MAJOR RETAILERS<br />
PRESENT<br />
Georgetown Tourists, local shoppers Urban Outfitters, Banana Republic,<br />
Apple, Cusp, Kate Spade, J. Crew,<br />
Sephora, BCBG<br />
East End Tourists, local business density Macy’s, H&M, Forever 21, Jos. A Bank, TJ<br />
Maxx, Zara, Ann Taylor, Banana Republic<br />
Dupont Circle Tourists, local business density Brooks Brothers, Victoria’s Secret, Tiny<br />
Jewel Box, Proper Topper, Burberry<br />
Penn Quarter Tourists, local business density Bed Bath & Beyond, H&M, Urban<br />
Outfitters, Aveda, Benetton<br />
14th Street Local shoppers Mitchell Gold + Bob Williams,<br />
lululemon, Whole Foods<br />
Columbia Heights Local shoppers Target, Best Buy, Bed Bath and Beyond,<br />
Marshalls<br />
Capitol Hill Tourists, local business density,<br />
local shoppers<br />
The Body Shop, Chico’s, Johnston &<br />
Murphy, Victoria’s Secret<br />
NEW<br />
ENTRANTS<br />
Nike, All Saints<br />
Spitalfields<br />
J. Crew, Del<br />
Frisco’s<br />
Pinkberry, Hello<br />
Cupcake<br />
Leica Camera<br />
Store<br />
Parc by Stephen<br />
Starr, Barcelona<br />
Wine Bar<br />
TYPICAL RENT<br />
FOR UNIT OF<br />
2,000 SQFT<br />
RANGE OF<br />
UNIT SIZES<br />
$135 -$150 PSF 700-30,000 SF<br />
$50-$200 PSF 1,000-50,000 SF<br />
$70-$125 PSF 1,000-35,000 SF<br />
$150-$200 PSF 1,000-50,000 SF<br />
$40-$75 PSF 1,000-15,000 SF<br />
DSW, Chipotle $40-$75 PSF 1.000-80,000 SF<br />
Crumbs Bake<br />
Shop, Roti<br />
$40-$70 PSF 1,000-10,000 SF<br />
Back to Retail Center Summary<br />
Next
WASHINGTON, D.C. / HAGERSTOWN DMA<br />
HIGH STREETS<br />
MARKET OVERVIEW<br />
KEY AREAS CONSUMER<br />
PROFILE<br />
Chevy Chase Local business density, local<br />
shoppers<br />
Bethesda Local business density, local<br />
shoppers<br />
MAJOR RETAILERS<br />
PRESENT<br />
Bloomingdales, Neiman Marcus, Tiffany<br />
& Co., J. Crew, Jimmy Choo<br />
Apple, lululemon, The North Face,<br />
Barnes & Noble, Bang & Olufsen,<br />
Equinox<br />
Tysons Corner Local shoppers Nordstrom, Macy’s, Neiman Marcus,<br />
Bloomingdales, Saks Fifth Avenue<br />
Old Town Alexandria Tourists, local shoppers Banana Republic, Paper Source, Nine<br />
West, Gap Outlet, Lou Lou Boutique<br />
Rosslyn – Ballston<br />
Corridor<br />
Local business density, local<br />
shoppers<br />
Crate & Barrel, Apple, Pottery Barn,<br />
Macy’s, lululemon, South Moon Under,<br />
Free People<br />
Back<br />
NEW<br />
ENTRANTS<br />
Rosa Mexicano,<br />
H&M<br />
TYPICAL RENT<br />
FOR UNIT OF<br />
2,000 SQFT<br />
RANGE OF<br />
UNIT SIZES<br />
$60-$125 PSF 1,000-45,000 SF<br />
Boloco $50-$90 PSF 500-40,000 SF<br />
American Girl,<br />
Tory Burch<br />
H&M,<br />
Anthropologie<br />
$50-$200 PSF 500-80,000 SF<br />
$40-$75 PSF 500-25,000 SF<br />
Trader Joes $38-$70 PSF 1,000-20,000 SF<br />
Competitive & Complementary Retailers
WASHINGTON, D.C. / HAGERSTOWN DMA<br />
COMPETITIVE & COMPLEMENTARY RETAILERS<br />
DATA IS FROM SOURCES DEEMED RELIABLE BUY MAY BE SUBJECT TO ERRORS, OMISSIONS, OR MODIFICATIONS.<br />
THE INFORMATION HEREIN IS PROVIDED WITHOUT REPRESENTATION OR WARRANTY<br />
Back to High Streets Close