

NTRD-02 Final Project Report The Effects of Low Rolling Resistance ...
NTRD-02 Final Project Report The Effects of Low Rolling Resistance ...
NTRD-02 Final Project Report The Effects of Low Rolling Resistance ...

Create successful ePaper yourself
Turn your PDF publications into a flip-book with our unique Google optimized e-Paper software.
4.3 Evaluation <strong>of</strong> the Candidate Cycle<br />
After synthesizing the composite cycle, several evaluations were made, including comparisons <strong>of</strong><br />
the cycle to the target dataset. Analysis <strong>of</strong> speed v. acceleration distributions for the composite<br />
cycle and the raw data showed a good match; a few outlying points in the raw data were not<br />
included in the micro-trips used in the cycle, and thus the representation is good from that<br />
standpoint. <strong>The</strong> speed histogram <strong>of</strong> the composite cycle matches the speed histogram from the<br />
raw data, showing that the time-at-speed for the cycle is representative <strong>of</strong> the raw data. Full<br />
details can be seen in the detailed report on the cycle development (Palacios and DeFries, 2007).<br />
A number <strong>of</strong> statistics were calculated so that the characteristics <strong>of</strong> the cycle could be compared<br />
to the characteristics <strong>of</strong> the target dataset (see Table 1). Because the micro-trips in the cycle<br />
were selected for their non-idle speed and acceleration characteristics, other statistics that are<br />
calculated and compared do not necessarily reflect as close a match between the test cycle and<br />
the raw data.<br />
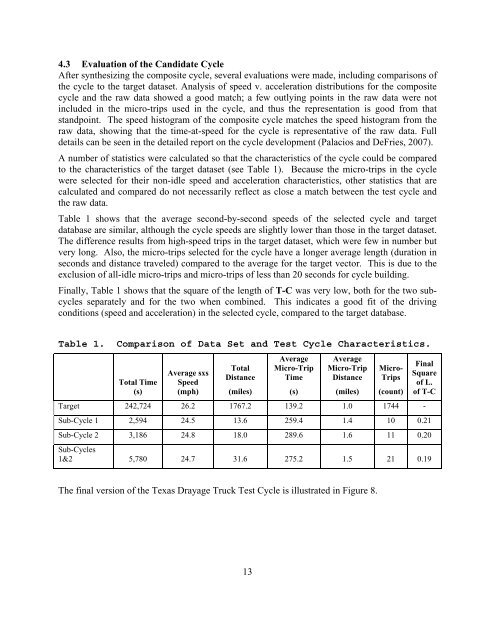
Table 1 shows that the average second-by-second speeds <strong>of</strong> the selected cycle and target<br />
database are similar, although the cycle speeds are slightly lower than those in the target dataset.<br />
<strong>The</strong> difference results from high-speed trips in the target dataset, which were few in number but<br />
very long. Also, the micro-trips selected for the cycle have a longer average length (duration in<br />
seconds and distance traveled) compared to the average for the target vector. This is due to the<br />
exclusion <strong>of</strong> all-idle micro-trips and micro-trips <strong>of</strong> less than 20 seconds for cycle building.<br />
<strong>Final</strong>ly, Table 1 shows that the square <strong>of</strong> the length <strong>of</strong> T-C was very low, both for the two subcycles<br />
separately and for the two when combined. This indicates a good fit <strong>of</strong> the driving<br />
conditions (speed and acceleration) in the selected cycle, compared to the target database.<br />
Table 1. Comparison <strong>of</strong> Data Set and Test Cycle Characteristics.<br />
Total Time<br />
(s)<br />
Average sxs<br />
Speed<br />
(mph)<br />
Total<br />
Distance<br />
(miles)<br />
13<br />
Average<br />
Micro-Trip<br />
Time<br />
(s)<br />
Average<br />
Micro-Trip<br />
Distance<br />
(miles)<br />
Micro-<br />
Trips<br />
(count)<br />
Target 242,724 26.2 1767.2 139.2 1.0 1744 -<br />
<strong>Final</strong><br />
Square<br />
<strong>of</strong> L.<br />
<strong>of</strong> T-C<br />
Sub-Cycle 1 2,594 24.5 13.6 259.4 1.4 10 0.21<br />
Sub-Cycle 2 3,186 24.8 18.0 289.6 1.6 11 0.20<br />
Sub-Cycles<br />
1&2 5,780 24.7 31.6 275.2 1.5 21 0.19<br />
<strong>The</strong> final version <strong>of</strong> the Texas Drayage Truck Test Cycle is illustrated in Figure 8.


