

NTRD-02 Final Project Report The Effects of Low Rolling Resistance ...
NTRD-02 Final Project Report The Effects of Low Rolling Resistance ...
NTRD-02 Final Project Report The Effects of Low Rolling Resistance ...

Create successful ePaper yourself
Turn your PDF publications into a flip-book with our unique Google optimized e-Paper software.
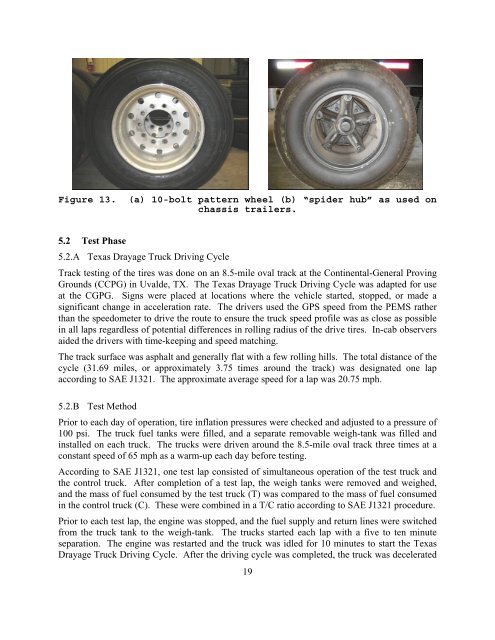
Figure 13. (a) 10-bolt pattern wheel (b) “spider hub” as used on<br />
chassis trailers.<br />
5.2 Test Phase<br />
5.2.A Texas Drayage Truck Driving Cycle<br />
Track testing <strong>of</strong> the tires was done on an 8.5-mile oval track at the Continental-General Proving<br />
Grounds (CCPG) in Uvalde, TX. <strong>The</strong> Texas Drayage Truck Driving Cycle was adapted for use<br />
at the CGPG. Signs were placed at locations where the vehicle started, stopped, or made a<br />
significant change in acceleration rate. <strong>The</strong> drivers used the GPS speed from the PEMS rather<br />
than the speedometer to drive the route to ensure the truck speed pr<strong>of</strong>ile was as close as possible<br />
in all laps regardless <strong>of</strong> potential differences in rolling radius <strong>of</strong> the drive tires. In-cab observers<br />
aided the drivers with time-keeping and speed matching.<br />
<strong>The</strong> track surface was asphalt and generally flat with a few rolling hills. <strong>The</strong> total distance <strong>of</strong> the<br />
cycle (31.69 miles, or approximately 3.75 times around the track) was designated one lap<br />
according to SAE J1321. <strong>The</strong> approximate average speed for a lap was 20.75 mph.<br />
5.2.B Test Method<br />
Prior to each day <strong>of</strong> operation, tire inflation pressures were checked and adjusted to a pressure <strong>of</strong><br />
100 psi. <strong>The</strong> truck fuel tanks were filled, and a separate removable weigh-tank was filled and<br />
installed on each truck. <strong>The</strong> trucks were driven around the 8.5-mile oval track three times at a<br />
constant speed <strong>of</strong> 65 mph as a warm-up each day before testing.<br />
According to SAE J1321, one test lap consisted <strong>of</strong> simultaneous operation <strong>of</strong> the test truck and<br />
the control truck. After completion <strong>of</strong> a test lap, the weigh tanks were removed and weighed,<br />
and the mass <strong>of</strong> fuel consumed by the test truck (T) was compared to the mass <strong>of</strong> fuel consumed<br />
in the control truck (C). <strong>The</strong>se were combined in a T/C ratio according to SAE J1321 procedure.<br />
Prior to each test lap, the engine was stopped, and the fuel supply and return lines were switched<br />
from the truck tank to the weigh-tank. <strong>The</strong> trucks started each lap with a five to ten minute<br />
separation. <strong>The</strong> engine was restarted and the truck was idled for 10 minutes to start the Texas<br />
Drayage Truck Driving Cycle. After the driving cycle was completed, the truck was decelerated<br />
19


