Chapter 3 Time-to-live Covert Channels - CAIA
Chapter 3 Time-to-live Covert Channels - CAIA
Chapter 3 Time-to-live Covert Channels - CAIA

Create successful ePaper yourself
Turn your PDF publications into a flip-book with our unique Google optimized e-Paper software.
Throughput (bits/s)<br />
200<br />
150<br />
100<br />
50<br />
0<br />
●<br />
●<br />
CHAPTER 3. TIME-TO-LIVE COVERT CHANNELS<br />
●<br />
●<br />
●<br />
●<br />
scp A−>B<br />
scp B−>A<br />
Q3 A−>B<br />
Q3 B−>A<br />
0.000 0.002 0.004 0.006 0.008 0.010<br />
TTL error rate<br />
SSH A−>B<br />
SSH B−>A<br />
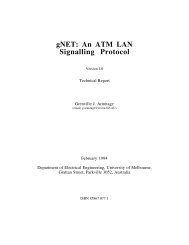
Figure 3.25: Throughput depending on the TTL error rate for 0% packet loss and reordering<br />
Throughput (bits/s)<br />
200<br />
150<br />
100<br />
50<br />
0<br />
●<br />
●<br />
●<br />
●<br />
scp A−>B<br />
scp B−>A<br />
●<br />
● ● ●<br />
Q3 A−>B<br />
Q3 B−>A<br />
0.0 0.2 0.4 0.6 0.8 1.0<br />
Packet loss rate<br />
●<br />
●<br />
SSH A−>B<br />
SSH B−>A<br />
Figure 3.26: Throughput depending on the packet loss rate with 0.1% TTL error rate and 0%<br />
packet reordering<br />
We used smaller code lengths for the testbed experiments <strong>to</strong> increase the <strong>to</strong>tal number<br />
of blocks, given that the packet rates were much smaller than the rates in the traces.<br />
Because of the smaller block sizes and the higher redundancies the code rates are smaller<br />
than in the trace-file analysis.<br />
Figure 3.25, 3.26 and 3.27 show the throughput for the different applications and<br />
error rates. For scp the data was transferred from Alice <strong>to</strong> Bob and hence the rate of<br />
overt packets in that direction is higher. For Q3 the throughput from Alice <strong>to</strong> Bob is<br />
much larger, as Alice’s host running the Q3 client sent one packet every 10–20 ms, but<br />
Bob’s host running the server only sent one packet every 50 ms [190]. SSH throughput is<br />
roughly symmetric with the used shell commands.<br />
Figure 3.28 shows the percentage of the channel capacity reached for the different<br />
applications averaged over both directions. The percentage should be roughly equal for all<br />
applications. However, SSH performs worse since the number of data blocks transmitted<br />
70<br />
●<br />
●