Semiparametric Analysis to Estimate the Deal Effect Curve
Semiparametric Analysis to Estimate the Deal Effect Curve
Semiparametric Analysis to Estimate the Deal Effect Curve
You also want an ePaper? Increase the reach of your titles
YUMPU automatically turns print PDFs into web optimized ePapers that Google loves.
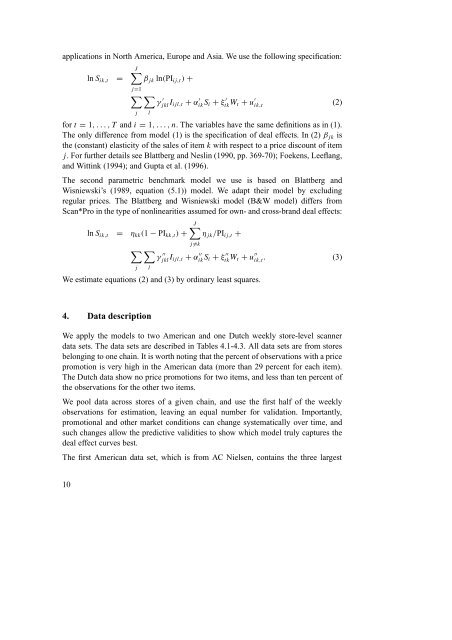
applications in North America, Europe and Asia. We use <strong>the</strong> following specification:<br />
J<br />
ln Sik,t = βjk ln(PIij,t ) +<br />
j=1<br />
<br />
γ ′<br />
jklIij l,t + α ′ ikSi + ξ ′<br />
tkWt +u ′ ik,t<br />
j<br />
l<br />
for t = 1,...,T and i = 1,...,n. The variables have <strong>the</strong> same definitions as in (1).<br />
The only difference from model (1) is <strong>the</strong> specification of deal effects. In (2) βjk is<br />
<strong>the</strong> (constant) elasticity of <strong>the</strong> sales of item k with respect <strong>to</strong> a price discount of item<br />
j. For fur<strong>the</strong>r details see Blattberg and Neslin (1990, pp. 369-70); Foekens, Leeflang,<br />
and Wittink (1994); and Gupta et al. (1996).<br />
The second parametric benchmark model we use is based on Blattberg and<br />
Wisniewski’s (1989, equation (5.1)) model. We adapt <strong>the</strong>ir model by excluding<br />
regular prices. The Blattberg and Wisniewski model (B&W model) differs from<br />
Scan*Pro in <strong>the</strong> type of nonlinearities assumed for own- and cross-brand deal effects:<br />
J<br />
ln Sik,t = ηkk(1 − PIkk,t) + ηjk/PIij,t +<br />
j<br />
l<br />
j=k<br />
<br />
γ ′′<br />
jklIij l,t + α ′′<br />
ikSi + ξ ′′<br />
tkWt +u ′′<br />
ik,t . (3)<br />
We estimate equations (2) and (3) by ordinary least squares.<br />
4. Data description<br />
We apply <strong>the</strong> models <strong>to</strong> two American and one Dutch weekly s<strong>to</strong>re-level scanner<br />
data sets. The data sets are described in Tables 4.1-4.3. All data sets are from s<strong>to</strong>res<br />
belonging <strong>to</strong> one chain. It is worth noting that <strong>the</strong> percent of observations with a price<br />
promotion is very high in <strong>the</strong> American data (more than 29 percent for each item).<br />
The Dutch data show no price promotions for two items, and less than ten percent of<br />
<strong>the</strong> observations for <strong>the</strong> o<strong>the</strong>r two items.<br />
We pool data across s<strong>to</strong>res of a given chain, and use <strong>the</strong> first half of <strong>the</strong> weekly<br />
observations for estimation, leaving an equal number for validation. Importantly,<br />
promotional and o<strong>the</strong>r market conditions can change systematically over time, and<br />
such changes allow <strong>the</strong> predictive validities <strong>to</strong> show which model truly captures <strong>the</strong><br />
deal effect curves best.<br />
The first American data set, which is from AC Nielsen, contains <strong>the</strong> three largest<br />
10<br />
(2)


