Semiparametric Analysis to Estimate the Deal Effect Curve
Semiparametric Analysis to Estimate the Deal Effect Curve
Semiparametric Analysis to Estimate the Deal Effect Curve

You also want an ePaper? Increase the reach of your titles
YUMPU automatically turns print PDFs into web optimized ePapers that Google loves.
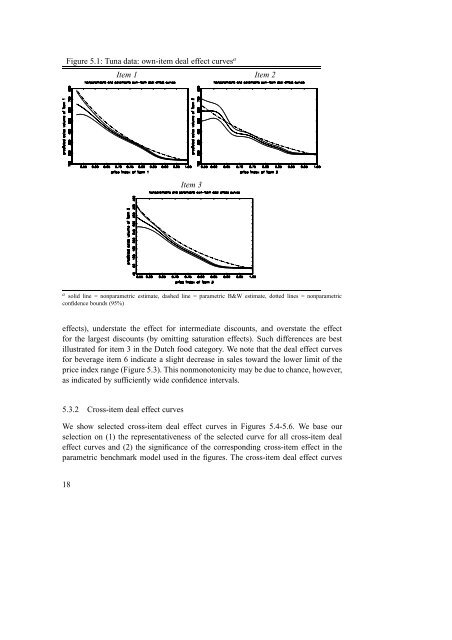
Figure 5.1: Tuna data: own-item deal effect curves a<br />
Item 1 Item 2<br />
Item 3<br />
a solid line = nonparametric estimate, dashed line = parametric B&W estimate, dotted lines = nonparametric<br />
confidence bounds (95%)<br />
effects), understate <strong>the</strong> effect for intermediate discounts, and overstate <strong>the</strong> effect<br />
for <strong>the</strong> largest discounts (by omitting saturation effects). Such differences are best<br />
illustrated for item 3 in <strong>the</strong> Dutch food category. We note that <strong>the</strong> deal effect curves<br />
for beverage item 6 indicate a slight decrease in sales <strong>to</strong>ward <strong>the</strong> lower limit of <strong>the</strong><br />
price index range (Figure 5.3). This nonmono<strong>to</strong>nicity may be due <strong>to</strong> chance, however,<br />
as indicated by sufficiently wide confidence intervals.<br />
5.3.2 Cross-item deal effect curves<br />
We show selected cross-item deal effect curves in Figures 5.4-5.6. We base our<br />
selection on (1) <strong>the</strong> representativeness of <strong>the</strong> selected curve for all cross-item deal<br />
effect curves and (2) <strong>the</strong> significance of <strong>the</strong> corresponding cross-item effect in <strong>the</strong><br />
parametric benchmark model used in <strong>the</strong> figures. The cross-item deal effect curves<br />
18