Semiparametric Analysis to Estimate the Deal Effect Curve
Semiparametric Analysis to Estimate the Deal Effect Curve
Semiparametric Analysis to Estimate the Deal Effect Curve

Create successful ePaper yourself
Turn your PDF publications into a flip-book with our unique Google optimized e-Paper software.
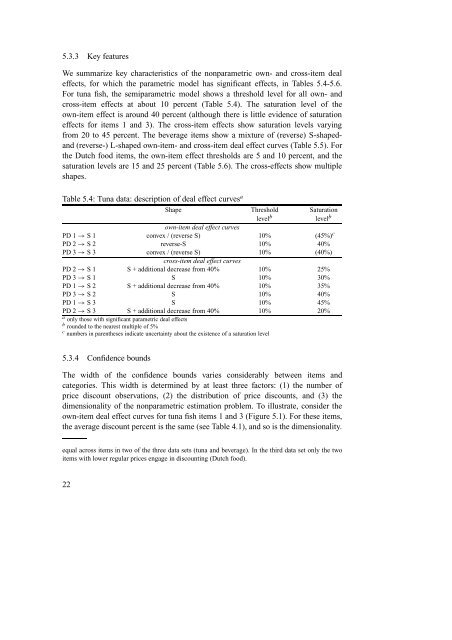
5.3.3 Key features<br />
We summarize key characteristics of <strong>the</strong> nonparametric own- and cross-item deal<br />
effects, for which <strong>the</strong> parametric model has significant effects, in Tables 5.4-5.6.<br />
For tuna fish, <strong>the</strong> semiparametric model shows a threshold level for all own- and<br />
cross-item effects at about 10 percent (Table 5.4). The saturation level of <strong>the</strong><br />
own-item effect is around 40 percent (although <strong>the</strong>re is little evidence of saturation<br />
effects for items 1 and 3). The cross-item effects show saturation levels varying<br />
from 20 <strong>to</strong> 45 percent. The beverage items show a mixture of (reverse) S-shapedand<br />
(reverse-) L-shaped own-item- and cross-item deal effect curves (Table 5.5). For<br />
<strong>the</strong> Dutch food items, <strong>the</strong> own-item effect thresholds are 5 and 10 percent, and <strong>the</strong><br />
saturation levels are 15 and 25 percent (Table 5.6). The cross-effects show multiple<br />
shapes.<br />
Table 5.4: Tuna data: description of deal effect curves a<br />
Shape Threshold Saturation<br />
level b level b<br />
own-item deal effect curves<br />
PD 1 → S 1 convex / (reverse S) 10% (45%) c<br />
PD 2 → S 2 reverse-S 10% 40%<br />
PD 3 → S 3 convex / (reverse S) 10% (40%)<br />
cross-item deal effect curves<br />
PD 2 → S 1 S + additional decrease from 40% 10% 25%<br />
PD 3 → S 1 S 10% 30%<br />
PD 1 → S 2 S + additional decrease from 40% 10% 35%<br />
PD 3 → S 2 S 10% 40%<br />
PD 1 → S 3 S 10% 45%<br />
PD 2 → S 3 S + additional decrease from 40% 10% 20%<br />
a only those with significant parametric deal effects<br />
b rounded <strong>to</strong> <strong>the</strong> nearest multiple of 5%<br />
c numbers in paren<strong>the</strong>ses indicate uncertainty about <strong>the</strong> existence of a saturation level<br />
5.3.4 Confidence bounds<br />
The width of <strong>the</strong> confidence bounds varies considerably between items and<br />
categories. This width is determined by at least three fac<strong>to</strong>rs: (1) <strong>the</strong> number of<br />
price discount observations, (2) <strong>the</strong> distribution of price discounts, and (3) <strong>the</strong><br />
dimensionality of <strong>the</strong> nonparametric estimation problem. To illustrate, consider <strong>the</strong><br />
own-item deal effect curves for tuna fish items 1 and 3 (Figure 5.1). For <strong>the</strong>se items,<br />
<strong>the</strong> average discount percent is <strong>the</strong> same (see Table 4.1), and so is <strong>the</strong> dimensionality.<br />
equal across items in two of <strong>the</strong> three data sets (tuna and beverage). In <strong>the</strong> third data set only <strong>the</strong> two<br />
items with lower regular prices engage in discounting (Dutch food).<br />
22