Semiparametric Analysis to Estimate the Deal Effect Curve
Semiparametric Analysis to Estimate the Deal Effect Curve
Semiparametric Analysis to Estimate the Deal Effect Curve

You also want an ePaper? Increase the reach of your titles
YUMPU automatically turns print PDFs into web optimized ePapers that Google loves.
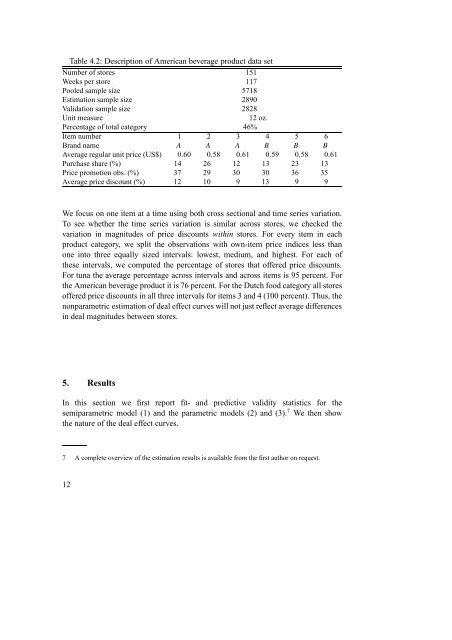
Table 4.2: Description of American beverage product data set<br />
Number of s<strong>to</strong>res 151<br />
Weeks per s<strong>to</strong>re 117<br />
Pooled sample size 5718<br />
Estimation sample size 2890<br />
Validation sample size 2828<br />
Unit measure 12 oz.<br />
Percentage of <strong>to</strong>tal category 46%<br />
Itemnumber 1 2 3 4 5 6<br />
Brand name A A A B B B<br />
Average regular unit price (US$) 0.60 0.58 0.61 0.59 0.58 0.61<br />
Purchase share (%) 14 26 12 13 23 13<br />
Price promotion obs. (%) 37 29 30 30 36 35<br />
Average price discount (%) 12 10 9 13 9 9<br />
We focus on one item at a time using both cross sectional and time series variation.<br />
To see whe<strong>the</strong>r <strong>the</strong> time series variation is similar across s<strong>to</strong>res, we checked <strong>the</strong><br />
variation in magnitudes of price discounts within s<strong>to</strong>res. For every item in each<br />
product category, we split <strong>the</strong> observations with own-item price indices less than<br />
one in<strong>to</strong> three equally sized intervals: lowest, medium, and highest. For each of<br />
<strong>the</strong>se intervals, we computed <strong>the</strong> percentage of s<strong>to</strong>res that offered price discounts.<br />
For tuna <strong>the</strong> average percentage across intervals and across items is 95 percent. For<br />
<strong>the</strong> American beverage product it is 76 percent. For <strong>the</strong> Dutch food category all s<strong>to</strong>res<br />
offered price discounts in all three intervals for items 3 and 4 (100 percent). Thus, <strong>the</strong><br />
nonparametric estimation of deal effect curves will not just reflect average differences<br />
in deal magnitudes between s<strong>to</strong>res.<br />
5. Results<br />
In this section we first report fit- and predictive validity statistics for <strong>the</strong><br />
semiparametric model (1) and <strong>the</strong> parametric models (2) and (3). 7 We <strong>the</strong>n show<br />
<strong>the</strong> nature of <strong>the</strong> deal effect curves.<br />
7 A complete overview of <strong>the</strong> estimation results is available from <strong>the</strong> first author on request.<br />
12