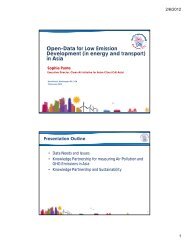
Accessing Asia 2012 - Clean Air Initiative
Accessing Asia 2012 - Clean Air Initiative
Accessing Asia 2012 - Clean Air Initiative

Create successful ePaper yourself
Turn your PDF publications into a flip-book with our unique Google optimized e-Paper software.
ACCESSING ASIA<br />
<strong>Air</strong> Pollution and Greenhouse Gas Emissions from Road Transport and Electricity<br />
BANGLADESH<br />
People’s Republic of Bangladesh<br />
million tons<br />
Dhaka<br />
Land area: 130168 km 2<br />
Population: 149 million (2010)<br />
Urban population: 28%, 42 million (2010)<br />
Population with access to electricity: 41%, 60 million (2009)<br />
GDP (constant 2000 USD): 83 billion (2010)<br />
GDP per capita (constant 2000 USD): 557 (2010)<br />
ROAD TRANSPORT: EMISSIONS PER VEHICLE TYPE<br />
7<br />
6<br />
5<br />
4<br />
3<br />
2<br />
1<br />
0<br />
Total CO2 Emissions CO2 Emissions By Type (2010) CO2 per GDP & capita<br />
5.9<br />
9%<br />
0.05<br />
0.08<br />
2.7 2.9<br />
4.1<br />
4.6<br />
5.0<br />
52%<br />
22%<br />
2W<br />
3W<br />
PC<br />
MUV<br />
BUS<br />
0.04<br />
0.03<br />
0.02<br />
0.01<br />
0.06<br />
0.04<br />
0.02<br />
2000 2002 2004 2006 2008 2010<br />
6%<br />
5%<br />
4%<br />
2%<br />
LCV<br />
HCV<br />
0.00<br />
0.00<br />
2000 2004 2008<br />
CO2 emissions per capita<br />
CO2 emissions per GDP<br />
Source: <strong>Clean</strong> <strong>Air</strong> <strong>Asia</strong> estimates, <strong>2012</strong> Source: <strong>Clean</strong> <strong>Air</strong> <strong>Asia</strong> estimates, <strong>2012</strong><br />
Source: <strong>Clean</strong> <strong>Air</strong> <strong>Asia</strong> estimates, <strong>2012</strong><br />
ROAD TRANSPORT: DRIVERS OF EMISSIONS<br />
vehicles (millions)<br />
Vehicle Population & Motorization Index<br />
1.2<br />
1<br />
0.8<br />
0.6<br />
0.4<br />
0.2<br />
0<br />
100%<br />
80%<br />
60%<br />
40%<br />
20%<br />
0%<br />
Vehicle Population<br />
Motorization Index<br />
2000 2002 2004 2006 2008 2010<br />
Source: <strong>Clean</strong> <strong>Air</strong> <strong>Asia</strong> estimates, <strong>2012</strong><br />
8<br />
7<br />
6<br />
5<br />
4<br />
3<br />
2<br />
1<br />
0<br />
Vehicles/1000 people<br />
ktoe<br />
2000<br />
1500<br />
1000<br />
500<br />
tonsCO 2 per capita<br />
Fuel Consumption<br />
VKT by Mode (2000 and 2010) Emission Standards for New Light-Duty Vehicles<br />
2000 2010<br />
Source: <strong>Clean</strong> <strong>Air</strong> <strong>Asia</strong> estimates, <strong>2012</strong><br />
2W<br />
3W<br />
PC<br />
MUV<br />
Bus<br />
LCV<br />
HCV<br />
Source: <strong>Clean</strong> <strong>Air</strong> <strong>Asia</strong>.<br />
Emissions Profile: Bangladesh<br />
<strong>Clean</strong> <strong>Air</strong> <strong>Asia</strong>. <strong>2012</strong>. Emissions Profile: Bangladesh. Pasig City. Philippines.<br />
The Emissions Profile accompanies <strong>Accessing</strong> <strong>Asia</strong>: <strong>Air</strong> Pollution and Greenhouse Gas Emissions Indicators from Road Transport and Electricity.”<strong>Accessing</strong><strong>Asia</strong> presents the first<br />
benchmark of air pollutant (as particulate matter, PM) and GHG (as CO2) emissions for 13 countries across <strong>Asia</strong> for road transport and electricity.<br />
0<br />
2000 2002 2004 2006 2008 2010<br />
Source: <strong>Clean</strong> <strong>Air</strong> <strong>Asia</strong> estimates, <strong>2012</strong><br />
Gasoline Diesel<br />
Euro 2 Euro 1<br />
Since 2005 Since 2005<br />
Current Sulfur levels in Diesel (ppm)<br />
Since 2002 5000<br />
Gasoline<br />
Diesel<br />
LPG<br />
CNG<br />
Electric<br />
KgCO2 per US dollar at<br />
constant 2000 prices
ACCESSING ASIA<br />
<strong>Air</strong> Pollution and Greenhouse Gas Emissions from Road Transport and Electricity<br />
ELECTRICITY: CO 2 EMISSIONS<br />
1.00<br />
0.80<br />
0.60<br />
0.40<br />
0.20<br />
0.00<br />
0.69 0.70<br />
1.00<br />
0.80<br />
0.60<br />
0.40<br />
0.20<br />
0.00<br />
0.05<br />
ELECTRICITY: DRIVERS OF EMISSIONS<br />
TWh<br />
CO 2 Emissions (from generation)<br />
per Source Type (2009)<br />
40<br />
35<br />
30<br />
25<br />
20<br />
15<br />
10<br />
5<br />
0<br />
NOTES:<br />
49%<br />
27<br />
million tons<br />
6%<br />
Million Metric Tons<br />
Total CO 2 emissions from generation and consumption<br />
40<br />
30<br />
20<br />
10<br />
0<br />
2000 2001 2002 2003 2004 2005 2006 2007 2008 2009<br />
Total CO2 from electricity generation<br />
Total CO2 from electricity consumption<br />
kgCO2 per kWh TCO2 per capita<br />
kgCO2 per GDP<br />
2000 2009<br />
45%<br />
Coal Oil Natural Gas<br />
Source: <strong>Clean</strong> <strong>Air</strong> <strong>Asia</strong> estimates, <strong>2012</strong><br />
<strong>Asia</strong> Average 2009: 0.50<br />
2000 2001 2002 2003 2004 2005 2006 2007 2008 2009<br />
ELECTRICITY GENERATION<br />
ELECTRICITY CONSUMPTION<br />
<strong>Asia</strong> Average 2009: 0.83<br />
0.11<br />
2000 2009<br />
Source: <strong>Clean</strong> <strong>Air</strong> <strong>Asia</strong> estimates, <strong>2012</strong><br />
Generation by<br />
Source Type (2009)<br />
Source: <strong>Clean</strong> <strong>Air</strong> <strong>Asia</strong> estimates, <strong>2012</strong><br />
1.00<br />
0.80<br />
0.60<br />
0.40<br />
0.20<br />
0.00<br />
<strong>Asia</strong> Average 2009: 0.90<br />
0.21<br />
0.14<br />
2000 2009<br />
Consumption by<br />
End-use Sector (2009)<br />
Sources: Bangladesh Power Development Board Annual Report 2008-2010; Md. Alam Hossain Modal, Wulf Boie, Manfred Denich. (2010). Future Demand<br />
Scenarios of Bangladesh Power Sector; Bangladesh Power Sector Data Book 2006; World Bank Development Indicators<br />
1. The boundaries, colors, denominations, and other information shown on any map in this report do not imply any judgment or endorsement on the part of <strong>Clean</strong> <strong>Air</strong> <strong>Asia</strong> concerning the<br />
delimination or legal status of any territory or boundaries. In no event will <strong>Clean</strong> <strong>Air</strong> <strong>Asia</strong> be liable for any form of damage arising from the application or misapplication of this report.<br />
2. Emissions from road transport sector were estimated using the Activity-Structure-Intensity-Fuel (ASIF) approach (adapted from Schipper and Marie 1999; Schipper, Gorham, and Marie, 2000). In<br />
this approach, road transport emissions are dependent on the level of transport activity (A); road transport mode structure (S); fuel intensity (I); and carbon content of fuel or emission factor (F).<br />
3. Vehicle population numbers were collected from the Bangladesh Road Transport Authority. VKT information were sourced from the Roads and Highways Department, Ministry of Construction.<br />
4. Fuel consumption data presented in this profile is based on activity data.<br />
5. Data collected is from reported electricity generation and consumption.<br />
6. Electricity generation from oil, natural gas, and hydropower. Geothermal power, combustible renewables, wind power, and solar power are not applicable.<br />
7. Due to the lack of data, electricity consumption by end-use sector is considered to be under reported.<br />
8. Electricity consumption from other sectors includes public administration and defense, education, health and social services, community, social and personal services.<br />
Emissions Profile: Bangladesh<br />
<strong>Clean</strong> <strong>Air</strong> <strong>Asia</strong>. <strong>2012</strong>. Emissions Profile: Bangladesh. Pasig City. Philippines.<br />
For more information about <strong>Clean</strong> <strong>Air</strong> <strong>Asia</strong>, please visit www.cleanairasia.org<br />
For the data found in this report, please visit www.CitiesACT.org<br />
Natural Gas<br />
89%<br />
38 TWh<br />
Other<br />
17%<br />
Industrial<br />
28%<br />
Commercial<br />
9%<br />
22 TWh<br />
Residential<br />
46%
million tons<br />
ACCESSING ASIA<br />
<strong>Air</strong> Pollution and Greenhouse Gas Emissions from Road Transport and Electricity<br />
INDIA<br />
Republic of India<br />
Delhi<br />
Land area: 2973193 km 2<br />
Population: 1171 million (2010)<br />
Urban population: 30%, 352 million (2010)<br />
Population with access to electricity: 66%, 766 million (2009)<br />
GDP (constant 2000 USD): 971 billion (2010)<br />
GDP per capita (constant 2000 USD): 830 (2010)<br />
ROAD TRANSPORT: EMISSIONS PER VEHICLE TYPE<br />
300<br />
250<br />
200<br />
150<br />
100<br />
50<br />
0<br />
Total CO 2 Emissions CO 2 Emissions By Type (2010) CO 2 per GDP & capita<br />
121.0 135.8<br />
203.4<br />
169.0<br />
243.3 263.5<br />
2000 2002 2004 2006 2008 2010<br />
Source: <strong>Clean</strong> <strong>Air</strong> <strong>Asia</strong> estimates, <strong>2012</strong> Source: <strong>Clean</strong> <strong>Air</strong> <strong>Asia</strong> estimates, <strong>2012</strong><br />
Source: <strong>Clean</strong> <strong>Air</strong> <strong>Asia</strong> estimates, <strong>2012</strong><br />
ROAD TRANSPORT: DRIVERS OF EMISSIONS<br />
vehicles (millions)<br />
140<br />
120<br />
100<br />
50%<br />
Vehicle Population and Motorization Index Fuel Consumption<br />
80<br />
60<br />
40<br />
20<br />
0<br />
Vehicle Population<br />
Motorization Index<br />
2000 2002 2004 2006 2008 2010<br />
100%<br />
80%<br />
60%<br />
40%<br />
20%<br />
0%<br />
Source: <strong>Clean</strong> <strong>Air</strong> <strong>Asia</strong> estimates, <strong>2012</strong><br />
VKT by Mode (2002-2010)<br />
2000 2010<br />
Source: <strong>Clean</strong> <strong>Air</strong> <strong>Asia</strong> estimates, <strong>2012</strong><br />
120<br />
100<br />
80<br />
60<br />
40<br />
20<br />
0<br />
2W<br />
3W<br />
PC<br />
MUV<br />
Bus<br />
LCV<br />
HCV<br />
9%<br />
9%<br />
vehicles per 1000<br />
people<br />
9%<br />
20%<br />
ktoe<br />
3%<br />
100000<br />
80000<br />
60000<br />
40000<br />
20000<br />
2W<br />
3W<br />
PC<br />
MUV<br />
BUS<br />
LCV<br />
HCV<br />
tonsCO 2 per capita<br />
0.25<br />
0.20<br />
0.15<br />
0.10<br />
0.05<br />
0.00<br />
2000 2004 2008<br />
CO2 emissions per capita<br />
CO2 emissions per GDP<br />
Emissions Profile: India<br />
<strong>Clean</strong> <strong>Air</strong> <strong>Asia</strong>. <strong>2012</strong>. Emissions Profile: India. Pasig City. Philippines.<br />
The Emissions Profile accompanies <strong>Accessing</strong> <strong>Asia</strong>: <strong>Air</strong> Pollution and Greenhouse Gas Emissions Indicators from Road Transport and Electricity.”<strong>Accessing</strong><strong>Asia</strong> presents the first<br />
benchmark of air pollutant (as particulate matter, PM) and GHG (as CO2) emissions for 13 countries across <strong>Asia</strong> for road transport and electricity.<br />
0<br />
2000 2002 2004 2006 2008 2010<br />
Source: <strong>Clean</strong> <strong>Air</strong> <strong>Asia</strong> estimates, <strong>2012</strong><br />
0.31<br />
0.30<br />
0.29<br />
0.28<br />
0.27<br />
0.26<br />
0.25<br />
0.24<br />
Gasoline<br />
Diesel<br />
LPG<br />
CNG<br />
Electric<br />
Emission Standards for New Light-Duty Vehicles<br />
Entire country Metros<br />
Euro 3 Euro 4<br />
Since 2010 Since 2010<br />
Current Sulfur levels in Diesel (ppm)<br />
Entire country Metros<br />
350 50<br />
Since 2010 Since 2010<br />
Source: <strong>Clean</strong> <strong>Air</strong> <strong>Asia</strong>.<br />
KgCO2 per US dollar at<br />
constant 2000 prices
ACCESSING ASIA<br />
<strong>Air</strong> Pollution and Greenhouse Gas Emissions from Road Transport and Electricity<br />
ELECTRICITY: CO 2 EMISSIONS<br />
CO 2 Emissions (from generation)<br />
per Source Type (2009)<br />
1.00<br />
0.80<br />
0.60<br />
0.40<br />
0.20<br />
0.00<br />
6%<br />
704<br />
million tons<br />
91%<br />
Coal Oil Natural Gas<br />
Source: <strong>Clean</strong> <strong>Air</strong> <strong>Asia</strong> estimates, <strong>2012</strong><br />
0.81 0.78<br />
Million Metric Tons<br />
1.00<br />
0.80<br />
0.60<br />
0.40<br />
0.20<br />
0.00<br />
1000<br />
800<br />
600<br />
400<br />
200<br />
0<br />
2000 2001 2002 2003 2004 2005 2006 2007 2008 2009<br />
Total CO2 from electricity generation<br />
Total CO2 from electricity consumption<br />
0.81 0.78<br />
ELECTRICITY: DRIVERS OF EMISSIONS<br />
TWh<br />
1000<br />
900<br />
800<br />
700<br />
600<br />
500<br />
400<br />
300<br />
200<br />
100<br />
0<br />
Total CO 2 emissions from generation and consumption<br />
kgCO2 per kWh TCO2 per capita<br />
kgCO2 per GDP<br />
<strong>Asia</strong> Average 2009: 0.50<br />
2000 2009<br />
<strong>Asia</strong> Average 2009: 0.83<br />
2000 2009<br />
Source: <strong>Clean</strong> <strong>Air</strong> <strong>Asia</strong> estimates, <strong>2012</strong><br />
Generation by<br />
Source Type (2009)<br />
NatGas<br />
NatGas<br />
12%<br />
12%<br />
Oil<br />
Oil<br />
3%<br />
3%<br />
Renewable<br />
Renewable<br />
14%<br />
14%<br />
Other<br />
Other<br />
3%<br />
3%<br />
Source: <strong>Clean</strong> <strong>Air</strong> <strong>Asia</strong> estimates, <strong>2012</strong><br />
Coal<br />
Coal<br />
68%<br />
68%<br />
1.00<br />
0.80<br />
0.60<br />
0.40<br />
0.20<br />
0.00<br />
Transport<br />
Transport<br />
2%<br />
2%<br />
<strong>Asia</strong> Average 2009: 0.90<br />
Other<br />
Other<br />
27%<br />
27%<br />
0.25<br />
0.39<br />
2000 2009<br />
Consumption by<br />
End-use Sector (2009)<br />
Residential<br />
Residential<br />
3%<br />
Commercia<br />
3%<br />
Commercia<br />
l<br />
11% 11%<br />
11%<br />
ELECTRICITY GENERATION<br />
ELECTRICITY CONSUMPTION<br />
Sources: Central Electricity Agency Electricity Yearbook 2011; Economic Survey 2010-2011; Energy Statistical Yearbooks 2006-201; Sewa Bhawan; & R.K. Puram. Ministry of Power (2008).<br />
CO2 Baseline Database for the Indian Power Sector User Guide Version 4.0 October 2008; The Energy Data Directory Yearbook 2010; World Bank; World Bank Development Indicators<br />
NOTES:<br />
2000 2001 2002 2003 2004 2005 2006 2007 2008 2009<br />
Emissions Profile: India<br />
<strong>Clean</strong> <strong>Air</strong> <strong>Asia</strong>. <strong>2012</strong>. Emissions Profile: India. Pasig City. Philippines.<br />
For more information about <strong>Clean</strong> <strong>Air</strong> <strong>Asia</strong>, please visit www.cleanairasia.org<br />
For the data found in this report, please visit www.CitiesACT.org<br />
903 TWh<br />
1. The boundaries, colors, denominations, and other information shown on any map in this report do not imply any judgment or endorsement on the part of <strong>Clean</strong> <strong>Air</strong> <strong>Asia</strong> concerning the delimination<br />
or legal status of any territory or boundaries. In no event will <strong>Clean</strong> <strong>Air</strong> <strong>Asia</strong> be liable for any form of damage arising from the application or misapplication of this report.<br />
2. Emissions from road transport sector were estimated using the Activity-Structure-Intensity-Fuel (ASIF) approach (adapted from Schipper and Marie 1999; Schipper, Gorham, and Marie, 2000). In this<br />
approach, road transport emissions are dependent on the level of transport activity (A); road transport mode structure (S); fuel intensity (I); and carbon content of fuel or emission factor (F).<br />
3. Vehicle population numbers were collected from the Ministry of Road Transport and Highways. VKT information were sourced from the SIAM statistics, India Planning Commission, and fleet records.<br />
4. Fuel consumption data presented in this profile is based on activity data.<br />
5. Data collected is from reported electricity generation and consumption.<br />
6. Electricity generation is from fossil fuels and hydropower. Geothermal power is not applicable. Combustible renewables, wind power, and solar power are assumed equal for a rough disaggregated<br />
estimate. Other sources include independent power producers and nuclear energy.<br />
7. Due to the lack of data, electricity consumption by end-use sector is considered to be under reported.<br />
8. Electricity consumption from other sectors includes agriculture, public water works, sewage pumping, and non-specified.<br />
Industrial<br />
Industrial<br />
57%<br />
57%<br />
571 TWh
ACCESSING ASIA<br />
<strong>Air</strong> Pollution and Greenhouse Gas Emissions from Road Transport and Electricity<br />
INDONESIA<br />
Republic of Indonesia<br />
million tons<br />
Jakarta<br />
Land area: 9569901 km 2<br />
Population: 240 million (2010)<br />
Urban population: 50%, 120 million (2010)<br />
Population with access to electricity: 65%, 153 million (2009)<br />
GDP (constant 2000 USD): 274 billion (2010)<br />
GDP per capita (constant 2000 USD): 1144 (2010)<br />
ROAD TRANSPORT: EMISSIONS PER VEHICLE TYPE<br />
120<br />
100<br />
80<br />
60<br />
40<br />
20<br />
0<br />
Total CO2 Emissions CO2 Emissions By Type (2010) CO2 per GDP & capita<br />
44.4 48.4<br />
79.8<br />
102.3<br />
90.6<br />
16% 2W<br />
0.50<br />
0.40<br />
0.40<br />
0.30<br />
61.5<br />
32%<br />
3W<br />
PC<br />
0.30<br />
0.20<br />
0.20<br />
2000 2002 2004 2006 2008 2010<br />
9%<br />
17%<br />
26%<br />
MUV<br />
BUS<br />
LCV<br />
HCV<br />
0.10<br />
0.00<br />
2000<br />
0.10<br />
0.00<br />
2004 2008<br />
CO2 emissions per capita<br />
CO2 emissions per GDP<br />
Source: <strong>Clean</strong> <strong>Air</strong> <strong>Asia</strong> estimates, <strong>2012</strong> Source: <strong>Clean</strong> <strong>Air</strong> <strong>Asia</strong> estimates, <strong>2012</strong><br />
Source: <strong>Clean</strong> <strong>Air</strong> <strong>Asia</strong> estimates, <strong>2012</strong><br />
ROAD TRANSPORT: DRIVERS OF EMISSIONS<br />
vehicles (millions)<br />
Vehicle Population and Motorization Index<br />
70<br />
Vehicle Population<br />
300<br />
60 Motorization Index<br />
250<br />
35000<br />
30000<br />
Fuel Consumption<br />
50<br />
200<br />
25000<br />
40<br />
30<br />
20<br />
10<br />
150<br />
100<br />
50<br />
20000<br />
15000<br />
10000<br />
0<br />
0<br />
5000<br />
2000 2002 2004 2006 2008 2010<br />
0<br />
2000 2002 2004 2006 2008 2010<br />
100%<br />
80%<br />
60%<br />
40%<br />
20%<br />
0%<br />
Source: <strong>Clean</strong> <strong>Air</strong> <strong>Asia</strong> estimates, <strong>2012</strong><br />
VKT by Mode (2002-2010)<br />
2000 2010<br />
Source: <strong>Clean</strong> <strong>Air</strong> <strong>Asia</strong> estimates, <strong>2012</strong><br />
2W<br />
3W<br />
PC<br />
MUV<br />
Bus<br />
LCV<br />
HCV<br />
vehicles per 1000<br />
people<br />
ktoe<br />
tonsCO 2 per capita<br />
Source: <strong>Clean</strong> <strong>Air</strong> <strong>Asia</strong> estimates, <strong>2012</strong><br />
Gasoline<br />
Diesel<br />
LPG<br />
CNG<br />
Electric<br />
Emission Standards for New Light-Duty Vehicles<br />
Euro 2<br />
Since 2005<br />
Current Sulfur levels in Diesel (ppm)<br />
Since 2010 350<br />
Source: <strong>Clean</strong> <strong>Air</strong> <strong>Asia</strong>.<br />
Emissions Profile: Indonesia<br />
<strong>Clean</strong> <strong>Air</strong> <strong>Asia</strong>. <strong>2012</strong>. Emissions Profile: P.R. China. Pasig City. Philippines.<br />
The Emissions Profile accompanies <strong>Accessing</strong> <strong>Asia</strong>: <strong>Air</strong> Pollution and Greenhouse Gas Emissions Indicators from Road Transport and Electricity.”<strong>Accessing</strong><strong>Asia</strong> presents the first<br />
benchmark of air pollutant (as particulate matter, PM) and GHG (as CO2) emissions for 13 countries across <strong>Asia</strong> for road transport and electricity.<br />
KgCO2 per US dollar at<br />
constant 2000 prices
ACCESSING ASIA<br />
<strong>Air</strong> Pollution and Greenhouse Gas Emissions from Road Transport and Electricity<br />
ELECTRICITY: CO 2 EMISSIONS<br />
CO 2 Emissions (from generation)<br />
per Source Type (2009)<br />
1.00<br />
0.80<br />
0.60<br />
0.40<br />
0.20<br />
0.00<br />
24%<br />
16%<br />
112<br />
million tons<br />
0.67<br />
0.72<br />
Million Metric Tons<br />
1.00<br />
0.80<br />
0.60<br />
0.40<br />
0.20<br />
0.00<br />
200<br />
150<br />
100<br />
50<br />
0<br />
2000 2001 2002 2003 2004 2005 2006 2007 2008 2009<br />
Total CO2 from electricity generation<br />
Total CO2 from electricity consumption<br />
0.67<br />
ELECTRICITY: DRIVERS OF EMISSIONS<br />
TWh<br />
180<br />
160<br />
140<br />
120<br />
100<br />
80<br />
60<br />
40<br />
20<br />
0<br />
NOTES:<br />
Total CO 2 emissions from generation and consumption<br />
kgCO2 per kWh TCO2 per capita<br />
kgCO2 per GDP<br />
2000 2009<br />
60%<br />
Coal Oil Natural Gas<br />
Source: <strong>Clean</strong> <strong>Air</strong> <strong>Asia</strong> estimates, <strong>2012</strong><br />
<strong>Asia</strong> Average 2009: 0.50<br />
2000 2001 2002 2003 2004 2005 2006 2007 2008 2009<br />
0.72<br />
2000 2009<br />
Source: <strong>Clean</strong> <strong>Air</strong> <strong>Asia</strong> estimates, <strong>2012</strong><br />
Source: <strong>Clean</strong> <strong>Air</strong> <strong>Asia</strong> estimates, <strong>2012</strong><br />
1.00<br />
<strong>Asia</strong> Average 2009: 0.83 <strong>Asia</strong> Average 2009: 0.90<br />
Generation by<br />
Source Type (2009)<br />
NatGas<br />
NatGas<br />
22%<br />
22%<br />
Other<br />
Other<br />
Renewable<br />
Renewable<br />
13% 13%<br />
13%<br />
0%<br />
0%<br />
Oil<br />
Oil<br />
23%<br />
23%<br />
Coal<br />
Coal<br />
42%<br />
42%<br />
0.80<br />
0.60<br />
0.40<br />
0.20<br />
0.00<br />
Industrial<br />
Industrial<br />
22%<br />
22%<br />
0.67<br />
0.72<br />
2000 2009<br />
Consumption by<br />
End-use Sector (2009)<br />
Transport<br />
Transport<br />
13%<br />
13%<br />
ELECTRICITY GENERATION<br />
ELECTRICITY CONSUMPTION<br />
Sources: Badan Pengkajian Dan Penerapan Teknolog Annual Reports 2006-2011; Statistical Yearbook of Indonesia 2003-2010;<br />
Kementerian Energi Dan Sumber Daya; World Bank Development Indicators<br />
Emissions Profile: Indonesia<br />
<strong>Clean</strong> <strong>Air</strong> <strong>Asia</strong>. <strong>2012</strong>. Emissions Profile: Indonesia. Pasig City. Philippines.<br />
For more information about <strong>Clean</strong> <strong>Air</strong> <strong>Asia</strong>, please visit www.cleanairasia.org<br />
For the data found in this report, please visit www.CitiesACT.org<br />
155 TWh<br />
Other Other<br />
Other<br />
0%<br />
0%<br />
Commercia Commercia<br />
Commercia<br />
l<br />
23%<br />
23%<br />
135 TWh<br />
1. The boundaries, colors, denominations, and other information shown on any map in this report do not imply any judgment or endorsement on the part of <strong>Clean</strong> <strong>Air</strong> <strong>Asia</strong> concerning the<br />
delimination or legal status of any territory or boundaries. In no event will <strong>Clean</strong> <strong>Air</strong> <strong>Asia</strong> be liable for any form of damage arising from the application or misapplication of this report.<br />
2. Emissions from road transport sector were estimated using the Activity-Structure-Intensity-Fuel (ASIF) approach (adapted from Schipper and Marie 1999; Schipper, Gorham, and Marie, 2000). In<br />
this approach, road transport emissions are dependent on the level of transport activity (A); road transport mode structure (S); fuel intensity (I); and carbon content of fuel or emission factor (F).<br />
3. Vehicle population numbers were estimated from State Traffic Pollice and GAIKINDO. VKT information were sourced from Suhadi, D. (2008) and Indonesia’s TNA on Climate Change.<br />
4. Fuel consumption data presented in this profile is based on activity data.<br />
5. Data collected is from reported electricity generation and consumption.<br />
6. Electricity generation is from fossil fuels, geothermal, and hydropower. Other renewable energy sources are still being explored.<br />
7. Electricity consumption from other sector is from public services.<br />
Residential<br />
Residential<br />
42%<br />
42%
ACCESSING ASIA<br />
<strong>Air</strong> Pollution and Greenhouse Gas Emissions from Road Transport and Electricity<br />
LAO PDR<br />
Lao People’s Democratic Republic<br />
million tons<br />
Vientiane<br />
Land area: 230800 km 2<br />
Population: 6 million (2010)<br />
Urban population: 33%, 2 million (2010)<br />
Population with access to electricity: 55%, 3 million (2009)<br />
GDP (constant 2000 USD): 3 billion (2010)<br />
GDP per capita (constant 2000 USD): 553 (2010)<br />
ROAD TRANSPORT: EMISSIONS PER VEHICLE TYPE<br />
1<br />
1<br />
1<br />
1<br />
1<br />
0<br />
0<br />
0<br />
Total CO2 Emissions CO2 Emissions By Type (2010) CO2 per GDP & capita<br />
0.25<br />
0.40<br />
1.3<br />
0.3<br />
0.4<br />
0.5<br />
0.7<br />
0.9<br />
2000 2002 2004 2006 2008 2010<br />
Source: <strong>Clean</strong> <strong>Air</strong> <strong>Asia</strong> estimates, <strong>2012</strong> Source: <strong>Clean</strong> <strong>Air</strong> <strong>Asia</strong> estimates, <strong>2012</strong><br />
Source: <strong>Clean</strong> <strong>Air</strong> <strong>Asia</strong> estimates, <strong>2012</strong><br />
ROAD TRANSPORT: DRIVERS OF EMISSIONS<br />
vehicles (millions)<br />
1.2<br />
1<br />
0.8<br />
0.6<br />
0.4<br />
0.2<br />
0<br />
36%<br />
7%<br />
1%<br />
13% 3%<br />
Vehicle Population and Motorization Index Fuel Consumption<br />
2000 2002 2004 2006 2008 2010<br />
100%<br />
80%<br />
60%<br />
40%<br />
20%<br />
0%<br />
Vehicle Population<br />
Motorization Index<br />
Source: <strong>Clean</strong> <strong>Air</strong> <strong>Asia</strong> estimates, <strong>2012</strong><br />
VKT by Mode (2002-2010)<br />
2000 2010<br />
Source: <strong>Clean</strong> <strong>Air</strong> <strong>Asia</strong> estimates, <strong>2012</strong><br />
200<br />
150<br />
100<br />
50<br />
0<br />
2W<br />
3W<br />
PC<br />
MUV<br />
Bus<br />
LCV<br />
HCV<br />
40%<br />
vehicles per 1000<br />
people<br />
ktoe<br />
450<br />
400<br />
350<br />
300<br />
250<br />
200<br />
150<br />
100<br />
50<br />
0<br />
2W<br />
3W<br />
PC<br />
MUV<br />
BUS<br />
LCV<br />
HCV<br />
tonsCO 2 per capita<br />
0.20<br />
0.15<br />
0.10<br />
0.05<br />
0.00<br />
2000 2004 2008<br />
CO2 emissions per capita<br />
CO2 emissions per GDP<br />
2000 2002 2004 2006 2008 2010<br />
Source: <strong>Clean</strong> <strong>Air</strong> <strong>Asia</strong> estimates, <strong>2012</strong><br />
0.30<br />
0.20<br />
0.10<br />
0.00<br />
Gasoline<br />
Diesel<br />
LPG<br />
CNG<br />
Electric<br />
Emission Standards for New Light-Duty Vehicles<br />
Not available<br />
Current Sulfur levels in Diesel (ppm)<br />
Not available<br />
Emissions Profile: Lao PDR<br />
<strong>Clean</strong> <strong>Air</strong> <strong>Asia</strong>. <strong>2012</strong>. Emissions Profile: Lao PDR. Pasig City. Philippines.<br />
The Emissions Profile accompanies <strong>Accessing</strong> <strong>Asia</strong>: <strong>Air</strong> Pollution and Greenhouse Gas Emissions Indicators from Road Transport and Electricity.”<strong>Accessing</strong><strong>Asia</strong> presents the first<br />
benchmark of air pollutant (as particulate matter, PM) and GHG (as CO2) emissions for 13 countries across <strong>Asia</strong> for road transport and electricity.<br />
KgCO2 per US dollar at<br />
constant 2000 prices
ACCESSING ASIA<br />
<strong>Air</strong> Pollution and Greenhouse Gas Emissions from Road Transport and Electricity<br />
ELECTRICITY: DRIVERS OF EMISSIONS<br />
TWh<br />
4<br />
3.5<br />
3<br />
2.5<br />
2<br />
1.5<br />
1<br />
0.5<br />
0<br />
NOTES:<br />
2000 2001 2002 2003 2004 2005 2006 2007 2008 2009<br />
ELECTRICITY GENERATION<br />
ELECTRICITY CONSUMPTION<br />
Generation by<br />
Source Type (2009)<br />
NatGas<br />
NatGas Other<br />
Other Coal<br />
Coal Oil<br />
Oil<br />
0%<br />
0%<br />
0%<br />
0%<br />
Renewable<br />
Renewable<br />
100%<br />
100%<br />
3 TWh<br />
Sources: Ministry of Energy and Mines – Department Of Electricity; World Bank Development Indicators.<br />
Consumption by<br />
End-use Sector (2009)<br />
Industrial<br />
Industrial<br />
34% 34%<br />
34%<br />
Transport<br />
Transport<br />
0% 0%<br />
0%<br />
Other<br />
Other<br />
8%<br />
8%<br />
Commercia Commercia<br />
Commercia<br />
l<br />
22%<br />
22%<br />
2 TWh<br />
1. The boundaries, colors, denominations, and other information shown on any map in this report do not imply any judgment or endorsement on the part of <strong>Clean</strong> <strong>Air</strong> <strong>Asia</strong> concerning the<br />
delimination or legal status of any territory or boundaries. In no event will <strong>Clean</strong> <strong>Air</strong> <strong>Asia</strong> be liable for any form of damage arising from the application or misapplication of this report.<br />
2. Emissions from road transport sector were estimated using the Activity-Structure-Intensity-Fuel (ASIF) approach (adapted from Schipper and Marie 1999; Schipper, Gorham, and Marie, 2000). In<br />
this approach, road transport emissions are dependent on the level of transport activity (A); road transport mode structure (S); fuel intensity (I); and carbon content of fuel or emission factor (F).<br />
3. Vehicle population numbers were estimated from Ministry of Communication, Transport, Post and Construction. VKT information were estimated from city data (Vientiane).<br />
4. Fuel consumption data presented in this profile is based on activity data.<br />
5. Data collected is from reported electricity generation and consumption.<br />
6. Electricity generation is exclusively from hydropower; Lao PDR was considered to have zero emissions.<br />
Emissions Profile: Lao PDR<br />
<strong>Clean</strong> <strong>Air</strong> <strong>Asia</strong>. <strong>2012</strong>. Emissions Profile: Lao PDR. Pasig City. Philippines.<br />
For more information about <strong>Clean</strong> <strong>Air</strong> <strong>Asia</strong>, please visit www.cleanairasia.org<br />
For the data found in this report, please visit www.CitiesACT.org<br />
Residential<br />
Residential<br />
36%<br />
36%
ACCESSING ASIA<br />
<strong>Air</strong> Pollution and Greenhouse Gas Emissions from Road Transport and Electricity<br />
MALAYSIA<br />
Federation of Malaysia<br />
million tons<br />
Kuala Lumpur<br />
Land area: 328657 km 2<br />
Population: 28 million (2010)<br />
Urban population: 73%, 21 million (2010)<br />
Population with access to electricity: 99%, 28 million (2009)<br />
GDP (constant 2000 USD): 147 billion (2010)<br />
GDP per capita (constant 2000 USD): 5212 (2010)<br />
ROAD TRANSPORT: EMISSIONS PER VEHICLE TYPE<br />
60<br />
50<br />
40<br />
30<br />
20<br />
10<br />
0<br />
Total CO 2 Emissions CO 2 Emissions By Type (2010) CO 2 per GDP & capita<br />
29.4<br />
32.8 36.7 41.1 45.8 50.3<br />
2000 2002 2004 2006 2008 2010<br />
Source: <strong>Clean</strong> <strong>Air</strong> <strong>Asia</strong> estimates, <strong>2012</strong> Source: <strong>Clean</strong> <strong>Air</strong> <strong>Asia</strong> estimates, <strong>2012</strong><br />
Source: <strong>Clean</strong> <strong>Air</strong> <strong>Asia</strong> estimates, <strong>2012</strong><br />
ROAD TRANSPORT: DRIVERS OF EMISSIONS<br />
vehicles (millions)<br />
25<br />
20<br />
15<br />
10<br />
5<br />
0<br />
24%<br />
24%<br />
3%<br />
Vehicle Population and Motorization Index Fuel Consumption<br />
2000 2002 2004 2006 2008 2010<br />
100%<br />
Vehicle Population<br />
Motorization Index<br />
80%<br />
60%<br />
40%<br />
20%<br />
0%<br />
Source: <strong>Clean</strong> <strong>Air</strong> <strong>Asia</strong> estimates, <strong>2012</strong><br />
VKT by Mode (2002-2010)<br />
2000 2010<br />
Source: <strong>Clean</strong> <strong>Air</strong> <strong>Asia</strong> estimates, <strong>2012</strong><br />
800<br />
700<br />
600<br />
500<br />
400<br />
300<br />
200<br />
100<br />
0<br />
2W<br />
3W<br />
PC<br />
MUV<br />
Bus<br />
LCV<br />
HCV<br />
1%<br />
vehicles per 1000<br />
people<br />
7%<br />
41%<br />
ktoe<br />
2W<br />
3W<br />
PC<br />
MUV<br />
BUS<br />
LCV<br />
HCV<br />
20000<br />
15000<br />
10000<br />
5000<br />
0<br />
tonsCO 2 per capita<br />
2.00<br />
1.50<br />
1.00<br />
0.50<br />
0.00<br />
0.35<br />
0.34<br />
0.33<br />
0.32<br />
0.31<br />
per US dollar at<br />
constant 2000 prices<br />
0.30<br />
0.29<br />
2000 2004 2008 KgCO2<br />
CO2 emissions per capita<br />
CO2 emissions per GDP<br />
2000 2002 2004 2006 2008 2010<br />
Source: <strong>Clean</strong> <strong>Air</strong> <strong>Asia</strong> estimates, <strong>2012</strong><br />
Gasoline<br />
Diesel<br />
LPG<br />
CNG<br />
Electric<br />
Emission Standards for New Light-Duty Vehicles<br />
Gasoline<br />
Euro 2<br />
Since 2009<br />
Current Sulfur levels in Diesel (ppm)<br />
Since 2009 500<br />
Source: <strong>Clean</strong> <strong>Air</strong> <strong>Asia</strong>.<br />
Emissions Profile: Malaysia<br />
<strong>Clean</strong> <strong>Air</strong> <strong>Asia</strong>. <strong>2012</strong>. Emissions Profile: Malaysia. Pasig City. Philippines.<br />
The Emissions Profile accompanies <strong>Accessing</strong> <strong>Asia</strong>: <strong>Air</strong> Pollution and Greenhouse Gas Emissions Indicators from Road Transport and Electricity.”<strong>Accessing</strong><strong>Asia</strong> presents the first<br />
benchmark of air pollutant (as particulate matter, PM) and GHG (as CO2) emissions for 13 countries across <strong>Asia</strong> for road transport and electricity.
ACCESSING ASIA<br />
<strong>Air</strong> Pollution and Greenhouse Gas Emissions from Road Transport and Electricity<br />
ELECTRICITY: CO 2 EMISSIONS<br />
CO 2 Emissions (from generation)<br />
per Source Type (2009)<br />
1.00<br />
0.80<br />
0.60<br />
0.40<br />
0.20<br />
0.00<br />
24%<br />
16%<br />
112<br />
million tons<br />
0.55<br />
0.64<br />
Million Metric Tons<br />
2.50<br />
2.00<br />
1.50<br />
1.00<br />
0.50<br />
0.00<br />
120<br />
100<br />
80<br />
60<br />
40<br />
20<br />
0<br />
2000 2001 2002 2003 2004 2005 2006 2007 2008 2009<br />
1.37<br />
ELECTRICITY: DRIVERS OF EMISSIONS<br />
TWh<br />
120<br />
100<br />
80<br />
60<br />
40<br />
20<br />
0<br />
NOTES:<br />
Total CO 2 emissions from generation and consumption<br />
Total CO2 from electricity generation Total CO2 from electricity consumption<br />
kgCO2 per kWh TCO2 per capita<br />
kgCO2 per GDP<br />
2000 2009<br />
60%<br />
Coal Oil Natural Gas<br />
Source: <strong>Clean</strong> <strong>Air</strong> <strong>Asia</strong> estimates, <strong>2012</strong><br />
<strong>Asia</strong> Average 2009: 0.50<br />
2000 2001 2002 2003 2004 2005 2006 2007 2008 2009<br />
ELECTRICITY GENERATION<br />
ELECTRICITY CONSUMPTION<br />
2.07<br />
<strong>Asia</strong> Average 2009: 0.83<br />
2000 2009<br />
Source: <strong>Clean</strong> <strong>Air</strong> <strong>Asia</strong> estimates, <strong>2012</strong><br />
Generation by<br />
Source Type (2009)<br />
NatGas<br />
NatGas<br />
60%<br />
60%<br />
Renewable<br />
Renewable Other<br />
Other<br />
7%<br />
7% 0%<br />
0%<br />
Source: <strong>Clean</strong> <strong>Air</strong> <strong>Asia</strong> estimates, <strong>2012</strong><br />
Coal<br />
Coal<br />
31%<br />
31%<br />
Oil<br />
Oil<br />
2%<br />
2%<br />
2.50<br />
2.00<br />
1.50<br />
1.00<br />
0.50<br />
0.00<br />
Sources: Malaysia Energy Information Hub Online Database; World Bank Development Indicators<br />
Emissions Profile: Malaysia<br />
<strong>Clean</strong> <strong>Air</strong> <strong>Asia</strong>. <strong>2012</strong>. Emissions Profile: Malaysia. Pasig City. Philippines.<br />
For more information about <strong>Clean</strong> <strong>Air</strong> <strong>Asia</strong>, please visit www.cleanairasia.org<br />
For the data found in this report, please visit www.CitiesACT.org<br />
105 TWh<br />
Industrial<br />
Industrial<br />
43%<br />
43%<br />
1.53<br />
2.08<br />
<strong>Asia</strong> Average 2009: 0.90<br />
2000 2009<br />
Consumption by<br />
End-use Sector (2009)<br />
Other Other<br />
Other<br />
2%<br />
2%<br />
Transport<br />
Transport<br />
0%<br />
0%<br />
Residential<br />
Residential<br />
21%<br />
21%<br />
91 TWh<br />
Commercia<br />
Commercia<br />
l<br />
34%<br />
34%<br />
1. The boundaries, colors, denominations, and other information shown on any map in this report do not imply any judgment or endorsement on the part of <strong>Clean</strong> <strong>Air</strong> <strong>Asia</strong> concerning the<br />
delimination or legal status of any territory or boundaries. In no event will <strong>Clean</strong> <strong>Air</strong> <strong>Asia</strong> be liable for any form of damage arising from the application or misapplication of this report.<br />
2. Emissions from road transport sector were estimated using the Activity-Structure-Intensity-Fuel (ASIF) approach (adapted from Schipper and Marie 1999; Schipper, Gorham, and Marie, 2000). In<br />
this approach, road transport emissions are dependent on the level of transport activity (A); road transport mode structure (S); fuel intensity (I); and carbon content of fuel or emission factor (F).<br />
3. Vehicle population numbers were estimated from Road Transport Department, Ministry of Transport. VKT information were estimated from various studies.<br />
4. Fuel consumption data presented in this profile is based on activity data.<br />
5. Data collected is from reported electricity generation and consumption.<br />
6. Electricity generation is from fossil fuels and hydropower. Geothermal and wind power are not applicable. Combustible renewables (as biooil) and solar power are considered to be equal for a<br />
rough disaggregation.<br />
7. Electricity consumption from other sectors includes public lighting, mining, agriculture, and miscellaneous.
ACCESSING ASIA<br />
<strong>Air</strong> Pollution and Greenhouse Gas Emissions from Road Transport and Electricity<br />
NEPAL<br />
Federal Democratic Democratic Republic of Nepal<br />
million tons<br />
Kathmandu<br />
Land area: 143351 km 2<br />
Population: 30 million (2010)<br />
Urban population: 17%, 5 million (2010)<br />
Population with access to electricity: 44%, 13 million (2009)<br />
GDP (constant 2000 USD): 16 billion (2010)<br />
GDP per capita (constant 2000 USD): 524 (2010)<br />
ROAD TRANSPORT: EMISSIONS PER VEHICLE TYPE<br />
4<br />
3<br />
3<br />
2<br />
2<br />
1<br />
1<br />
0<br />
Total CO 2 Emissions CO 2 Emissions By Type (2010) CO 2 per GDP & capita<br />
1.3<br />
1.5<br />
1.7<br />
2.0<br />
2.4<br />
3.0<br />
2000 2002 2004 2006 2008 2010<br />
Source: <strong>Clean</strong> <strong>Air</strong> <strong>Asia</strong> estimates, <strong>2012</strong> Source: <strong>Clean</strong> <strong>Air</strong> <strong>Asia</strong> estimates, <strong>2012</strong><br />
Source: <strong>Clean</strong> <strong>Air</strong> <strong>Asia</strong> estimates, <strong>2012</strong><br />
ROAD TRANSPORT: DRIVERS OF EMISSIONS<br />
vehicles (millions)<br />
1.2<br />
1<br />
0.8<br />
0.6<br />
0.4<br />
0.2<br />
0<br />
50%<br />
8% 1%<br />
Vehicle Population and Motorization Index Fuel Consumption<br />
Vehicle Population<br />
Motorization Index<br />
2000 2002 2004 2006 2008 2010<br />
100%<br />
80%<br />
60%<br />
40%<br />
20%<br />
0%<br />
Source: <strong>Clean</strong> <strong>Air</strong> <strong>Asia</strong> estimates, <strong>2012</strong><br />
VKT by Mode (2002-2010)<br />
2000 2010<br />
Source: <strong>Clean</strong> <strong>Air</strong> <strong>Asia</strong> estimates, <strong>2012</strong><br />
40<br />
35<br />
30<br />
25<br />
20<br />
15<br />
10<br />
5<br />
0<br />
2W<br />
3W<br />
PC<br />
MUV<br />
Bus<br />
LCV<br />
HCV<br />
vehicles per 1000<br />
people<br />
1%<br />
14%<br />
22%<br />
ktoe<br />
4%<br />
1000<br />
800<br />
600<br />
400<br />
200<br />
0<br />
2W<br />
3W<br />
PC<br />
MUV<br />
BUS<br />
LCV<br />
HCV<br />
tonsCO 2 per capita<br />
0.12<br />
0.10<br />
0.08<br />
0.06<br />
0.04<br />
0.02<br />
0.00<br />
2000 2004 2008<br />
CO2 emissions per capita<br />
CO2 emissions per GDP<br />
2000 2002 2004 2006 2008 2010<br />
Source: <strong>Clean</strong> <strong>Air</strong> <strong>Asia</strong> estimates, <strong>2012</strong><br />
0.30<br />
0.25<br />
0.20<br />
0.15<br />
0.10<br />
0.05<br />
0.00<br />
Gasoline<br />
Diesel<br />
LPG<br />
CNG<br />
Electric<br />
Emission Standards for New Light-Duty Vehicles<br />
Euro 3<br />
Since <strong>2012</strong><br />
Current Sulfur levels in Diesel (ppm)<br />
Not available<br />
Source: <strong>Clean</strong> <strong>Air</strong> <strong>Asia</strong>.<br />
Emissions Profile: Nepal<br />
<strong>Clean</strong> <strong>Air</strong> <strong>Asia</strong>. <strong>2012</strong>. Emissions Profile: Nepal. Pasig City. Philippines.<br />
The Emissions Profile accompanies <strong>Accessing</strong> <strong>Asia</strong>: <strong>Air</strong> Pollution and Greenhouse Gas Emissions Indicators from Road Transport and Electricity.”<strong>Accessing</strong><strong>Asia</strong> presents the first<br />
benchmark of air pollutant (as particulate matter, PM) and GHG (as CO2) emissions for 13 countries across <strong>Asia</strong> for road transport and electricity.<br />
Kg CO2 per US dollar at<br />
constant 2000 prices
ACCESSING ASIA<br />
<strong>Air</strong> Pollution and Greenhouse Gas Emissions from Road Transport and Electricity<br />
ELECTRICITY: CO 2 EMISSIONS<br />
CO 2 Emissions (from generation)<br />
per Source Type (2009)<br />
1.00<br />
0.80<br />
0.60<br />
0.40<br />
0.20<br />
0.00<br />
0.01<br />
million tons<br />
100%<br />
Coal Oil Natural Gas<br />
Source: <strong>Clean</strong> <strong>Air</strong> <strong>Asia</strong> estimates, <strong>2012</strong><br />
0.01 0.00<br />
Million Metric Tons<br />
1.00<br />
0.80<br />
0.60<br />
0.40<br />
0.20<br />
0.00<br />
40<br />
30<br />
20<br />
10<br />
0<br />
2000 2001 2002 2003 2004 2005 2006 2007 2008 2009<br />
Total CO2 from electricity generation<br />
Total CO2 from electricity consumption<br />
0.00 0.00<br />
ELECTRICITY: DRIVERS OF EMISSIONS<br />
TWh<br />
3.5<br />
3<br />
2.5<br />
2<br />
1.5<br />
1<br />
0.5<br />
0<br />
NOTES:<br />
Total CO 2 emissions from generation and consumption<br />
kgCO2 per kWh TCO2 per capita<br />
kgCO2 per GDP<br />
<strong>Asia</strong> Average 2009: 0.50<br />
2000 2009<br />
2000 2001 2002 2003 2004 2005 2006 2007 2008 2009<br />
2000 2009<br />
Source: <strong>Clean</strong> <strong>Air</strong> <strong>Asia</strong> estimates, <strong>2012</strong><br />
Emissions Profile: Nepal<br />
<strong>Clean</strong> <strong>Air</strong> <strong>Asia</strong>. <strong>2012</strong>. Emissions Profile: Nepal. Pasig City. Philippines.<br />
For more information about <strong>Clean</strong> <strong>Air</strong> <strong>Asia</strong>, please visit www.cleanairasia.org<br />
For the data found in this report, please visit www.CitiesACT.org<br />
Source: <strong>Clean</strong> <strong>Air</strong> <strong>Asia</strong> estimates, <strong>2012</strong><br />
1.00<br />
<strong>Asia</strong> Average 2009: 0.83 <strong>Asia</strong> Average 2009: 0.90<br />
Generation by<br />
Source Type (2009)<br />
NatGas<br />
NatGas Other<br />
Other Coal<br />
Coal Oil<br />
Oil<br />
0%<br />
0%<br />
0%<br />
0%<br />
0%<br />
0%<br />
Renewable<br />
Renewable<br />
100%<br />
100%<br />
3 TWh<br />
0.80<br />
0.60<br />
0.40<br />
0.20<br />
0.00<br />
Transport<br />
Transport<br />
0%<br />
0%<br />
Industrial<br />
Industrial<br />
39% 39%<br />
39%<br />
0.00 0.00<br />
ELECTRICITY GENERATION<br />
ELECTRICITY CONSUMPTION<br />
Sources: Nepal Electricity Authority; Central Bureau of Statistics Statistical Yearbook 2009; National Energy Agency (2007-2010),<br />
National Energy Agency Annual Reports 2007-2010; World Bank Development Indicators<br />
2000 2009<br />
Consumption by<br />
End-use Sector (2009)<br />
Other<br />
Other<br />
12%<br />
12%<br />
Commercia<br />
Commercia<br />
l<br />
7%<br />
7%<br />
2 TWh<br />
1. The boundaries, colors, denominations, and other information shown on any map in this report do not imply any judgment or endorsement on the part of <strong>Clean</strong> <strong>Air</strong> <strong>Asia</strong> concerning the<br />
delimination or legal status of any territory or boundaries. In no event will <strong>Clean</strong> <strong>Air</strong> <strong>Asia</strong> be liable for any form of damage arising from the application or misapplication of this report.<br />
2. Emissions from road transport sector were estimated using the Activity-Structure-Intensity-Fuel (ASIF) approach (adapted from Schipper and Marie 1999; Schipper, Gorham, and Marie, 2000). In<br />
this approach, road transport emissions are dependent on the level of transport activity (A); road transport mode structure (S); fuel intensity (I); and carbon content of fuel or emission factor (F).<br />
3. Vehicle population numbers were collected from the Department of Transport Management. VKT information were sourced from Dhakal, (2003).<br />
4. Fuel consumption data presented in this profile is based on activity data.<br />
5. Data collected is from reported electricity generation and consumption.<br />
6. Electricity generation is exclusively from oil and hydropower.<br />
7. Due to the lack of data, electricity consumption by end-use sector is considered to be under reported.<br />
8. Electricity consumption from other sectors includes water supply & irrigation, non-commercial, street light, temporary supply, temple, community sales and exported supply.<br />
Residential<br />
Residential<br />
42%<br />
42%
ACCESSING ASIA<br />
<strong>Air</strong> Pollution and Greenhouse Gas Emissions from Road Transport and Electricity<br />
PAKISTAN<br />
Islamic Republic of Pakistan<br />
million tons<br />
Islamabad<br />
Land area: 770875 km 2<br />
Population: 174 million (2010)<br />
Urban population: 36%, 62 million (2010)<br />
Population with access to electricity: 62%, 106 million (2009)<br />
GDP (constant 2000 USD): 116 billion (2010)<br />
GDP per capita (constant 2000 USD): 670 (2010)<br />
ROAD TRANSPORT: EMISSIONS PER VEHICLE TYPE<br />
40<br />
35<br />
30<br />
25<br />
20<br />
15<br />
10<br />
5<br />
0<br />
Total CO2 Emissions<br />
24.0<br />
20.2<br />
CO2 Emissions By Type (2010) CO2 per GDP & capita<br />
26.0<br />
34.7<br />
31.5<br />
29.5<br />
5% 1%<br />
2W<br />
3W<br />
23% 13%<br />
PC<br />
0.25<br />
0.20<br />
0.15<br />
0.10<br />
0.32<br />
0.31<br />
0.30<br />
0.29<br />
0.28<br />
6%<br />
14% 38%<br />
MUV<br />
BUS<br />
LCV<br />
0.05<br />
0.00<br />
2000 2004 2008<br />
0.27<br />
0.26<br />
0.25<br />
2000 2002 2004 2006 2008 2010<br />
HCV<br />
CO2 emissions per capita<br />
CO2 emissions per GDP<br />
Source: <strong>Clean</strong> <strong>Air</strong> <strong>Asia</strong> estimates, <strong>2012</strong> Source: <strong>Clean</strong> <strong>Air</strong> <strong>Asia</strong> estimates, <strong>2012</strong><br />
Source: <strong>Clean</strong> <strong>Air</strong> <strong>Asia</strong> estimates, <strong>2012</strong><br />
ROAD TRANSPORT: DRIVERS OF EMISSIONS<br />
vehicles (millions)<br />
12<br />
10<br />
8<br />
6<br />
4<br />
2<br />
0<br />
Vehicle Population and Motorization Index Fuel Consumption<br />
Vehicle Population<br />
Motorization Index<br />
2000 2002 2004 2006 2008 2010<br />
100%<br />
80%<br />
60%<br />
40%<br />
20%<br />
0%<br />
Source: <strong>Clean</strong> <strong>Air</strong> <strong>Asia</strong> estimates, <strong>2012</strong><br />
VKT by Mode (2002-2010)<br />
2000 2010<br />
Source: <strong>Clean</strong> <strong>Air</strong> <strong>Asia</strong> estimates, <strong>2012</strong><br />
60<br />
50<br />
40<br />
30<br />
20<br />
10<br />
0<br />
2W<br />
3W<br />
PC<br />
MUV<br />
Bus<br />
LCV<br />
HCV<br />
vehicles per 1000<br />
people<br />
ktoe<br />
12000<br />
10000<br />
8000<br />
6000<br />
4000<br />
2000<br />
0<br />
tonsCO 2 per capita<br />
2000 2002 2004 2006 2008 2010<br />
Source: <strong>Clean</strong> <strong>Air</strong> <strong>Asia</strong> estimates, <strong>2012</strong><br />
Gasoline<br />
Diesel<br />
LPG<br />
CNG<br />
Electric<br />
Emission Standards for New Light-Duty Vehicles<br />
Euro 2<br />
Since 2005<br />
Current Sulfur levels in Diesel (ppm)<br />
(marketed)<br />
Since 2010 7000<br />
Source: <strong>Clean</strong> <strong>Air</strong> <strong>Asia</strong>.<br />
Emissions Profile: Pakistan<br />
<strong>Clean</strong> <strong>Air</strong> <strong>Asia</strong>. <strong>2012</strong>. Emissions Profile: Pakistan. Pasig City. Philippines.<br />
The Emissions Profile accompanies <strong>Accessing</strong> <strong>Asia</strong>: <strong>Air</strong> Pollution and Greenhouse Gas Emissions Indicators from Road Transport and Electricity.”<strong>Accessing</strong><strong>Asia</strong> presents the first<br />
benchmark of air pollutant (as particulate matter, PM) and GHG (as CO2) emissions for 13 countries across <strong>Asia</strong> for road transport and electricity.<br />
KgCO2 per US dollar at<br />
constant 2000 prices
ACCESSING ASIA<br />
<strong>Air</strong> Pollution and Greenhouse Gas Emissions from Road Transport and Electricity<br />
ELECTRICITY: CO 2 EMISSIONS<br />
CO 2 Emissions (from generation)<br />
per Source Type (2009)<br />
1.00<br />
0.80<br />
0.60<br />
0.40<br />
0.20<br />
0.00<br />
38%<br />
48<br />
million tons<br />
0.53 0.50<br />
Million Metric Tons<br />
1.00<br />
0.80<br />
0.60<br />
0.40<br />
0.20<br />
0.00<br />
120<br />
100<br />
80<br />
60<br />
40<br />
20<br />
0<br />
2000 2001 2002 2003 2004 2005 2006 2007 2008 2009<br />
Total CO2 from electricity generation<br />
Total CO2 from electricity consumption<br />
0.18 0.16<br />
ELECTRICITY: DRIVERS OF EMISSIONS<br />
TWh<br />
120<br />
100<br />
80<br />
60<br />
40<br />
20<br />
0<br />
NOTES:<br />
Total CO 2 emissions from generation and consumption<br />
kgCO2 per kWh TCO2 per capita<br />
kgCO2 per GDP<br />
2000 2009<br />
62%<br />
Coal Oil Natural Gas<br />
Source: <strong>Clean</strong> <strong>Air</strong> <strong>Asia</strong> estimates, <strong>2012</strong><br />
<strong>Asia</strong> Average 2009: 0.50<br />
2000 2001 2002 2003 2004 2005 2006 2007 2008 2009<br />
2000 2009<br />
Source: <strong>Clean</strong> <strong>Air</strong> <strong>Asia</strong> estimates, <strong>2012</strong><br />
Source: <strong>Clean</strong> <strong>Air</strong> <strong>Asia</strong> estimates, <strong>2012</strong><br />
1.00<br />
<strong>Asia</strong> Average 2009: 0.83 <strong>Asia</strong> Average 2009: 0.90<br />
Generation by<br />
Source Type (2009)<br />
Renewable<br />
Renewable<br />
0%<br />
0%<br />
NatGas<br />
NatGas<br />
27%<br />
27%<br />
Other<br />
Other<br />
20%<br />
20%<br />
Oil<br />
Oil<br />
8% 8%<br />
8%<br />
0.80<br />
0.60<br />
0.40<br />
0.20<br />
0.00<br />
Coal<br />
Coal<br />
45%<br />
45%<br />
Transport<br />
Transport<br />
0%<br />
0%<br />
ELECTRICITY GENERATION<br />
ELECTRICITY CONSUMPTION<br />
Sources: Pakistan Economic Survey 2010-2011; National Electric Power Regulatory Authority State of Industry;<br />
Water and Power Development Authority Power Statistics 2010; World Bank Development Indicators<br />
Emissions Profile: Pakistan<br />
<strong>Clean</strong> <strong>Air</strong> <strong>Asia</strong>. <strong>2012</strong>. Emissions Profile: Pakistan. Pasig City. Philippines.<br />
For more information about <strong>Clean</strong> <strong>Air</strong> <strong>Asia</strong>, please visit www.cleanairasia.org<br />
For the data found in this report, please visit www.CitiesACT.org<br />
96 TWh<br />
Other<br />
Other<br />
20%<br />
20%<br />
Industrial<br />
Industrial<br />
27%<br />
27%<br />
0.53 0.50<br />
2000 2009<br />
Consumption by<br />
End-use Sector (2009)<br />
Commercia<br />
Commercia<br />
l<br />
8%<br />
8%<br />
55 TWh<br />
1. The boundaries, colors, denominations, and other information shown on any map in this report do not imply any judgment or endorsement on the part of <strong>Clean</strong> <strong>Air</strong> <strong>Asia</strong> concerning the<br />
delimination or legal status of any territory or boundaries. In no event will <strong>Clean</strong> <strong>Air</strong> <strong>Asia</strong> be liable for any form of damage arising from the application or misapplication of this report.<br />
2. Emissions from road transport sector were estimated using the Activity-Structure-Intensity-Fuel (ASIF) approach (adapted from Schipper and Marie 1999; Schipper, Gorham, and Marie, 2000). In<br />
this approach, road transport emissions are dependent on the level of transport activity (A); road transport mode structure (S); fuel intensity (I); and carbon content of fuel or emission factor (F).<br />
3. Vehicle population numbers were estimated from Pakistan Economic Surveys. VKT information were estimated from IRG, (2010).<br />
4. Fuel consumption data presented in this profile is based on activity data.<br />
5. Data collected is from reported electricity generation and consumption.<br />
6. Electricity generation is from fossil fuels and hydropower. The other source is nuclear energy.<br />
7. Electricity consumption from other sectors includes agriculture, street lights, and government use.<br />
Residential<br />
Residential<br />
45%<br />
45%
ACCESSING ASIA<br />
<strong>Air</strong> Pollution and Greenhouse Gas Emissions from Road Transport and Electricity<br />
PHILIPPINES<br />
Republic of the Philippines<br />
million tons<br />
Beijing<br />
Land area: 298170 km 2<br />
Population: 93 million (2010)<br />
Urban population: 66%, 62 million (2010)<br />
Population with access to electricity: 90%, 83 million (2009)<br />
GDP (constant 2000 USD): 118 billion (2010)<br />
GDP per capita (constant 2000 USD): 1258 (2010)<br />
ROAD TRANSPORT: EMISSIONS PER VEHICLE TYPE<br />
60<br />
50<br />
40<br />
30<br />
20<br />
10<br />
0<br />
Total CO 2 Emissions CO 2 Emissions By Type (2010) CO 2 per GDP & capita<br />
36.2 39.4 41.9 43.1 44.2 47.9<br />
2000 2002 2004 2006 2008 2010<br />
Source: <strong>Clean</strong> <strong>Air</strong> <strong>Asia</strong> estimates, <strong>2012</strong> Source: <strong>Clean</strong> <strong>Air</strong> <strong>Asia</strong> estimates, <strong>2012</strong><br />
Source: <strong>Clean</strong> <strong>Air</strong> <strong>Asia</strong> estimates, <strong>2012</strong><br />
ROAD TRANSPORT: DRIVERS OF EMISSIONS<br />
vehicles (millions)<br />
7<br />
6<br />
5<br />
4<br />
3<br />
2<br />
1<br />
0<br />
33%<br />
26%<br />
Vehicle Population and Motorization Index Fuel Consumption<br />
2000 2002 2004 2006 2008 2010<br />
100%<br />
Vehicle Population<br />
Motorization Index<br />
80%<br />
60%<br />
40%<br />
20%<br />
0%<br />
Source: <strong>Clean</strong> <strong>Air</strong> <strong>Asia</strong> estimates, <strong>2012</strong><br />
VKT by Mode (2002-2010)<br />
2000 2010<br />
Source: <strong>Clean</strong> <strong>Air</strong> <strong>Asia</strong> estimates, <strong>2012</strong><br />
80<br />
60<br />
40<br />
20<br />
0<br />
2W<br />
3W<br />
PC<br />
MUV<br />
Bus<br />
LCV<br />
HCV<br />
1%<br />
10%<br />
vehicles per 1000<br />
people<br />
23%<br />
2%<br />
5%<br />
ktoe<br />
2W<br />
3W<br />
PC<br />
MUV<br />
BUS<br />
LCV<br />
HCV<br />
16000<br />
14000<br />
12000<br />
10000<br />
8000<br />
6000<br />
4000<br />
2000<br />
0<br />
tonsCO 2 per capita<br />
0.60<br />
0.50<br />
0.40<br />
0.30<br />
0.20<br />
0.10<br />
0.00<br />
2000 2004 2008<br />
CO2 emissions per capita<br />
CO2 emissions per GDP<br />
2000 2002 2004 2006 2008 2010<br />
Source: <strong>Clean</strong> <strong>Air</strong> <strong>Asia</strong> estimates, <strong>2012</strong><br />
0.44<br />
0.42<br />
0.40<br />
0.38<br />
0.36<br />
0.34<br />
0.32<br />
Gasoline<br />
Diesel<br />
LPG<br />
CNG<br />
Electric<br />
Emission Standards for New Light-Duty Vehicles<br />
Euro 2<br />
Since 2007<br />
Current Sulfur levels in Diesel (ppm)<br />
Since 2004 500<br />
Source: <strong>Clean</strong> <strong>Air</strong> <strong>Asia</strong>.<br />
Emissions Profile: Philippines<br />
<strong>Clean</strong> <strong>Air</strong> <strong>Asia</strong>. <strong>2012</strong>. Emissions Profile: Philippines. Pasig City. Philippines.<br />
The Emissions Profile accompanies <strong>Accessing</strong> <strong>Asia</strong>: <strong>Air</strong> Pollution and Greenhouse Gas Emissions Indicators from Road Transport and Electricity.”<strong>Accessing</strong><strong>Asia</strong> presents the first<br />
benchmark of air pollutant (as particulate matter, PM) and GHG (as CO2) emissions for 13 countries across <strong>Asia</strong> for road transport and electricity.<br />
KgCO2 per US dollar at<br />
constant 2000 prices
ACCESSING ASIA<br />
<strong>Air</strong> Pollution and Greenhouse Gas Emissions from Road Transport and Electricity<br />
ELECTRICITY: CO 2 EMISSIONS<br />
CO 2 Emissions (from generation)<br />
per Source Type (2009)<br />
1.00<br />
0.80<br />
0.60<br />
0.40<br />
0.20<br />
0.00<br />
30%<br />
26<br />
million tons<br />
55%<br />
15%<br />
Coal Oil Natural Gas<br />
Source: <strong>Clean</strong> <strong>Air</strong> <strong>Asia</strong> estimates, <strong>2012</strong><br />
0.47<br />
0.42<br />
Million Metric Tons<br />
1.00<br />
0.80<br />
0.60<br />
0.40<br />
0.20<br />
0.00<br />
70<br />
60<br />
50<br />
40<br />
30<br />
20<br />
10<br />
0<br />
2000 2001 2002 2003 2004 2005 2006 2007 2008 2009<br />
Total CO2 from electricity generation<br />
Total CO2 from electricity consumption<br />
0.22 0.23<br />
ELECTRICITY: DRIVERS OF EMISSIONS<br />
TWh<br />
70<br />
60<br />
50<br />
40<br />
30<br />
20<br />
10<br />
0<br />
NOTES:<br />
Total CO 2 emissions from generation and consumption<br />
kgCO2 per kWh TCO2 per capita<br />
kgCO2 per GDP<br />
<strong>Asia</strong> Average 2009: 0.50<br />
2000 2009<br />
2000 2001 2002 2003 2004 2005 2006 2007 2008 2009<br />
ELECTRICITY GENERATION<br />
ELECTRICITY CONSUMPTION<br />
2000 2009<br />
Source: <strong>Clean</strong> <strong>Air</strong> <strong>Asia</strong> estimates, <strong>2012</strong><br />
Source: <strong>Clean</strong> <strong>Air</strong> <strong>Asia</strong> estimates, <strong>2012</strong><br />
1.00<br />
<strong>Asia</strong> Average 2009: 0.83 <strong>Asia</strong> Average 2009: 0.90<br />
Generation by<br />
Source Type (2009)<br />
Renewable<br />
Renewable<br />
32%<br />
32%<br />
Other<br />
Other<br />
0%<br />
0%<br />
NatGas<br />
NatGas<br />
32%<br />
32%<br />
Coal<br />
Coal<br />
27%<br />
27%<br />
Oil<br />
Oil<br />
9%<br />
9%<br />
0.80<br />
0.60<br />
0.40<br />
0.20<br />
0.00<br />
Industrial<br />
Industrial<br />
34%<br />
34%<br />
0.30 0.27<br />
2000 2009<br />
Consumption by<br />
End-use Sector (2009)<br />
Other Other<br />
Other<br />
3% 3%<br />
3%<br />
Transport Transport<br />
Transport<br />
0%<br />
0%<br />
Commercia<br />
Commercia<br />
l<br />
29%<br />
29%<br />
Sources: National Energy Plan Statistics 2004; Power Statistics 1983-2011; LRTA Electricity consumption for 2007-2011; World Bank Development Indicators<br />
Emissions Profile: Philippines<br />
<strong>Clean</strong> <strong>Air</strong> <strong>Asia</strong>. <strong>2012</strong>. Emissions Profile: Philippines. Pasig City. Philippines.<br />
For more information about <strong>Clean</strong> <strong>Air</strong> <strong>Asia</strong>, please visit www.cleanairasia.org<br />
For the data found in this report, please visit www.CitiesACT.org<br />
62 TWh<br />
51 TWh<br />
1. The boundaries, colors, denominations, and other information shown on any map in this report do not imply any judgment or endorsement on the part of <strong>Clean</strong> <strong>Air</strong> <strong>Asia</strong> concerning the<br />
delimination or legal status of any territory or boundaries. In no event will <strong>Clean</strong> <strong>Air</strong> <strong>Asia</strong> be liable for any form of damage arising from the application or misapplication of this report.<br />
2. Emissions from road transport sector were estimated using the Activity-Structure-Intensity-Fuel (ASIF) approach (adapted from Schipper and Marie 1999; Schipper, Gorham, and Marie, 2000). In<br />
this approach, road transport emissions are dependent on the level of transport activity (A); road transport mode structure (S); fuel intensity (I); and carbon content of fuel or emission factor (F).<br />
3. Vehicle population numbers were collected from the Land Transportation Office. VKT information were estimated from various studies.<br />
4. Fuel consumption data presented in this profile is based on activity data.<br />
5. Data collected is from reported electricity generation and consumption.<br />
6. Electricity generation is from fossil fuels, geothermal, and hydropower. Combustible renewables, wind power, and solar power are assumed equal for a rough disaggregation.<br />
7. Electricity consumption from other sectors includes public services, agriculture, and non-specified electricity usage. Limited data was found for transport.<br />
Residential<br />
Residential<br />
34%<br />
34%
ACCESSING ASIA<br />
<strong>Air</strong> Pollution and Greenhouse Gas Emissions from Road Transport and Electricity<br />
PR CHINA<br />
People’s Republic of China<br />
million tons<br />
Beijing<br />
Land area: 9569901 km 2<br />
Population: 1338 million (2010)<br />
Urban population: 45%, 601 million (2010)<br />
Population with access to electricity: 99%, 1323 million (2009)<br />
GDP (constant 2000 USD): 3244 billion (2010)<br />
GDP per capita (constant 2000 USD): 2424 (2010)<br />
ROAD TRANSPORT: EMISSIONS PER VEHICLE TYPE<br />
Total CO2 Emissions<br />
243.1<br />
CO2 Emissions By Type (2010) CO2 per GDP & capita<br />
285.9<br />
700<br />
600<br />
500<br />
400<br />
300<br />
200<br />
657.7<br />
426.0<br />
349.6<br />
9%<br />
2W<br />
3W<br />
28%<br />
PC<br />
30% MUV<br />
0.6<br />
0.25<br />
0.5<br />
0.2<br />
0.4<br />
0.15<br />
0.3<br />
0.1<br />
0.2<br />
0.1<br />
0.05<br />
100<br />
BUS<br />
0<br />
0<br />
0<br />
29%<br />
LCV<br />
2000 2004 2008<br />
2000 2002 2004 2006 2008 2010<br />
3%<br />
1% HCV<br />
CO2 emissions per capita<br />
CO2 emissions per GDP<br />
Source: <strong>Clean</strong> <strong>Air</strong> <strong>Asia</strong> estimates, <strong>2012</strong> Source: <strong>Clean</strong> <strong>Air</strong> <strong>Asia</strong> estimates, <strong>2012</strong><br />
Source: <strong>Clean</strong> <strong>Air</strong> <strong>Asia</strong> estimates, <strong>2012</strong><br />
ROAD TRANSPORT: DRIVERS OF EMISSIONS<br />
vehicles (millions)<br />
200<br />
150<br />
100<br />
50<br />
0<br />
Vehicle Population and Motorization Index Fuel Consumption<br />
2000 2002 2004 2006 2008 2010<br />
100%<br />
Vehicle Population<br />
Motorization Index<br />
80%<br />
60%<br />
40%<br />
20%<br />
0%<br />
Source: <strong>Clean</strong> <strong>Air</strong> <strong>Asia</strong> estimates, <strong>2012</strong><br />
VKT by Mode (2002-2010)<br />
2000 2010<br />
Source: <strong>Clean</strong> <strong>Air</strong> <strong>Asia</strong> estimates, <strong>2012</strong><br />
140<br />
120<br />
100<br />
80<br />
60<br />
40<br />
20<br />
0<br />
2W<br />
3W<br />
PC<br />
MUV<br />
Bus<br />
LCV<br />
HCV<br />
vehicles per 1000<br />
people<br />
ktoe<br />
250000<br />
200000<br />
150000<br />
100000<br />
tonsCO 2 per capita<br />
Entire country Metros<br />
350 50<br />
Since 2010 Since 2010<br />
Emissions Profile: P.R. China<br />
<strong>Clean</strong> <strong>Air</strong> <strong>Asia</strong>. <strong>2012</strong>. Emissions Profile: P.R. China. Pasig City. Philippines.<br />
The Emissions Profile accompanies <strong>Accessing</strong> <strong>Asia</strong>: <strong>Air</strong> Pollution and Greenhouse Gas Emissions Indicators from Road Transport and Electricity.”<strong>Accessing</strong><strong>Asia</strong> presents the first<br />
benchmark of air pollutant (as particulate matter, PM) and GHG (as CO2) emissions for 13 countries across <strong>Asia</strong> for road transport and electricity.<br />
50000<br />
0<br />
2000 2002 2004 2006 2008 2010<br />
Source: <strong>Clean</strong> <strong>Air</strong> <strong>Asia</strong> estimates, <strong>2012</strong><br />
Gasoline<br />
Diesel<br />
LPG<br />
CNG<br />
Electric<br />
KgCO2 per US dollar at<br />
constant 2000 prices<br />
Emission Standards for New Light-Duty Vehicles<br />
Gasoline Select Cities<br />
Euro 4 Euro 5<br />
Since 2010 Since 2010/12<br />
Current Sulfur levels in Diesel (ppm)<br />
Source: <strong>Clean</strong> <strong>Air</strong> <strong>Asia</strong>.
ACCESSING ASIA<br />
<strong>Air</strong> Pollution and Greenhouse Gas Emissions from Road Transport and Electricity<br />
ELECTRICITY: CO 2 EMISSIONS<br />
CO 2 Emissions (from generation)<br />
per Source Type (2009)<br />
1.00<br />
0.80<br />
0.60<br />
0.40<br />
0.20<br />
0.00<br />
3137<br />
million tons<br />
99%<br />
Coal Oil Natural Gas<br />
Source: <strong>Clean</strong> <strong>Air</strong> <strong>Asia</strong> estimates, <strong>2012</strong><br />
0.85 0.83<br />
Million Metric Tons<br />
4.00<br />
3.00<br />
2.00<br />
1.00<br />
0.00<br />
4000<br />
3000<br />
2000<br />
1000<br />
0<br />
2000 2001 2002 2003 2004 2005 2006 2007 2008 2009<br />
Total CO2 from electricity generation<br />
Total CO2 from electricity consumption<br />
0.95<br />
ELECTRICITY: DRIVERS OF EMISSIONS<br />
TWh<br />
4000<br />
3500<br />
3000<br />
2500<br />
2000<br />
1500<br />
1000<br />
500<br />
0<br />
Total CO 2 emissions from generation and consumption<br />
kgCO2 per kWh TCO2 per capita<br />
kgCO2 per GDP<br />
<strong>Asia</strong> Average 2009: 0.50<br />
2000 2009<br />
2.32<br />
2000 2009<br />
Source: <strong>Clean</strong> <strong>Air</strong> <strong>Asia</strong> estimates, <strong>2012</strong><br />
Source: <strong>Clean</strong> <strong>Air</strong> <strong>Asia</strong> estimates, <strong>2012</strong><br />
4.00<br />
3.00<br />
2.00<br />
1.00<br />
0.00<br />
0.97<br />
2.33<br />
<strong>Asia</strong> Average 2009: 0.83 <strong>Asia</strong> Average 2009: 0.90<br />
Generation by<br />
Source Type (2009)<br />
Oil<br />
Oil NatGas<br />
NatGas<br />
1%<br />
1% 1%<br />
1%<br />
Renewable<br />
Renewable<br />
17%<br />
17%<br />
Other<br />
Other<br />
2%<br />
2%<br />
Coal<br />
Coal<br />
79%<br />
79%<br />
2000 2009<br />
Consumption by<br />
End-use Sector (2009)<br />
Industrial<br />
Industrial<br />
73%<br />
73%<br />
Other<br />
Other<br />
2%<br />
2% Residential Residential<br />
Residential<br />
Transport<br />
Transport 12%<br />
12%<br />
2%<br />
2%<br />
Sources: National Electric Power Industry Statistics Express 2005-2011; China Energy Group Databook 7.0.; China Statistic Yearbooks; World Bank Development Indicators.<br />
NOTES:<br />
2000 2001 2002 2003 2004 2005 2006 2007 2008 2009<br />
ELECTRICITY GENERATION<br />
ELECTRICITY CONSUMPTION<br />
Emissions Profile: P.R. China<br />
<strong>Clean</strong> <strong>Air</strong> <strong>Asia</strong>. <strong>2012</strong>. Emissions Profile: P.R. China. Pasig City. Philippines.<br />
For more information about <strong>Clean</strong> <strong>Air</strong> <strong>Asia</strong>, please visit www.cleanairasia.org<br />
For the data found in this report, please visit www.CitiesACT.org<br />
3766 TWh<br />
3705 TWh<br />
Commercia<br />
Commercia<br />
l<br />
11%<br />
11%<br />
1. The boundaries, colors, denominations, and other information shown on any map in this report do not imply any judgment or endorsement on the part of <strong>Clean</strong> <strong>Air</strong> <strong>Asia</strong> concerning the<br />
delimination or legal status of any territory or boundaries. In no event will <strong>Clean</strong> <strong>Air</strong> <strong>Asia</strong> be liable for any form of damage arising from the application or misapplication of this report.<br />
2. Emissions from road transport sector were estimated using the Activity-Structure-Intensity-Fuel (ASIF) approach (adapted from Schipper and Marie 1999; Schipper, Gorham, and Marie, 2000). In<br />
this approach, road transport emissions are dependent on the level of transport activity (A); road transport mode structure (S); fuel intensity (I); and carbon content of fuel or emission factor (F).<br />
3. Vehicle population numbers were collected from National Bureau of Statistics, Ministry of Environmental Protection. VKT information were estimated from city data (Vientiane).<br />
4. Fuel consumption data presented in this profile is based on activity data.<br />
5. Data collected is from reported electricity generation and consumption.<br />
6. Electricity generation is from fossil fuels and hydropower. Geothermal, combustible renewables, wind power, and solar power are assumed to be equal for a rough disaggregation. The other<br />
source is from nuclear energy.<br />
7. Electricity consumption from other sectors includes agriculture, forestry, animal husbandry, fishery, water conservancy, and non-specified areas. Limited electricity consumption data was found<br />
for the commercial sector, transport sector, and own-use consumption.
ACCESSING ASIA<br />
<strong>Air</strong> Pollution and Greenhouse Gas Emissions from Road Transport and Electricity<br />
SINGAPORE<br />
Republic of Singapore<br />
million tons<br />
Singapore<br />
Land area: 627 km 2<br />
Population: 5 million (2010)<br />
Urban population: 100%, 5 million (2010)<br />
Population with access to electricity: 100%, 5 million (2009)<br />
GDP (constant 2000 USD): 165 billion (2010)<br />
GDP per capita (constant 2000 USD): 32111 (2010)<br />
ROAD TRANSPORT: EMISSIONS PER VEHICLE TYPE<br />
10<br />
8<br />
6<br />
4<br />
2<br />
0<br />
Total CO 2 Emissions CO 2 Emissions By Type (2010) CO 2 per GDP & capita<br />
6.4 6.6 6.6<br />
7.6<br />
8.1 8.3<br />
2000 2002 2004 2006 2008 2010<br />
Source: <strong>Clean</strong> <strong>Air</strong> <strong>Asia</strong> estimates, <strong>2012</strong> Source: <strong>Clean</strong> <strong>Air</strong> <strong>Asia</strong> estimates, <strong>2012</strong><br />
Source: <strong>Clean</strong> <strong>Air</strong> <strong>Asia</strong> estimates, <strong>2012</strong><br />
ROAD TRANSPORT: DRIVERS OF EMISSIONS<br />
vehicles (millions)<br />
1<br />
0.8<br />
0.6<br />
0.4<br />
0.2<br />
0<br />
31%<br />
14%<br />
11%<br />
Vehicle Population and Motorization Index Fuel Consumption<br />
Vehicle Population<br />
Motorization Index<br />
2000 2002 2004 2006 2008 2010<br />
100%<br />
80%<br />
60%<br />
40%<br />
20%<br />
0%<br />
Source: <strong>Clean</strong> <strong>Air</strong> <strong>Asia</strong> estimates, <strong>2012</strong><br />
VKT by Mode (2002-2010)<br />
2000 2010<br />
Source: <strong>Clean</strong> <strong>Air</strong> <strong>Asia</strong> estimates, <strong>2012</strong><br />
190<br />
185<br />
180<br />
175<br />
170<br />
165<br />
160<br />
2W<br />
3W<br />
PC<br />
MUV<br />
Bus<br />
LCV<br />
HCV<br />
1%<br />
vehicles per 1000<br />
people<br />
38%<br />
5%<br />
ktoe<br />
2W<br />
3W<br />
PC<br />
3000<br />
2500<br />
2000<br />
1500<br />
1000<br />
MUV<br />
BUS<br />
LCV<br />
HCV<br />
500<br />
0<br />
tonsCO 2 per capita<br />
1.75<br />
1.70<br />
1.65<br />
1.60<br />
1.55<br />
1.50<br />
2000 2004 2008<br />
CO2 emissions per capita<br />
CO2 emissions per GDP<br />
2000 2002 2004 2006 2008 2010<br />
Source: <strong>Clean</strong> <strong>Air</strong> <strong>Asia</strong> estimates, <strong>2012</strong><br />
0.08<br />
0.07<br />
0.06<br />
0.05<br />
0.04<br />
0.03<br />
0.02<br />
0.01<br />
0.00<br />
Gasoline<br />
Diesel<br />
LPG<br />
CNG<br />
Electric<br />
Emission Standards for New Light-Duty Vehicles<br />
Gasoline Diesel<br />
Euro 2 Euro 4<br />
Since 2001 Since 2006<br />
Current Sulfur levels in Diesel (ppm)<br />
Since 2006 50<br />
Source: <strong>Clean</strong> <strong>Air</strong> <strong>Asia</strong>.<br />
Emissions Profile: Singapore<br />
<strong>Clean</strong> <strong>Air</strong> <strong>Asia</strong>. <strong>2012</strong>. Emissions Profile: S. Pasig City. Philippines.<br />
The Emissions Profile accompanies <strong>Accessing</strong> <strong>Asia</strong>: <strong>Air</strong> Pollution and Greenhouse Gas Emissions Indicators from Road Transport and Electricity.”<strong>Accessing</strong><strong>Asia</strong> presents the first<br />
benchmark of air pollutant (as particulate matter, PM) and GHG (as CO2) emissions for 13 countries across <strong>Asia</strong> for road transport and electricity.<br />
KgCO2 per US dollar at<br />
constant 2000 prices
ACCESSING ASIA<br />
<strong>Air</strong> Pollution and Greenhouse Gas Emissions from Road Transport and Electricity<br />
ELECTRICITY: CO 2 EMISSIONS<br />
CO 2 Emissions (from generation)<br />
per Source Type (2009)<br />
1.00<br />
0.80<br />
0.60<br />
0.40<br />
0.20<br />
0.00<br />
19<br />
million tons<br />
76%<br />
kgCO 2 per kWh<br />
0.53<br />
0.45<br />
2000 2009<br />
24%<br />
Coal Oil Natural Gas<br />
Source: <strong>Clean</strong> <strong>Air</strong> <strong>Asia</strong> estimates, <strong>2012</strong><br />
<strong>Asia</strong> Average 2009: 0.50<br />
Million Metric Tons<br />
4.00<br />
3.00<br />
2.00<br />
1.00<br />
0.00<br />
50<br />
40<br />
30<br />
20<br />
10<br />
0<br />
2000 2001 2002 2003 2004 2005 2006 2007 2008 2009<br />
Total CO2 from electricity generation<br />
Total CO2 from electricity consumption<br />
3.86<br />
ELECTRICITY: DRIVERS OF EMISSIONS<br />
TWh<br />
70<br />
60<br />
50<br />
40<br />
30<br />
20<br />
10<br />
0<br />
Total CO 2 emissions from generation and consumption<br />
TCO 2 per capita<br />
3.39<br />
<strong>Asia</strong> Average 2009: 0.83<br />
2000 2009<br />
Source: <strong>Clean</strong> <strong>Air</strong> <strong>Asia</strong> estimates, <strong>2012</strong><br />
Generation by<br />
Source Type (2009)<br />
NatGas<br />
NatGas<br />
81%<br />
81%<br />
Renewable<br />
Renewable Other<br />
Other Coal<br />
Coal<br />
0%<br />
0%<br />
0%<br />
0%<br />
0%<br />
Source: <strong>Clean</strong> <strong>Air</strong> <strong>Asia</strong> estimates, <strong>2012</strong><br />
Oil Oil<br />
Oil<br />
19%<br />
19%<br />
4.00<br />
3.00<br />
2.00<br />
1.00<br />
0.00<br />
kgCO 2 per GDP<br />
3.86<br />
3.39<br />
<strong>Asia</strong> Average 2009: 0.90<br />
2000 2009<br />
Consumption by<br />
End-use Sector (2009)<br />
ELECTRICITY GENERATION<br />
ELECTRICITY CONSUMPTION<br />
Sources:Singstat Historical Electricity Consumption 1986- 2010, Fuel mix for electricity generation 2001-2010, and Miscellaneous; Energy Market Authority Annual Report 2004-2010;<br />
KEMA Limited Singapore and Energy Market Authority. (2008). Review of the LRMC costs of CCGT electricity generation in Singapore to establish the technical parameters for setting the<br />
Vesting Price for the period 1 January 2009 to 31 December 201. 100106665 Document 7 – Version 1.2.; World Bank Development Indicators<br />
NOTES:<br />
2000 2001 2002 2003 2004 2005 2006 2007 2008 2009<br />
Emissions Profile: Singapore<br />
<strong>Clean</strong> <strong>Air</strong> <strong>Asia</strong>. <strong>2012</strong>. Emissions Profile: Singapore. Pasig City. Philippines.<br />
For more information about <strong>Clean</strong> <strong>Air</strong> <strong>Asia</strong>, please visit www.cleanairasia.org<br />
For the data found in this report, please visit www.CitiesACT.org<br />
42 TWh<br />
Industrial<br />
Industrial<br />
81%<br />
81%<br />
Other<br />
Other<br />
0%<br />
0%<br />
Transport Transport<br />
Transport<br />
0%<br />
0%<br />
Residential Residential<br />
Residential<br />
19%<br />
19%<br />
38 TWh<br />
Commercia<br />
Commercia<br />
l<br />
0%<br />
0%<br />
1. The boundaries, colors, denominations, and other information shown on any map in this report do not imply any judgment or endorsement on the part of <strong>Clean</strong> <strong>Air</strong> <strong>Asia</strong> concerning the<br />
delimination or legal status of any territory or boundaries. In no event will <strong>Clean</strong> <strong>Air</strong> <strong>Asia</strong> be liable for any form of damage arising from the application or misapplication of this report.<br />
2. Emissions from road transport sector were estimated using the Activity-Structure-Intensity-Fuel (ASIF) approach (adapted from Schipper and Marie 1999; Schipper, Gorham, and Marie, 2000). In<br />
this approach, road transport emissions are dependent on the level of transport activity (A); road transport mode structure (S); fuel intensity (I); and carbon content of fuel or emission factor (F).<br />
3. Vehicle population numbers and VKT were collected from Land Transport Authority.<br />
4. Fuel consumption data presented in this profile is based on activity data.<br />
5. Data collected is from reported electricity generation and consumption.<br />
6. Electricity generation is from oil and natural gas. Coal, geothermal, hydropower, combustible renewables, wind power, and solar power are not applicable.<br />
7. Electricity consumption from commercial and transport sectors have no data.
ACCESSING ASIA<br />
<strong>Air</strong> Pollution and Greenhouse Gas Emissions from Road Transport and Electricity<br />
SRI LANKA<br />
Democratic Socialist Republic of Sri Lanka<br />
million tons<br />
Colombo<br />
Land area: 64630 km 2<br />
Population: 20 million (2010)<br />
Urban population: 15%, 3 million (2010)<br />
Population with access to electricity: 77%, 16 million (2009)<br />
GDP (constant 2000 USD): 27 billion (2010)<br />
GDP per capita (constant 2000 USD): 1322 (2010)<br />
ROAD TRANSPORT: EMISSIONS PER VEHICLE TYPE<br />
7<br />
6<br />
5<br />
4<br />
3<br />
2<br />
1<br />
0<br />
Total CO 2 Emissions CO 2 Emissions By Type (2010) CO 2 per GDP & capita<br />
3.8 4.0<br />
4.4<br />
5.1<br />
5.6<br />
6.0<br />
2000 2002 2004 2006 2008 2010<br />
Source: <strong>Clean</strong> <strong>Air</strong> <strong>Asia</strong> estimates, <strong>2012</strong> Source: <strong>Clean</strong> <strong>Air</strong> <strong>Asia</strong> estimates, <strong>2012</strong><br />
Source: <strong>Clean</strong> <strong>Air</strong> <strong>Asia</strong> estimates, <strong>2012</strong><br />
ROAD TRANSPORT: DRIVERS OF EMISSIONS<br />
vehicles (millions)<br />
3<br />
2.5<br />
2<br />
1.5<br />
1<br />
0.5<br />
0<br />
37%<br />
6%<br />
17%<br />
9%<br />
9%<br />
10%<br />
12%<br />
2W<br />
3W<br />
PC<br />
MUV<br />
BUS<br />
LCV<br />
HCV<br />
tonsCO 2 per capita<br />
0.35<br />
0.30<br />
0.25<br />
0.20<br />
0.15<br />
0.10<br />
0.05<br />
0.00<br />
Vehicle Population and Motorization Index Fuel Consumption<br />
2000 2002 2004 2006 2008 2010<br />
100%<br />
80%<br />
60%<br />
40%<br />
20%<br />
0%<br />
Vehicle Population<br />
Motorization Index<br />
Source: <strong>Clean</strong> <strong>Air</strong> <strong>Asia</strong> estimates, <strong>2012</strong><br />
VKT by Mode (2002-2010)<br />
2000 2010<br />
Source: <strong>Clean</strong> <strong>Air</strong> <strong>Asia</strong> estimates, <strong>2012</strong><br />
2W<br />
3W<br />
PC<br />
MUV<br />
Bus<br />
LCV<br />
HCV<br />
140<br />
120<br />
100<br />
80<br />
60<br />
40<br />
20<br />
0<br />
vehicles per 1000<br />
people<br />
ktoe<br />
2000 2004 2008<br />
CO2 emissions per capita<br />
CO2 emissions per GDP<br />
Emissions Profile: Sri Lanka<br />
<strong>Clean</strong> <strong>Air</strong> <strong>Asia</strong>. <strong>2012</strong>. Emissions Profile: Sri Lanka. Pasig City. Philippines.<br />
The Emissions Profile accompanies <strong>Accessing</strong> <strong>Asia</strong>: <strong>Air</strong> Pollution and Greenhouse Gas Emissions Indicators from Road Transport and Electricity.”<strong>Accessing</strong><strong>Asia</strong> presents the first<br />
benchmark of air pollutant (as particulate matter, PM) and GHG (as CO2) emissions for 13 countries across <strong>Asia</strong> for road transport and electricity.<br />
2000<br />
1500<br />
1000<br />
500<br />
0<br />
2000 2002 2004 2006 2008 2010<br />
Source: <strong>Clean</strong> <strong>Air</strong> <strong>Asia</strong> estimates, <strong>2012</strong><br />
0.35<br />
0.30<br />
0.25<br />
0.20<br />
0.15<br />
0.10<br />
0.05<br />
0.00<br />
Gasoline<br />
Diesel<br />
LPG<br />
CNG<br />
Electric<br />
Emission Standards for New Light-Duty Vehicles<br />
Euro 1<br />
Since 2003<br />
Current Sulfur levels in Diesel (ppm)<br />
(under consideration/ discussion)<br />
<strong>2012</strong> 50<br />
Source: <strong>Clean</strong> <strong>Air</strong> <strong>Asia</strong>.<br />
KgCO2 per US dollar at<br />
constant 2000 prices
ACCESSING ASIA<br />
<strong>Air</strong> Pollution and Greenhouse Gas Emissions from Road Transport and Electricity<br />
ELECTRICITY: CO 2 EMISSIONS<br />
CO 2 Emissions (from generation)<br />
per Source Type (2009)<br />
1.00<br />
0.80<br />
0.60<br />
0.40<br />
0.20<br />
0.00<br />
4<br />
million tons<br />
0.36<br />
100%<br />
Coal Oil Natural Gas<br />
Source: <strong>Clean</strong> <strong>Air</strong> <strong>Asia</strong> estimates, <strong>2012</strong><br />
0.41<br />
Million Metric Tons<br />
1.00<br />
0.80<br />
0.60<br />
0.40<br />
0.20<br />
0.00<br />
12<br />
10<br />
8<br />
6<br />
4<br />
2<br />
0<br />
2000 2001 2002 2003 2004 2005 2006 2007 2008 2009<br />
Total CO2 from electricity generation<br />
Total CO2 from electricity consumption<br />
0.12<br />
ELECTRICITY: DRIVERS OF EMISSIONS<br />
TWh<br />
12<br />
10<br />
8<br />
6<br />
4<br />
2<br />
0<br />
NOTES:<br />
Total CO 2 emissions from generation and consumption<br />
kgCO2 per kWh TCO2 per capita<br />
kgCO2 per GDP<br />
<strong>Asia</strong> Average 2009: 0.50<br />
2000 2009<br />
2000 2001 2002 2003 2004 2005 2006 2007 2008 2009<br />
ELECTRICITY GENERATION<br />
ELECTRICITY CONSUMPTION<br />
0.21<br />
2000 2009<br />
Source: <strong>Clean</strong> <strong>Air</strong> <strong>Asia</strong> estimates, <strong>2012</strong><br />
Source: <strong>Clean</strong> <strong>Air</strong> <strong>Asia</strong> estimates, <strong>2012</strong><br />
1.00<br />
<strong>Asia</strong> Average 2009: 0.83 <strong>Asia</strong> Average 2009: 0.90<br />
Generation by<br />
Source Type (2009)<br />
Renewable<br />
Renewable<br />
0%<br />
0%<br />
NatGas<br />
NatGas<br />
27%<br />
27%<br />
Other<br />
Other<br />
20%<br />
20%<br />
Oil<br />
Oil<br />
20%<br />
20%<br />
Coal<br />
Coal<br />
33%<br />
33%<br />
0.80<br />
0.60<br />
0.40<br />
0.20<br />
0.00<br />
Transport<br />
Transport<br />
0%<br />
0%<br />
Other Other<br />
Other<br />
20%<br />
20%<br />
Industrial<br />
Industrial<br />
27%<br />
27%<br />
0.19<br />
0.25<br />
2000 2009<br />
Sources: Ceylon Electricity Board Statistical Digests 2001-2010; Sri Lanka Energy Balance 2007; World Bank Development Indicators.<br />
Emissions Profile: Sri Lanka<br />
<strong>Clean</strong> <strong>Air</strong> <strong>Asia</strong>. <strong>2012</strong>. Emissions Profile: Sri Lanka. Pasig City. Philippines.<br />
For more information about <strong>Clean</strong> <strong>Air</strong> <strong>Asia</strong>, please visit www.cleanairasia.org<br />
For the data found in this report, please visit www.CitiesACT.org<br />
62 TWh<br />
Consumption by<br />
End-use Sector (2009)<br />
Commercia Commercia<br />
Commercia<br />
l<br />
20%<br />
20%<br />
51 TWh<br />
1. The boundaries, colors, denominations, and other information shown on any map in this report do not imply any judgment or endorsement on the part of <strong>Clean</strong> <strong>Air</strong> <strong>Asia</strong> concerning the<br />
delimination or legal status of any territory or boundaries. In no event will <strong>Clean</strong> <strong>Air</strong> <strong>Asia</strong> be liable for any form of damage arising from the application or misapplication of this report.<br />
2. Emissions from road transport sector were estimated using the Activity-Structure-Intensity-Fuel (ASIF) approach (adapted from Schipper and Marie 1999; Schipper, Gorham, and Marie, 2000). In<br />
this approach, road transport emissions are dependent on the level of transport activity (A); road transport mode structure (S); fuel intensity (I); and carbon content of fuel or emission factor (F).<br />
3. Vehicle population numbers were estimated from the Department of Census and Statistics. VKT information were estimated from various studies.<br />
4. Fuel consumption data presented in this profile is based on activity data.<br />
5. Data collected is from reported electricity generation and consumption.<br />
6. Electricity is generated from oil, hydropower, combustible renewables, wind power, and solar power. Solar power is entirely from solar photovoltaic off-grid systems.<br />
7. Due to the lack of data, electricity consumption by end-use sector is considered to be under reported.<br />
8. Electricity consumption from other sectors includes street lighting and religious places.<br />
Residential<br />
Residential<br />
33%<br />
33%
ACCESSING ASIA<br />
<strong>Air</strong> Pollution and Greenhouse Gas Emissions from Road Transport and Electricity<br />
THAILAND<br />
Kingdom of Thailand<br />
million tons<br />
Bangkok<br />
Land area: 510890 km 2<br />
Population: 68 million (2010)<br />
Urban population: 34%, 24 million (2010)<br />
Population with access to electricity: 99%, 67 million (2009)<br />
GDP (constant 2000 USD): 187 billion (2010)<br />
GDP per capita (constant 2000 USD): 2751 (2010)<br />
ROAD TRANSPORT: EMISSIONS PER VEHICLE TYPE<br />
60<br />
50<br />
40<br />
30<br />
20<br />
10<br />
0<br />
Total CO 2 Emissions CO 2 Emissions By Type (2010) CO 2 per GDP & capita<br />
40.9<br />
35.9<br />
45.3<br />
56.6<br />
51.3<br />
2000 2002 2004 2006 2008 2010<br />
Source: <strong>Clean</strong> <strong>Air</strong> <strong>Asia</strong> estimates, <strong>2012</strong> Source: <strong>Clean</strong> <strong>Air</strong> <strong>Asia</strong> estimates, <strong>2012</strong><br />
Source: <strong>Clean</strong> <strong>Air</strong> <strong>Asia</strong> estimates, <strong>2012</strong><br />
ROAD TRANSPORT: DRIVERS OF EMISSIONS<br />
vehicles (millions)<br />
25<br />
20<br />
15<br />
10<br />
5<br />
0<br />
25%<br />
36%<br />
Vehicle Population and Motorization Index Fuel Consumption<br />
2000 2002 2004 2006 2008 2010<br />
100%<br />
80%<br />
60%<br />
40%<br />
20%<br />
0%<br />
Vehicle Population<br />
Motorization Index<br />
Source: <strong>Clean</strong> <strong>Air</strong> <strong>Asia</strong> estimates, <strong>2012</strong><br />
VKT by Mode (2002-2010)<br />
2000 2010<br />
Source: <strong>Clean</strong> <strong>Air</strong> <strong>Asia</strong> estimates, <strong>2012</strong><br />
2W<br />
3W<br />
PC<br />
MUV<br />
Bus<br />
LCV<br />
HCV<br />
6%<br />
18%<br />
12%<br />
350<br />
300<br />
250<br />
200<br />
150<br />
100<br />
50<br />
0<br />
3%<br />
vehicles per 1000<br />
people<br />
ktoe<br />
2W<br />
3W<br />
PC<br />
MUV<br />
BUS<br />
LCV<br />
HCV<br />
18000<br />
16000<br />
14000<br />
12000<br />
10000<br />
8000<br />
6000<br />
4000<br />
2000<br />
0<br />
tonsCO 2 per capita<br />
1<br />
0.8<br />
0.6<br />
0.4<br />
0.2<br />
0<br />
2000 2004 2008<br />
CO2 emissions per capita<br />
CO2 emissions per GDP<br />
2000 2002 2004 2006 2008 2010<br />
Source: <strong>Clean</strong> <strong>Air</strong> <strong>Asia</strong> estimates, <strong>2012</strong><br />
0.31<br />
0.3<br />
0.29<br />
0.28<br />
0.27<br />
0.26<br />
0.25<br />
Gasoline<br />
Diesel<br />
LPG<br />
CNG<br />
Electric<br />
Emission Standards for New Light-Duty Vehicles<br />
Euro 4<br />
Since <strong>2012</strong><br />
Current Sulfur levels in Diesel (ppm)<br />
Since <strong>2012</strong> 50<br />
Source: <strong>Clean</strong> <strong>Air</strong> <strong>Asia</strong>.<br />
Emissions Profile: Thailand<br />
<strong>Clean</strong> <strong>Air</strong> <strong>Asia</strong>. <strong>2012</strong>. Emissions Profile: Thailand. Pasig City. Philippines.<br />
The Emissions Profile accompanies <strong>Accessing</strong> <strong>Asia</strong>: <strong>Air</strong> Pollution and Greenhouse Gas Emissions Indicators from Road Transport and Electricity.”<strong>Accessing</strong><strong>Asia</strong> presents the first<br />
benchmark of air pollutant (as particulate matter, PM) and GHG (as CO2) emissions for 13 countries across <strong>Asia</strong> for road transport and electricity.<br />
KgCO2 per US dollar at<br />
constant 2000 prices
ACCESSING ASIA<br />
<strong>Air</strong> Pollution and Greenhouse Gas Emissions from Road Transport and Electricity<br />
ELECTRICITY: CO 2 EMISSIONS<br />
CO 2 Emissions (from generation)<br />
per Source Type (2009)<br />
1.00<br />
0.80<br />
0.60<br />
0.40<br />
0.20<br />
0.00<br />
63%<br />
81<br />
million tons<br />
0.57 0.56<br />
Million Metric Tons<br />
1.50<br />
1.00<br />
0.50<br />
0.00<br />
200<br />
150<br />
100<br />
50<br />
0<br />
2000 2001 2002 2003 2004 2005 2006 2007 2008 2009<br />
Total CO2 from electricity generation<br />
Total CO2 from electricity consumption<br />
0.82<br />
ELECTRICITY: DRIVERS OF EMISSIONS<br />
TWh<br />
160<br />
140<br />
120<br />
100<br />
80<br />
60<br />
40<br />
20<br />
0<br />
NOTES:<br />
Total CO 2 emissions from generation and consumption<br />
kgCO2 per kWh TCO2 per capita<br />
kgCO2 per GDP<br />
2000 2009<br />
36%<br />
Coal Oil Natural Gas<br />
Source: <strong>Clean</strong> <strong>Air</strong> <strong>Asia</strong> estimates, <strong>2012</strong><br />
<strong>Asia</strong> Average 2009: 0.50<br />
2000 2001 2002 2003 2004 2005 2006 2007 2008 2009<br />
1.14<br />
<strong>Asia</strong> Average 2009: 0.83<br />
2000 2009<br />
Source: <strong>Clean</strong> <strong>Air</strong> <strong>Asia</strong> estimates, <strong>2012</strong><br />
Generation by<br />
Source Type (2009)<br />
NatGas NatGas<br />
NatGas<br />
73%<br />
73%<br />
Renewable<br />
Renewable Other<br />
Other<br />
6%<br />
6% 0%<br />
0%<br />
Source: <strong>Clean</strong> <strong>Air</strong> <strong>Asia</strong> estimates, <strong>2012</strong><br />
Coal<br />
Coal<br />
21%<br />
21%<br />
1.50<br />
1.00<br />
0.50<br />
0.00<br />
Oil<br />
Oil<br />
0%<br />
0%<br />
Industrial<br />
Industrial<br />
41%<br />
41%<br />
ELECTRICITY GENERATION<br />
ELECTRICITY CONSUMPTION<br />
Sources: Department of Alternative Energy Development and Efficiency Electric Power Annual Reports 2004-2010;<br />
Energy Statistics of Thailand 2010; EPPO Online Statistical Database; World Bank Development Indicators<br />
Emissions Profile: Thailand<br />
<strong>Clean</strong> <strong>Air</strong> <strong>Asia</strong>. <strong>2012</strong>. Emissions Profile: Thailand. Pasig City. Philippines.<br />
For more information about <strong>Clean</strong> <strong>Air</strong> <strong>Asia</strong>, please visit www.cleanairasia.org<br />
For the data found in this report, please visit www.CitiesACT.org<br />
144 TWh<br />
0.99<br />
1.33<br />
<strong>Asia</strong> Average 2009: 0.90<br />
2000 2009<br />
Consumption by<br />
End-use Sector (2009)<br />
Other<br />
Other<br />
2%<br />
2%<br />
Transport<br />
Transport<br />
0%<br />
0%<br />
Residential<br />
Residential<br />
22%<br />
22%<br />
Commercia<br />
Commercia<br />
l<br />
35%<br />
35%<br />
137 TWh<br />
1. The boundaries, colors, denominations, and other information shown on any map in this report do not imply any judgment or endorsement on the part of <strong>Clean</strong> <strong>Air</strong> <strong>Asia</strong> concerning the<br />
delimination or legal status of any territory or boundaries. In no event will <strong>Clean</strong> <strong>Air</strong> <strong>Asia</strong> be liable for any form of damage arising from the application or misapplication of this report.<br />
2. Data collected is from reported electricity generation and consumption.<br />
3. Emissions from road transport sector were estimated using the Activity-Structure-Intensity-Fuel (ASIF) approach (adapted from Schipper and Marie 1999; Schipper, Gorham, and Marie, 2000). In<br />
this approach, road transport emissions are dependent on the level of transport activity (A); road transport mode structure (S); fuel intensity (I); and carbon content of fuel or emission factor (F).<br />
4. Vehicle population numbers were collected from Department of Land Transport. VKT information were estimated from Department of Highways and various studies.<br />
5. Fuel consumption data presented in this profile is based on activity data.<br />
6. Electricity generation is from fossil fuels, geothermal, hydropower. Combustible renewables are not applicable. Wind and solar polar are assumed equal for a rough disaggregation. Other sources<br />
are from small power producers and independent power producers.<br />
7. Electricity consumption from other sources include free of charge, agriculture, and temporary customers.
ACCESSING ASIA<br />
<strong>Air</strong> Pollution and Greenhouse Gas Emissions from Road Transport and Electricity<br />
VIETNAM<br />
Socialist Republic of Vietnam<br />
Hanoi<br />
Land area: 310070 km 2<br />
million tons<br />
Population: 87 billion (2010)<br />
Urban population: 30%, 26 million (2010)<br />
Population with access to electricity: 98%, 84 million (2009)<br />
GDP (constant 2000 USD): 63 billion (2010)<br />
GDP per capita (constant 2000 USD): 723 (2010)<br />
ROAD TRANSPORT: EMISSIONS PER VEHICLE TYPE<br />
35<br />
30<br />
25<br />
20<br />
15<br />
10<br />
5<br />
0<br />
Total CO 2 Emissions CO 2 Emissions By Type (2010) CO 2 per GDP & capita<br />
8.5<br />
12.0 13.9<br />
17.9<br />
25.5<br />
30.5<br />
2000 2002 2004 2006 2008 2010<br />
Source: <strong>Clean</strong> <strong>Air</strong> <strong>Asia</strong> estimates, <strong>2012</strong> Source: <strong>Clean</strong> <strong>Air</strong> <strong>Asia</strong> estimates, <strong>2012</strong><br />
Source: <strong>Clean</strong> <strong>Air</strong> <strong>Asia</strong> estimates, <strong>2012</strong><br />
ROAD TRANSPORT: DRIVERS OF EMISSIONS<br />
vehicles (millions)<br />
35<br />
30<br />
25<br />
20<br />
15<br />
10<br />
5<br />
0<br />
3%<br />
29%<br />
19%<br />
Vehicle Population and Motorization Index Fuel Consumption<br />
2000 2002 2004 2006 2008 2010<br />
100%<br />
Vehicle Population<br />
Motorization Index<br />
80%<br />
60%<br />
40%<br />
20%<br />
0%<br />
Source: <strong>Clean</strong> <strong>Air</strong> <strong>Asia</strong> estimates, <strong>2012</strong><br />
VKT by Mode (2002-2010)<br />
2000 2010<br />
Source: <strong>Clean</strong> <strong>Air</strong> <strong>Asia</strong> estimates, <strong>2012</strong><br />
0<br />
2W<br />
3W<br />
PC<br />
400<br />
300<br />
200<br />
100<br />
MUV<br />
Bus<br />
LCV<br />
HCV<br />
3%<br />
vehicles per 1000<br />
people<br />
46%<br />
ktoe<br />
12000<br />
10000<br />
8000<br />
6000<br />
4000<br />
2000<br />
2W<br />
3W<br />
PC<br />
MUV<br />
BUS<br />
LCV<br />
HCV<br />
tonsCO 2 per capita<br />
0.40<br />
0.30<br />
0.20<br />
0.10<br />
0.00<br />
2000 2004 2008<br />
CO2 emissions per capita<br />
CO2 emissions per GDP<br />
Emissions Profile: Vietnam<br />
<strong>Clean</strong> <strong>Air</strong> <strong>Asia</strong>. <strong>2012</strong>. Emissions Profile: Vietnam. Pasig City. Philippines.<br />
The Emissions Profile accompanies <strong>Accessing</strong> <strong>Asia</strong>: <strong>Air</strong> Pollution and Greenhouse Gas Emissions Indicators from Road Transport and Electricity.”<strong>Accessing</strong><strong>Asia</strong> presents the first<br />
benchmark of air pollutant (as particulate matter, PM) and GHG (as CO2) emissions for 13 countries across <strong>Asia</strong> for road transport and electricity.<br />
0<br />
2000 2002 2004 2006 2008 2010<br />
Source: <strong>Clean</strong> <strong>Air</strong> <strong>Asia</strong> estimates, <strong>2012</strong><br />
0.60<br />
0.50<br />
0.40<br />
0.30<br />
0.20<br />
0.10<br />
0.00<br />
Gasoline<br />
Diesel<br />
LPG<br />
CNG<br />
Electric<br />
Emission Standards for New Light-Duty Vehicles<br />
Euro 2<br />
Since 2007<br />
Current Sulfur levels in Diesel (ppm)<br />
Since 2007 500<br />
Source: <strong>Clean</strong> <strong>Air</strong> <strong>Asia</strong>.<br />
KgCO2 per US dollar at<br />
constant 2000 prices
ACCESSING ASIA<br />
<strong>Air</strong> Pollution and Greenhouse Gas Emissions from Road Transport and Electricity<br />
ELECTRICITY: CO 2 EMISSIONS<br />
CO 2 Emissions (from generation)<br />
per Source Type (2009)<br />
1.00<br />
0.80<br />
0.60<br />
0.40<br />
0.20<br />
0.00<br />
49%<br />
35<br />
million tons<br />
0.36<br />
6%<br />
0.42<br />
Million Metric Tons<br />
1.00<br />
0.80<br />
0.60<br />
0.40<br />
0.20<br />
0.00<br />
30<br />
25<br />
20<br />
15<br />
10<br />
5<br />
0<br />
2000 2001 2002 2003 2004 2005 2006 2007 2008 2009<br />
Total CO2 from electricity generation<br />
Total CO2 from electricity consumption<br />
0.08<br />
ELECTRICITY: DRIVERS OF EMISSIONS<br />
TWh<br />
12<br />
10<br />
8<br />
6<br />
4<br />
2<br />
0<br />
Total CO 2 emissions from generation and consumption<br />
kgCO2 per kWh TCO2 per capita<br />
kgCO2 per GDP<br />
2000 2009<br />
45%<br />
Coal Oil Natural Gas<br />
Source: <strong>Clean</strong> <strong>Air</strong> <strong>Asia</strong> estimates, <strong>2012</strong><br />
<strong>Asia</strong> Average 2009: 0.50<br />
0.36<br />
2000 2009<br />
Source: <strong>Clean</strong> <strong>Air</strong> <strong>Asia</strong> estimates, <strong>2012</strong><br />
Source: <strong>Clean</strong> <strong>Air</strong> <strong>Asia</strong> estimates, <strong>2012</strong><br />
1.00<br />
<strong>Asia</strong> Average 2009: 0.83 <strong>Asia</strong> Average 2009: 0.90<br />
Generation by<br />
Source Type (2009)<br />
Renewable<br />
Renewable<br />
36%<br />
36%<br />
Other<br />
Other<br />
0%<br />
0%<br />
Coal<br />
Coal<br />
18%<br />
18%<br />
NatGas NatGas<br />
NatGas<br />
43%<br />
43%<br />
Oil Oil<br />
Oil<br />
3%<br />
3%<br />
0.80<br />
0.60<br />
0.40<br />
0.20<br />
0.00<br />
Industrial<br />
Industrial<br />
51%<br />
51%<br />
0.36<br />
0.42<br />
2000 2009<br />
Consumption by<br />
End-use Sector (2009)<br />
Other<br />
Other<br />
1%<br />
1%<br />
Transport<br />
Transport<br />
2%<br />
2%<br />
Commercia<br />
Commercia<br />
l<br />
5%<br />
5%<br />
ELECTRICITY GENERATION<br />
ELECTRICITY CONSUMPTION<br />
Sources: Statistical Yearbook of Vietnam 2010; Tran Minh Tuyen; & Axel Michealowa. Hamburg Institute of International Economics. (2004). HWWA Discussion Paper Construction for<br />
Vietnam National Electricity Grid; Vietnam Electricity Corporate Profile 2009-2010. UNFCCC. Project 6919 Song Bung 4 hydropower project; World Bank Development Indicators<br />
NOTES:<br />
2000 2001 2002 2003 2004 2005 2006 2007 2008 2009<br />
Emissions Profile: Vietnam<br />
<strong>Clean</strong> <strong>Air</strong> <strong>Asia</strong>. <strong>2012</strong>. Emissions Profile: Vietnam. Pasig City. Philippines.<br />
For more information about <strong>Clean</strong> <strong>Air</strong> <strong>Asia</strong>, please visit www.cleanairasia.org<br />
For the data found in this report, please visit www.CitiesACT.org<br />
62 TWh<br />
51 TWh<br />
1. The boundaries, colors, denominations, and other information shown on any map in this report do not imply any judgment or endorsement on the part of <strong>Clean</strong> <strong>Air</strong> <strong>Asia</strong> concerning the<br />
delimination or legal status of any territory or boundaries. In no event will <strong>Clean</strong> <strong>Air</strong> <strong>Asia</strong> be liable for any form of damage arising from the application or misapplication of this report.<br />
2. Emissions from road transport sector were estimated using the Activity-Structure-Intensity-Fuel (ASIF) approach (adapted from Schipper and Marie 1999; Schipper, Gorham, and Marie, 2000). In<br />
this approach, road transport emissions are dependent on the level of transport activity (A); road transport mode structure (S); fuel intensity (I); and carbon content of fuel or emission factor (F).<br />
3. Vehicle population numbers were estimated from Vietnam Register and Transport Development an Strategy Institute (TDSI). VKT information were estimated from TDSI.<br />
4. Fuel consumption data presented in this profile is based on activity data.<br />
5. Data collected is from reported electricity generation and consumption.<br />
6. Electricity generation is from fossil fuels and hydropower. Geothermal, combustible renewables, wind power, and solar power are not applicable.<br />
7. Electricity consumption from other sectors includes agriculture and management.<br />
Residential<br />
Residential<br />
41%<br />
41%