Accessing Asia 2012 - Clean Air Initiative
Accessing Asia 2012 - Clean Air Initiative
Accessing Asia 2012 - Clean Air Initiative

Create successful ePaper yourself
Turn your PDF publications into a flip-book with our unique Google optimized e-Paper software.
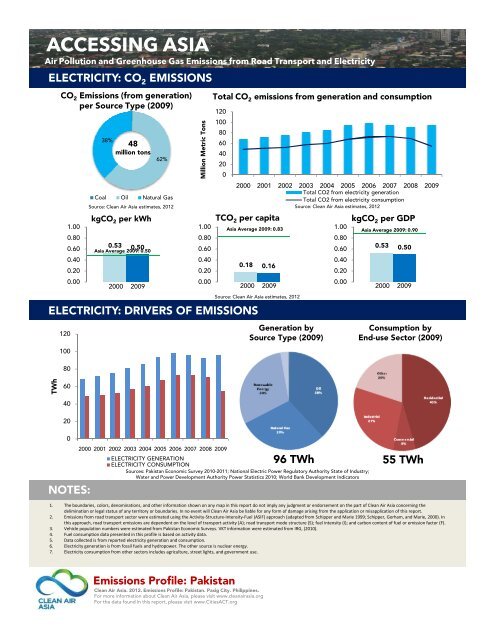
ACCESSING ASIA<br />
<strong>Air</strong> Pollution and Greenhouse Gas Emissions from Road Transport and Electricity<br />
ELECTRICITY: CO 2 EMISSIONS<br />
CO 2 Emissions (from generation)<br />
per Source Type (2009)<br />
1.00<br />
0.80<br />
0.60<br />
0.40<br />
0.20<br />
0.00<br />
38%<br />
48<br />
million tons<br />
0.53 0.50<br />
Million Metric Tons<br />
1.00<br />
0.80<br />
0.60<br />
0.40<br />
0.20<br />
0.00<br />
120<br />
100<br />
80<br />
60<br />
40<br />
20<br />
0<br />
2000 2001 2002 2003 2004 2005 2006 2007 2008 2009<br />
Total CO2 from electricity generation<br />
Total CO2 from electricity consumption<br />
0.18 0.16<br />
ELECTRICITY: DRIVERS OF EMISSIONS<br />
TWh<br />
120<br />
100<br />
80<br />
60<br />
40<br />
20<br />
0<br />
NOTES:<br />
Total CO 2 emissions from generation and consumption<br />
kgCO2 per kWh TCO2 per capita<br />
kgCO2 per GDP<br />
2000 2009<br />
62%<br />
Coal Oil Natural Gas<br />
Source: <strong>Clean</strong> <strong>Air</strong> <strong>Asia</strong> estimates, <strong>2012</strong><br />
<strong>Asia</strong> Average 2009: 0.50<br />
2000 2001 2002 2003 2004 2005 2006 2007 2008 2009<br />
2000 2009<br />
Source: <strong>Clean</strong> <strong>Air</strong> <strong>Asia</strong> estimates, <strong>2012</strong><br />
Source: <strong>Clean</strong> <strong>Air</strong> <strong>Asia</strong> estimates, <strong>2012</strong><br />
1.00<br />
<strong>Asia</strong> Average 2009: 0.83 <strong>Asia</strong> Average 2009: 0.90<br />
Generation by<br />
Source Type (2009)<br />
Renewable<br />
Renewable<br />
0%<br />
0%<br />
NatGas<br />
NatGas<br />
27%<br />
27%<br />
Other<br />
Other<br />
20%<br />
20%<br />
Oil<br />
Oil<br />
8% 8%<br />
8%<br />
0.80<br />
0.60<br />
0.40<br />
0.20<br />
0.00<br />
Coal<br />
Coal<br />
45%<br />
45%<br />
Transport<br />
Transport<br />
0%<br />
0%<br />
ELECTRICITY GENERATION<br />
ELECTRICITY CONSUMPTION<br />
Sources: Pakistan Economic Survey 2010-2011; National Electric Power Regulatory Authority State of Industry;<br />
Water and Power Development Authority Power Statistics 2010; World Bank Development Indicators<br />
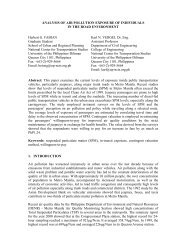
Emissions Profile: Pakistan<br />
<strong>Clean</strong> <strong>Air</strong> <strong>Asia</strong>. <strong>2012</strong>. Emissions Profile: Pakistan. Pasig City. Philippines.<br />
For more information about <strong>Clean</strong> <strong>Air</strong> <strong>Asia</strong>, please visit www.cleanairasia.org<br />
For the data found in this report, please visit www.CitiesACT.org<br />
96 TWh<br />
Other<br />
Other<br />
20%<br />
20%<br />
Industrial<br />
Industrial<br />
27%<br />
27%<br />
0.53 0.50<br />
2000 2009<br />
Consumption by<br />
End-use Sector (2009)<br />
Commercia<br />
Commercia<br />
l<br />
8%<br />
8%<br />
55 TWh<br />
1. The boundaries, colors, denominations, and other information shown on any map in this report do not imply any judgment or endorsement on the part of <strong>Clean</strong> <strong>Air</strong> <strong>Asia</strong> concerning the<br />
delimination or legal status of any territory or boundaries. In no event will <strong>Clean</strong> <strong>Air</strong> <strong>Asia</strong> be liable for any form of damage arising from the application or misapplication of this report.<br />
2. Emissions from road transport sector were estimated using the Activity-Structure-Intensity-Fuel (ASIF) approach (adapted from Schipper and Marie 1999; Schipper, Gorham, and Marie, 2000). In<br />
this approach, road transport emissions are dependent on the level of transport activity (A); road transport mode structure (S); fuel intensity (I); and carbon content of fuel or emission factor (F).<br />
3. Vehicle population numbers were estimated from Pakistan Economic Surveys. VKT information were estimated from IRG, (2010).<br />
4. Fuel consumption data presented in this profile is based on activity data.<br />
5. Data collected is from reported electricity generation and consumption.<br />
6. Electricity generation is from fossil fuels and hydropower. The other source is nuclear energy.<br />
7. Electricity consumption from other sectors includes agriculture, street lights, and government use.<br />
Residential<br />
Residential<br />
45%<br />
45%