Accessing Asia 2012 - Clean Air Initiative
Accessing Asia 2012 - Clean Air Initiative
Accessing Asia 2012 - Clean Air Initiative

You also want an ePaper? Increase the reach of your titles
YUMPU automatically turns print PDFs into web optimized ePapers that Google loves.
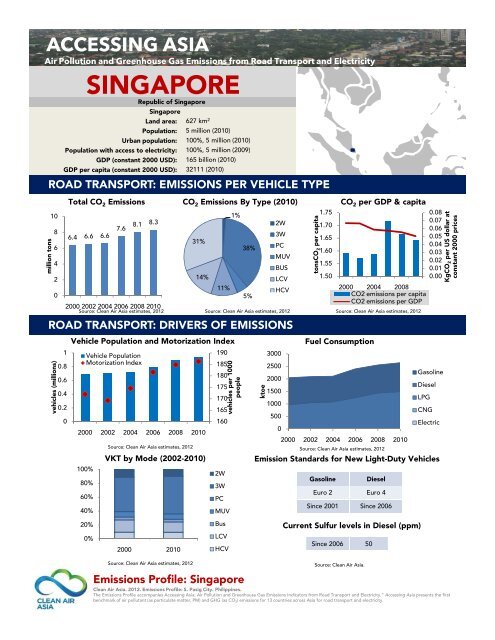
ACCESSING ASIA<br />
<strong>Air</strong> Pollution and Greenhouse Gas Emissions from Road Transport and Electricity<br />
SINGAPORE<br />
Republic of Singapore<br />
million tons<br />
Singapore<br />
Land area: 627 km 2<br />
Population: 5 million (2010)<br />
Urban population: 100%, 5 million (2010)<br />
Population with access to electricity: 100%, 5 million (2009)<br />
GDP (constant 2000 USD): 165 billion (2010)<br />
GDP per capita (constant 2000 USD): 32111 (2010)<br />
ROAD TRANSPORT: EMISSIONS PER VEHICLE TYPE<br />
10<br />
8<br />
6<br />
4<br />
2<br />
0<br />
Total CO 2 Emissions CO 2 Emissions By Type (2010) CO 2 per GDP & capita<br />
6.4 6.6 6.6<br />
7.6<br />
8.1 8.3<br />
2000 2002 2004 2006 2008 2010<br />
Source: <strong>Clean</strong> <strong>Air</strong> <strong>Asia</strong> estimates, <strong>2012</strong> Source: <strong>Clean</strong> <strong>Air</strong> <strong>Asia</strong> estimates, <strong>2012</strong><br />
Source: <strong>Clean</strong> <strong>Air</strong> <strong>Asia</strong> estimates, <strong>2012</strong><br />
ROAD TRANSPORT: DRIVERS OF EMISSIONS<br />
vehicles (millions)<br />
1<br />
0.8<br />
0.6<br />
0.4<br />
0.2<br />
0<br />
31%<br />
14%<br />
11%<br />
Vehicle Population and Motorization Index Fuel Consumption<br />
Vehicle Population<br />
Motorization Index<br />
2000 2002 2004 2006 2008 2010<br />
100%<br />
80%<br />
60%<br />
40%<br />
20%<br />
0%<br />
Source: <strong>Clean</strong> <strong>Air</strong> <strong>Asia</strong> estimates, <strong>2012</strong><br />
VKT by Mode (2002-2010)<br />
2000 2010<br />
Source: <strong>Clean</strong> <strong>Air</strong> <strong>Asia</strong> estimates, <strong>2012</strong><br />
190<br />
185<br />
180<br />
175<br />
170<br />
165<br />
160<br />
2W<br />
3W<br />
PC<br />
MUV<br />
Bus<br />
LCV<br />
HCV<br />
1%<br />
vehicles per 1000<br />
people<br />
38%<br />
5%<br />
ktoe<br />
2W<br />
3W<br />
PC<br />
3000<br />
2500<br />
2000<br />
1500<br />
1000<br />
MUV<br />
BUS<br />
LCV<br />
HCV<br />
500<br />
0<br />
tonsCO 2 per capita<br />
1.75<br />
1.70<br />
1.65<br />
1.60<br />
1.55<br />
1.50<br />
2000 2004 2008<br />
CO2 emissions per capita<br />
CO2 emissions per GDP<br />
2000 2002 2004 2006 2008 2010<br />
Source: <strong>Clean</strong> <strong>Air</strong> <strong>Asia</strong> estimates, <strong>2012</strong><br />
0.08<br />
0.07<br />
0.06<br />
0.05<br />
0.04<br />
0.03<br />
0.02<br />
0.01<br />
0.00<br />
Gasoline<br />
Diesel<br />
LPG<br />
CNG<br />
Electric<br />
Emission Standards for New Light-Duty Vehicles<br />
Gasoline Diesel<br />
Euro 2 Euro 4<br />
Since 2001 Since 2006<br />
Current Sulfur levels in Diesel (ppm)<br />
Since 2006 50<br />
Source: <strong>Clean</strong> <strong>Air</strong> <strong>Asia</strong>.<br />
Emissions Profile: Singapore<br />
<strong>Clean</strong> <strong>Air</strong> <strong>Asia</strong>. <strong>2012</strong>. Emissions Profile: S. Pasig City. Philippines.<br />
The Emissions Profile accompanies <strong>Accessing</strong> <strong>Asia</strong>: <strong>Air</strong> Pollution and Greenhouse Gas Emissions Indicators from Road Transport and Electricity.”<strong>Accessing</strong><strong>Asia</strong> presents the first<br />
benchmark of air pollutant (as particulate matter, PM) and GHG (as CO2) emissions for 13 countries across <strong>Asia</strong> for road transport and electricity.<br />
KgCO2 per US dollar at<br />
constant 2000 prices