Accessing Asia 2012 - Clean Air Initiative
Accessing Asia 2012 - Clean Air Initiative
Accessing Asia 2012 - Clean Air Initiative

Create successful ePaper yourself
Turn your PDF publications into a flip-book with our unique Google optimized e-Paper software.
million tons<br />
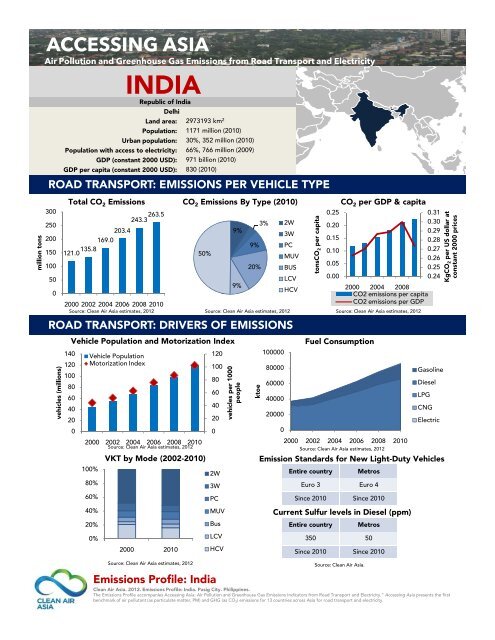
ACCESSING ASIA<br />
<strong>Air</strong> Pollution and Greenhouse Gas Emissions from Road Transport and Electricity<br />
INDIA<br />
Republic of India<br />
Delhi<br />
Land area: 2973193 km 2<br />
Population: 1171 million (2010)<br />
Urban population: 30%, 352 million (2010)<br />
Population with access to electricity: 66%, 766 million (2009)<br />
GDP (constant 2000 USD): 971 billion (2010)<br />
GDP per capita (constant 2000 USD): 830 (2010)<br />
ROAD TRANSPORT: EMISSIONS PER VEHICLE TYPE<br />
300<br />
250<br />
200<br />
150<br />
100<br />
50<br />
0<br />
Total CO 2 Emissions CO 2 Emissions By Type (2010) CO 2 per GDP & capita<br />
121.0 135.8<br />
203.4<br />
169.0<br />
243.3 263.5<br />
2000 2002 2004 2006 2008 2010<br />
Source: <strong>Clean</strong> <strong>Air</strong> <strong>Asia</strong> estimates, <strong>2012</strong> Source: <strong>Clean</strong> <strong>Air</strong> <strong>Asia</strong> estimates, <strong>2012</strong><br />
Source: <strong>Clean</strong> <strong>Air</strong> <strong>Asia</strong> estimates, <strong>2012</strong><br />
ROAD TRANSPORT: DRIVERS OF EMISSIONS<br />
vehicles (millions)<br />
140<br />
120<br />
100<br />
50%<br />
Vehicle Population and Motorization Index Fuel Consumption<br />
80<br />
60<br />
40<br />
20<br />
0<br />
Vehicle Population<br />
Motorization Index<br />
2000 2002 2004 2006 2008 2010<br />
100%<br />
80%<br />
60%<br />
40%<br />
20%<br />
0%<br />
Source: <strong>Clean</strong> <strong>Air</strong> <strong>Asia</strong> estimates, <strong>2012</strong><br />
VKT by Mode (2002-2010)<br />
2000 2010<br />
Source: <strong>Clean</strong> <strong>Air</strong> <strong>Asia</strong> estimates, <strong>2012</strong><br />
120<br />
100<br />
80<br />
60<br />
40<br />
20<br />
0<br />
2W<br />
3W<br />
PC<br />
MUV<br />
Bus<br />
LCV<br />
HCV<br />
9%<br />
9%<br />
vehicles per 1000<br />
people<br />
9%<br />
20%<br />
ktoe<br />
3%<br />
100000<br />
80000<br />
60000<br />
40000<br />
20000<br />
2W<br />
3W<br />
PC<br />
MUV<br />
BUS<br />
LCV<br />
HCV<br />
tonsCO 2 per capita<br />
0.25<br />
0.20<br />
0.15<br />
0.10<br />
0.05<br />
0.00<br />
2000 2004 2008<br />
CO2 emissions per capita<br />
CO2 emissions per GDP<br />
Emissions Profile: India<br />
<strong>Clean</strong> <strong>Air</strong> <strong>Asia</strong>. <strong>2012</strong>. Emissions Profile: India. Pasig City. Philippines.<br />
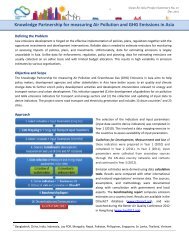
The Emissions Profile accompanies <strong>Accessing</strong> <strong>Asia</strong>: <strong>Air</strong> Pollution and Greenhouse Gas Emissions Indicators from Road Transport and Electricity.”<strong>Accessing</strong><strong>Asia</strong> presents the first<br />
benchmark of air pollutant (as particulate matter, PM) and GHG (as CO2) emissions for 13 countries across <strong>Asia</strong> for road transport and electricity.<br />
0<br />
2000 2002 2004 2006 2008 2010<br />
Source: <strong>Clean</strong> <strong>Air</strong> <strong>Asia</strong> estimates, <strong>2012</strong><br />
0.31<br />
0.30<br />
0.29<br />
0.28<br />
0.27<br />
0.26<br />
0.25<br />
0.24<br />
Gasoline<br />
Diesel<br />
LPG<br />
CNG<br />
Electric<br />
Emission Standards for New Light-Duty Vehicles<br />
Entire country Metros<br />
Euro 3 Euro 4<br />
Since 2010 Since 2010<br />
Current Sulfur levels in Diesel (ppm)<br />
Entire country Metros<br />
350 50<br />
Since 2010 Since 2010<br />
Source: <strong>Clean</strong> <strong>Air</strong> <strong>Asia</strong>.<br />
KgCO2 per US dollar at<br />
constant 2000 prices