Accessing Asia 2012 - Clean Air Initiative
Accessing Asia 2012 - Clean Air Initiative
Accessing Asia 2012 - Clean Air Initiative

Create successful ePaper yourself
Turn your PDF publications into a flip-book with our unique Google optimized e-Paper software.
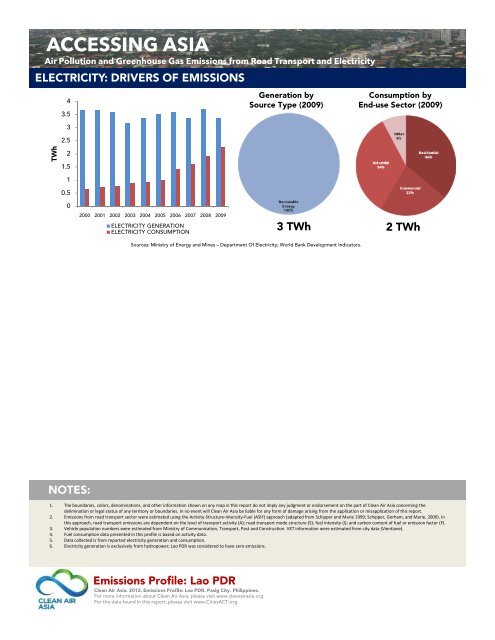
ACCESSING ASIA<br />
<strong>Air</strong> Pollution and Greenhouse Gas Emissions from Road Transport and Electricity<br />
ELECTRICITY: DRIVERS OF EMISSIONS<br />
TWh<br />
4<br />
3.5<br />
3<br />
2.5<br />
2<br />
1.5<br />
1<br />
0.5<br />
0<br />
NOTES:<br />
2000 2001 2002 2003 2004 2005 2006 2007 2008 2009<br />
ELECTRICITY GENERATION<br />
ELECTRICITY CONSUMPTION<br />
Generation by<br />
Source Type (2009)<br />
NatGas<br />
NatGas Other<br />
Other Coal<br />
Coal Oil<br />
Oil<br />
0%<br />
0%<br />
0%<br />
0%<br />
Renewable<br />
Renewable<br />
100%<br />
100%<br />
3 TWh<br />
Sources: Ministry of Energy and Mines – Department Of Electricity; World Bank Development Indicators.<br />
Consumption by<br />
End-use Sector (2009)<br />
Industrial<br />
Industrial<br />
34% 34%<br />
34%<br />
Transport<br />
Transport<br />
0% 0%<br />
0%<br />
Other<br />
Other<br />
8%<br />
8%<br />
Commercia Commercia<br />
Commercia<br />
l<br />
22%<br />
22%<br />
2 TWh<br />
1. The boundaries, colors, denominations, and other information shown on any map in this report do not imply any judgment or endorsement on the part of <strong>Clean</strong> <strong>Air</strong> <strong>Asia</strong> concerning the<br />
delimination or legal status of any territory or boundaries. In no event will <strong>Clean</strong> <strong>Air</strong> <strong>Asia</strong> be liable for any form of damage arising from the application or misapplication of this report.<br />
2. Emissions from road transport sector were estimated using the Activity-Structure-Intensity-Fuel (ASIF) approach (adapted from Schipper and Marie 1999; Schipper, Gorham, and Marie, 2000). In<br />
this approach, road transport emissions are dependent on the level of transport activity (A); road transport mode structure (S); fuel intensity (I); and carbon content of fuel or emission factor (F).<br />
3. Vehicle population numbers were estimated from Ministry of Communication, Transport, Post and Construction. VKT information were estimated from city data (Vientiane).<br />
4. Fuel consumption data presented in this profile is based on activity data.<br />
5. Data collected is from reported electricity generation and consumption.<br />
6. Electricity generation is exclusively from hydropower; Lao PDR was considered to have zero emissions.<br />
Emissions Profile: Lao PDR<br />
<strong>Clean</strong> <strong>Air</strong> <strong>Asia</strong>. <strong>2012</strong>. Emissions Profile: Lao PDR. Pasig City. Philippines.<br />
For more information about <strong>Clean</strong> <strong>Air</strong> <strong>Asia</strong>, please visit www.cleanairasia.org<br />
For the data found in this report, please visit www.CitiesACT.org<br />
Residential<br />
Residential<br />
36%<br />
36%