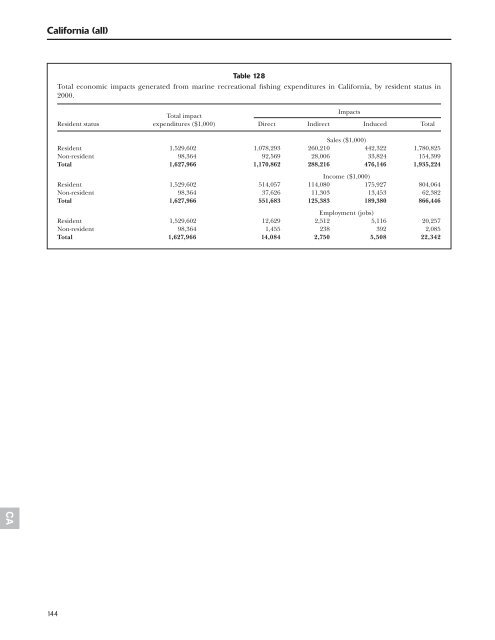
CA California (all) 144 Table 128 Total economic impacts generated from marine recreational fishing expenditures in California, by resident status in 2000. Total impact Impacts Resident status expenditures ($1,000) Direct <strong>In</strong>direct <strong>In</strong>duced Total Sales ($1,000) Resident 1,529,602 1,078,293 260,210 442,322 1,780,825 Non-resident 98,364 92,569 28,006 33,824 154,399 Total 1,627,966 1,170,862 288,216 476,146 1,935,224 <strong>In</strong>come ($1,000) Resident 1,529,602 514,057 114,080 175,927 804,064 Non-resident 98,364 37,626 11,303 13,453 62,382 Total 1,627,966 551,683 125,383 189,380 866,446 Employment (jobs) Resident 1,529,602 12,629 2,512 5,116 20,257 Non-resident 98,364 1,455 238 392 2,085 Total 1,627,966 14,084 2,750 5,508 22,342
Table 129 Total sales/output generated in California from marine recreational fishing in 2000 (all participants). Total impact Impacts ($1,000) Expenditure category expenditures ($1,000) Direct <strong>In</strong>direct <strong>In</strong>duced Total Food Groceries 41,783 27,159 10,204 9,227 46,590 Restaurants 19,662 19,662 7,451 7,282 34,395 Private transportation 82,248 73,060 21,816 17,250 112,126 Lodging 31,573 31,573 9,520 11,554 52,647 Public transportation 41,419 41,419 12,021 17,813 71,253 Boat fuel 32,949 29,269 8,739 6,909 44,917 Party/charter fee 64,079 64,079 20,237 24,164 108,480 Access/boat launching 7,406 7,406 2,339 2,792 12,537 Equipment rental 11,373 11,373 3,592 4,291 19,256 Bait and ice 26,091 8,070 1,309 3,324 12,703 Total trip expenditures 358,583 313,070 97,228 104,606 514,904 Rods and reels 87,379 51,589 9,992 21,532 83,113 Other tackle 61,712 36,435 7,057 15,207 58,699 Gear 14,152 8,355 1,618 3,487 13,460 Camping equipment 7,090 5,643 1,398 2,050 9,091 Binoculars 1,963 1,094 187 453 1,734 Fishing clothing 9,280 5,662 1,597 2,068 9,327 Magazines 3,067 1,581 352 608 2,541 Club dues 2,404 2,404 966 1,086 4,456 License fees 35,296 35,296 3,967 17,141 56,404 Boat accessories 230,663 230,663 100,397 83,708 414,768 Boat purchases 220,285 43,460 7,053 19,707 70,220 Boat maintenance 167,606 167,606 18,838 81,395 267,839 Used boats purchased from dealers 10,190 10,190 1,145 4,948 16,283 New fishing vehicle 218,516 67,689 12,683 27,301 107,673 Fishing vehicle maintenance 155,872 155,872 17,519 75,696 249,087 Used fishing vehicles purchased from dealers 22,360 22,360 2,513 10,859 35,732 Vacation home 11,495 1,839 865 520 3,224 Vacation home maintenance 5,316 5,316 2,008 2,185 9,509 Fees for vehicle loans 1,712 1,712 310 510 2,532 Fees for boat loans 895 895 162 266 1,323 Fees for home loans 4 4 1 1 6 Property taxes for all vacation homes 1,437 1,437 161 698 2,296 Real estate commission 690 690 199 114 1,003 Total equipment and durable expenditures 1,269,383 857,792 190,988 371,540 1,420,320 Total all activity 1,627,966 1,170,862 288,216 476,146 1,935,224 145 CA