US 166 Table 148 Total income generated in the U.S. from marine recreational fishing in 2000 (all modes, all participants). 1 Total impact Impacts ($1,000) Expenditure category expenditures ($1,000) Direct <strong>In</strong>direct <strong>In</strong>duced Total Food Groceries 714,000 197,329 218,505 200,370 616,204 Restaurants 336,000 129,494 80,314 100,724 310,532 Private transportation 623,000 139,735 117,213 122,604 379,552 Lodging 631,000 262,332 118,905 177,226 558,463 Public transportation 109,000 52,987 21,666 35,516 110,169 Boat fuel 416,000 93,306 78,267 81,867 253,440 Party/charter fee 221,000 90,136 44,321 64,135 198,592 Access/boat launching 70,000 28,550 14,038 20,314 62,902 Equipment rental 54,000 22,024 10,830 15,671 48,525 Bait and ice 2 372,000 87,178 20,288 51,814 159,280 Total trip expenditures 3,546,000 1,103,071 724,347 870,241 2,697,659 Rods and reels 3 900,000 340,402 148,558 237,283 726,243 Other tackle and gear 3,4 542,000 204,998 89,465 142,897 437,360 Camping equipment 166,000 59,238 30,632 43,482 133,352 Binoculars 72,000 22,579 5,981 13,949 42,509 Fishing clothing 199,000 58,819 30,588 43,654 133,061 Processing/taxidermy 5 44,000 15,169 9,995 10,941 36,105 Magazines 59,000 23,435 14,025 18,003 55,463 Club dues 87,000 41,981 21,200 30,157 93,338 License fees 6 224,000 133,708 26,948 77,231 237,887 Boat purchases 7 2,194,585 748,342 467,780 591,782 1,807,904 Boat maintenance/expenses 3,235,000 1,931,001 389,180 1,115,363 3,435,544 Used boats purchased from dealers 107,506 64,171 12,933 37,066 114,170 Non-power boat purchases 5 109,000 10,589 6,619 8,374 25,582 Electronics 5 226,000 77,065 48,172 60,942 186,179 New fishing vehicle 1,682,441 411,775 358,696 374,856 1,145,327 Fishing vehicle maintenance 8 208,000 124,157 25,023 71,714 220,894 Used fishing vehicles purchased from dealers 186,891 111,557 22,484 64,436 198,477 Vacation home 645,000 20,607 42,790 30,398 93,795 Vacation home maintenance 8 26,000 10,967 7,995 9,051 28,013 Fees for vehicle loans 13,726 4,557 1,950 3,054 9,561 Fees for boat loans 11,874 3,942 1,687 2,642 8,271 Fees for home loans 282 94 40 63 197 Property taxes for all vacation homes 80,625 48,126 9,699 27,798 85,623 Real estate commission 38,700 4,752 6,633 5,403 16,788 Total equipment and durable expenditures 11,058,629 4,472,031 1,779,073 3,020,539 9,271,643 Total all activity 14,604,629 5,575,102 2,503,420 3,890,780 11,969,302 1 Southeast party boat mode expenditures are not included, as data for this mode is collected in a separate survey. 2 Because bait and ice expenditures were reported in separate categories in the Northeast and Southeast, they were combined to conform with the single category reported on the Pacific Coast. 3 Pacific Coast non-resident expenditures are not included in this total because the Pacific Coast survey did not collect information regarding the amount of these goods purchased in the state of intercept. 4 <strong>The</strong> Pacific Coast survey included an additional category called “Gear” that was a subset of the items included in “Other tackle” in the Northeast and Southeast surveys. <strong>The</strong>refore, “Gear” and “Other tackle” categories were summed to the Pacific Coast. 5 <strong>The</strong>se expenditure categories were not collected on the Pacific Coast. 6 License fee expenditures were not collected in the Northeast survey. 7 <strong>The</strong> Pacific Coast survey included an additional category called “Boat accessories” that was a subset of the items included in “Power Boat purchases” in the Northeast and Southeast surveys. <strong>The</strong>refore, these categories were summed for the Pacific Coast. 8 Both of these maintenance categories were only collected on the Pacific Coast.
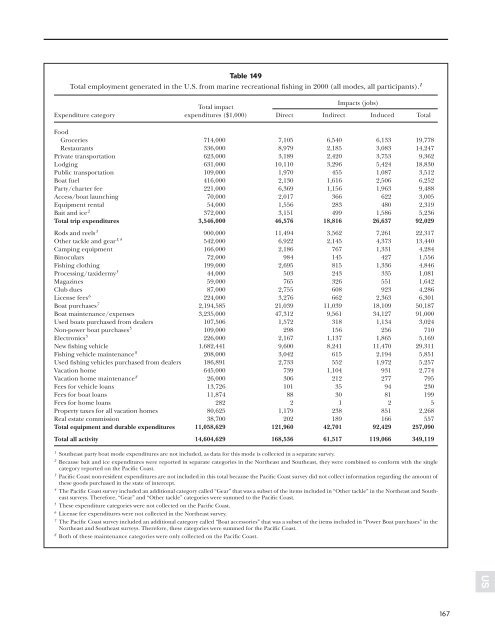
Table 149 Total employment generated in the U.S. from marine recreational fishing in 2000 (all modes, all participants). 1 Total impact Impacts (jobs) Expenditure category expenditures ($1,000) Direct <strong>In</strong>direct <strong>In</strong>duced Total Food Groceries 714,000 7,105 6,540 6,133 19,778 Restaurants 336,000 8,979 2,185 3,083 14,247 Private transportation 623,000 3,189 2,420 3,753 9,362 Lodging 631,000 10,110 3,296 5,424 18,830 Public transportation 109,000 1,970 455 1,087 3,512 Boat fuel 416,000 2,130 1,616 2,506 6,252 Party/charter fee 221,000 6,369 1,156 1,963 9,488 Access/boat launching 70,000 2,017 366 622 3,005 Equipment rental 54,000 1,556 283 480 2,319 Bait and ice 2 372,000 3,151 499 1,586 5,236 Total trip expenditures 3,546,000 46,576 18,816 26,637 92,029 Rods and reels 3 900,000 11,494 3,562 7,261 22,317 Other tackle and gear 3,4 542,000 6,922 2,145 4,373 13,440 Camping equipment 166,000 2,186 767 1,331 4,284 Binoculars 72,000 984 145 427 1,556 Fishing clothing 199,000 2,695 815 1,336 4,846 Processing/taxidermy 5 44,000 503 243 335 1,081 Magazines 59,000 765 326 551 1,642 Club dues 87,000 2,755 608 923 4,286 License fees 6 224,000 3,276 662 2,363 6,301 Boat purchases 7 2,194,585 21,039 11,039 18,109 50,187 Boat maintenance/expenses 3,235,000 47,312 9,561 34,127 91,000 Used boats purchased from dealers 107,506 1,572 318 1,134 3,024 Non-power boat purchases 5 109,000 298 156 256 710 Electronics 5 226,000 2,167 1,137 1,865 5,169 New fishing vehicle 1,682,441 9,600 8,241 11,470 29,311 Fishing vehicle maintenance 8 208,000 3,042 615 2,194 5,851 Used fishing vehicles purchased from dealers 186,891 2,733 552 1,972 5,257 Vacation home 645,000 739 1,104 931 2,774 Vacation home maintenance 8 26,000 306 212 277 795 Fees for vehicle loans 13,726 101 35 94 230 Fees for boat loans 11,874 88 30 81 199 Fees for home loans 282 2 1 2 5 Property taxes for all vacation homes 80,625 1,179 238 851 2,268 Real estate commission 38,700 202 189 166 557 Total equipment and durable expenditures 11,058,629 121,960 42,701 92,429 257,090 Total all activity 14,604,629 168,536 61,517 119,066 349,119 1 Southeast party boat mode expenditures are not included, as data for this mode is collected in a separate survey. 2 Because bait and ice expenditures were reported in separate categories in the Northeast and Southeast, they were combined to conform with the single category reported on the Pacific Coast. 3 Pacific Coast non-resident expenditures are not included in this total because the Pacific Coast survey did not collect information regarding the amount of these goods purchased in the state of intercept. 4 <strong>The</strong> Pacific Coast survey included an additional category called “Gear” that was a subset of the items included in “Other tackle” in the Northeast and Southeast surveys. <strong>The</strong>refore, “Gear” and “Other tackle” categories were summed to the Pacific Coast. 5 <strong>The</strong>se expenditure categories were not collected on the Pacific Coast. 6 License fee expenditures were not collected in the Northeast survey. 7 <strong>The</strong> Pacific Coast survey included an additional category called “Boat accessories” that was a subset of the items included in “Power Boat purchases” in the Northeast and Southeast surveys. <strong>The</strong>refore, these categories were summed for the Pacific Coast. 8 Both of these maintenance categories were only collected on the Pacific Coast. 167 US
- Page 1 and 2:
U.S. Department of Commerce January
- Page 3 and 4:
NOAA Professional Paper NMFS 2 The
- Page 5 and 6:
CONTENTS List of Tables . . . . . .
- Page 7 and 8:
LIST OF TABLES (continued) Table 21
- Page 9 and 10:
LIST OF TABLES (continued) Table 61
- Page 11 and 12:
LIST OF TABLES (continued) Table 10
- Page 13:
LIST OF TABLES (continued) Table 13
- Page 16 and 17:
normal course of household consumpt
- Page 18 and 19:
information on the types of camping
- Page 20 and 21:
services purchased in South Carolin
- Page 22 and 23:
ing NE states, however, there are v
- Page 24 and 25:
For the same reason, summation of i
- Page 26 and 27:
12 Table 1 Angler expenditure categ
- Page 28 and 29:
CT Connecticut 14 Table 2 Total eco
- Page 30 and 31:
CT 16 Table 4 Total income generate
- Page 32 and 33:
CT 18 Table 6 Total economic impact
- Page 34 and 35:
DE Delaware 20 Table 8 Total econom
- Page 36 and 37:
DE 22 Table 10 Total income generat
- Page 38 and 39:
DE 24 Table 12 Total economic impac
- Page 40 and 41:
ME Maine 26 Table 14 Total economic
- Page 42 and 43:
ME 28 Table 16 Total income generat
- Page 44 and 45:
ME 30 Table 18 Total economic impac
- Page 46 and 47:
MD Maryland 32 Table 20 Total econo
- Page 48 and 49:
MD 34 Table 22 Total income generat
- Page 50 and 51:
MD 36 Table 24 Total economic impac
- Page 52 and 53:
MA Massachusetts 38 Table 26 Total
- Page 54 and 55:
MA 40 Table 28 Total income generat
- Page 56 and 57:
MA 42 Table 30 Total economic impac
- Page 58 and 59:
NH New Hampshire 44 Table 32 Total
- Page 60 and 61:
NH 46 Table 34 Total income generat
- Page 62 and 63:
NH 48 Table 36 Total economic impac
- Page 64 and 65:
NJ New Jersey 50 Table 38 Total eco
- Page 66 and 67:
NJ 52 Table 40 Total income generat
- Page 68 and 69:
NJ 54 Table 42 Total economic impac
- Page 70 and 71:
NY New York 56 Table 44 Total econo
- Page 72 and 73:
NY 58 Table 46 Total income generat
- Page 74 and 75:
NY 60 Table 48 Total economic impac
- Page 76 and 77:
RI Rhode Island 62 Table 50 Total e
- Page 78 and 79:
RI 64 Table 52 Total income generat
- Page 80 and 81:
RI 66 Table 54 Total economic impac
- Page 82 and 83:
VA Virginia 68 Table 56 Total econo
- Page 84 and 85:
VA 70 Table 58 Total income generat
- Page 86 and 87:
VA 72 Table 60 Total economic impac
- Page 89 and 90:
SOUTHEAST REGION TABLES Alabama Eas
- Page 91 and 92:
Table 63 Total sales/output generat
- Page 93 and 94:
Table 65 Total employment generated
- Page 95 and 96:
Table 67 Federal and state tax impa
- Page 97 and 98:
Table 69 Total sales/output generat
- Page 99 and 100:
Table 71 Total employment generated
- Page 101 and 102:
Table 73 Federal and state tax impa
- Page 103 and 104:
Table 75 Total sales/output generat
- Page 105 and 106:
Table 77 Total employment generated
- Page 107 and 108:
Table 79 Federal and state tax impa
- Page 109 and 110:
Table 81 Total sales/output generat
- Page 111 and 112:
Table 83 Total employment generated
- Page 113 and 114:
Table 85 Federal and state tax impa
- Page 115 and 116:
Table 87 Total sales/output generat
- Page 117 and 118:
Table 89 Total employment generated
- Page 119 and 120:
Table 91 Federal and state tax impa
- Page 121 and 122:
Table 93 Total sales/output generat
- Page 123 and 124:
Table 95 Total employment generated
- Page 125 and 126:
Table 97 Federal and state tax impa
- Page 127 and 128:
Table 99 Total sales/output generat
- Page 129 and 130: Table 101 Total employment generate
- Page 131 and 132: Table 103 Federal and state tax imp
- Page 133 and 134: Table 105 Total sales/output genera
- Page 135 and 136: Table 107 Total employment generate
- Page 137 and 138: Table 109 Federal and state tax imp
- Page 139 and 140: Table 111 Total sales/output genera
- Page 141 and 142: Table 113 Total employment generate
- Page 143: Table 115 Federal and state tax imp
- Page 146 and 147: SCA Southern California 132 Table 1
- Page 148 and 149: SCA 134 Table 118 Total income gene
- Page 150 and 151: SCA 136 Table 120 Total economic im
- Page 152 and 153: NCA Northern California 138 Table 1
- Page 154 and 155: NCA 140 Table 124 Total income gene
- Page 156 and 157: NCA 142 Table 126 Total economic im
- Page 158 and 159: CA California (all) 144 Table 128 T
- Page 160 and 161: CA 146 Table 130 Total income gener
- Page 162 and 163: CA 148 Table 132 Total economic imp
- Page 164 and 165: OR Oregon 150 Table 134 Total econo
- Page 166 and 167: OR 152 Table 136 Total income gener
- Page 168 and 169: OR 154 Table 138 Total economic imp
- Page 170 and 171: WA Washington 156 Table 140 Total e
- Page 172 and 173: WA 158 Table 142 Total income gener
- Page 174 and 175: WA 160 Table 144 Total economic imp
- Page 177 and 178: U.S. TABLES United States CT DE ME
- Page 179: Table 147 Total sales/output genera
- Page 183 and 184: Table 151 Federal and state tax imp