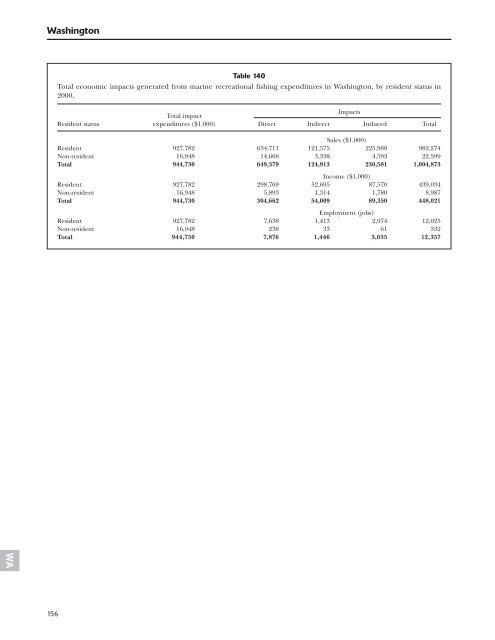
WA Washington 156 Table 140 Total economic impacts generated from marine recreational fishing expenditures in Washington, by resident status in 2000. Total impact Impacts Resident status expenditures ($1,000) Direct <strong>In</strong>direct <strong>In</strong>duced Total Sales ($1,000) Resident 927,782 634,711 121,575 225,988 982,274 Non-resident 16,948 14,668 3,338 4,593 22,599 Total 944,730 649,379 124,913 230,581 1,004,873 <strong>In</strong>come ($1,000) Resident 927,782 298,769 52,695 87,570 439,034 Non-resident 16,948 5,893 1,314 1,780 8,987 Total 944,730 304,662 54,009 89,350 448,021 Employment (jobs) Resident 927,782 7,638 1,413 2,974 12,025 Non-resident 16,948 238 33 61 332 Total 944,730 7,876 1,446 3,035 12,357
Table 141 Total sales/output generated in Washington from marine recreational fishing in 2000 (all participants). Total impact Impacts ($1,000) Expenditure category expenditures ($1,000) Direct <strong>In</strong>direct <strong>In</strong>duced Total Food Groceries 10,424 6,309 2,174 1,884 10,367 Restaurants 4,905 4,905 1,696 1,553 8,154 Private transportation 41,039 30,122 5,152 6,203 41,477 Lodging 6,751 6,751 1,791 2,166 10,708 Public transportation 7,863 7,863 1,820 2,914 12,597 Boat fuel 11,792 8,658 1,482 1,782 11,922 Party/charter fee 2,834 2,834 763 929 4,526 Access/boat launching 3,203 3,203 862 1,050 5,115 Equipment rental 1,480 1,480 399 486 2,365 Bait and ice 4,435 1,365 184 499 2,048 Total trip expenditures 94,726 73,490 16,323 19,466 109,279 Rods and reels 40,768 24,861 4,161 9,098 38,120 Other tackle 41,141 25,088 4,199 9,181 38,468 Gear 9,610 5,861 981 2,145 8,987 Camping equipment 6,710 5,472 1,156 1,744 8,372 Binoculars 1,581 1,067 195 380 1,642 Fishing clothing 6,597 3,628 702 1,188 5,518 Magazines 1,201 571 104 195 870 Club dues 768 768 288 298 1,354 License fees 24,574 24,574 2,569 10,704 37,847 Boat accessories 118,836 118,836 39,536 30,757 189,129 Boat purchases 86,733 18,180 2,744 7,199 28,123 Boat maintenance 114,332 114,332 11,952 49,801 176,085 Used boats purchased from dealers 4,012 4,012 419 1,748 6,179 New fishing vehicle 169,616 59,557 10,670 19,856 90,083 Fishing vehicle maintenance 100,661 100,661 10,523 43,846 155,030 Used fishing vehicles purchased from dealers 17,356 17,356 1,814 7,560 26,730 Vacation home 77,775 23,332 10,041 5,777 39,150 Vacation home maintenance 11,858 11,858 4,055 4,373 20,286 Fees for vehicle loans 1,153 1,153 162 280 1,595 Fees for boat loans 308 308 43 75 426 Fees for home loans 25 25 4 6 35 Property taxes for all vacation homes 9,722 9,722 1,016 4,235 14,973 Real estate commission 4,667 4,667 1,256 669 6,592 Total equipment and durable expenditures 850,004 575,889 108,590 211,115 895,594 Total all activity 944,730 649,379 124,913 230,581 1,004,873 157 WA