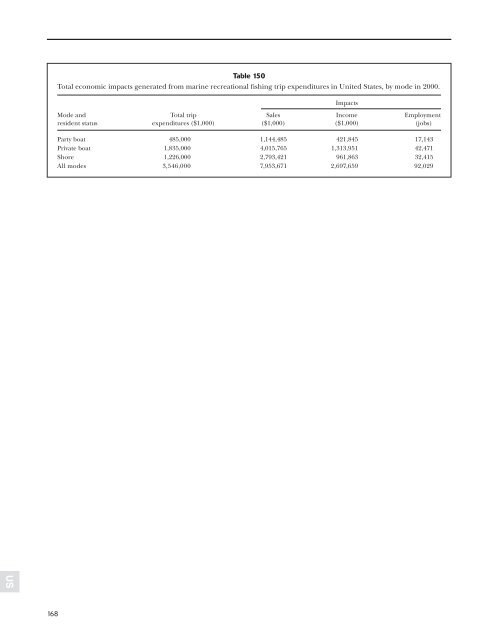
US 168 Table 150 Total economic impacts generated from marine recreational fishing trip expenditures in United States, by mode in 2000. Impacts Mode and Total trip Sales <strong>In</strong>come Employment resident status expenditures ($1,000) ($1,000) ($1,000) (jobs) Party boat 485,000 1,144,485 421,845 17,143 Private boat 1,835,000 4,015,765 1,313,951 42,471 Shore 1,226,000 2,793,421 961,863 32,415 All modes 3,546,000 7,953,671 2,697,659 92,029
Table 151 Federal and state tax impacts generated from marine recreational fishing in United States in 2000 (all modes, all participants); in dollars. Employee Proprietary Household Enterprise <strong>In</strong>direct compensation income expenditures (corporations) business taxes Total Enterprise Transfers 4,307,409 4,307,409 (corporations) Total 4,307,409 0 0 0 0 4,307,409 Federal government non-defense Corporate Profits Tax 400,063,929 400,063,929 <strong>In</strong>direct Bus Tax: Custom Duty 45,647,194 45,647,194 <strong>In</strong>direct Bus Tax: Excise Taxes 143,229,716 143,229,716 <strong>In</strong>direct Bus Tax: Fed NonTaxes 35,865,653 35,865,653 Personal Tax: Estate and Gift Tax 0 Personal Tax: <strong>In</strong>come Tax 1,176,433,732 1,176,433,732 Personal Tax: NonTaxes (Fines-Fees) 12,084,202 12,084,202 Social <strong>In</strong>s Tax: Employee Contribution 589,128,951 52,897,296 642,026,247 Social <strong>In</strong>s Tax: Employer Contribution 617,983,399 617,983,399 Total 1,207,112,350 52,897,296 1,188,517,934 400,063,929 224,742,563 3,073,334,072 State/local govt non-education Corporate Profits Tax 67,027,417 67,027,417 Dividends 763,845 763,845 <strong>In</strong>direct Bus Tax: Motor Vehicle Lic 11,877,586 11,877,586 <strong>In</strong>direct Bus Tax: Other Taxes 69,169,473 69,169,473 <strong>In</strong>direct Bus Tax: Property Tax 533,792,699 533,792,699 <strong>In</strong>direct Bus Tax: S/L NonTaxes 71,265,517 71,265,517 <strong>In</strong>direct Bus Tax: Sales Tax 663,514,573 663,514,573 Personal Tax: Estate and Gift Tax 0 Personal Tax: <strong>In</strong>come Tax 257,954,722 257,954,722 Personal Tax: Motor Vehicle License 16,228,004 16,228,004 Personal Tax: NonTaxes (Fines-Fees) 45,156,192 45,156,192 Personal Tax: Other Tax (Fish/Hunt) 3,951,170 3,951,170 Personal Tax: Property Taxes 6,150,782 6,150,782 Social <strong>In</strong>s Tax: Employee Contribution 3,736,547 3,736,547 Social <strong>In</strong>s Tax: Employer Contribution 17,022,049 17,022,049 Total 20,758,596 0 329,440,870 67,791,262 1,349,619,848 1,767,610,576 Total 1,232,178,355 52,897,296 1,517,958,804 467,855,191 1,574,362,411 4,845,252,057 169 US
- Page 1 and 2:
U.S. Department of Commerce January
- Page 3 and 4:
NOAA Professional Paper NMFS 2 The
- Page 5 and 6:
CONTENTS List of Tables . . . . . .
- Page 7 and 8:
LIST OF TABLES (continued) Table 21
- Page 9 and 10:
LIST OF TABLES (continued) Table 61
- Page 11 and 12:
LIST OF TABLES (continued) Table 10
- Page 13:
LIST OF TABLES (continued) Table 13
- Page 16 and 17:
normal course of household consumpt
- Page 18 and 19:
information on the types of camping
- Page 20 and 21:
services purchased in South Carolin
- Page 22 and 23:
ing NE states, however, there are v
- Page 24 and 25:
For the same reason, summation of i
- Page 26 and 27:
12 Table 1 Angler expenditure categ
- Page 28 and 29:
CT Connecticut 14 Table 2 Total eco
- Page 30 and 31:
CT 16 Table 4 Total income generate
- Page 32 and 33:
CT 18 Table 6 Total economic impact
- Page 34 and 35:
DE Delaware 20 Table 8 Total econom
- Page 36 and 37:
DE 22 Table 10 Total income generat
- Page 38 and 39:
DE 24 Table 12 Total economic impac
- Page 40 and 41:
ME Maine 26 Table 14 Total economic
- Page 42 and 43:
ME 28 Table 16 Total income generat
- Page 44 and 45:
ME 30 Table 18 Total economic impac
- Page 46 and 47:
MD Maryland 32 Table 20 Total econo
- Page 48 and 49:
MD 34 Table 22 Total income generat
- Page 50 and 51:
MD 36 Table 24 Total economic impac
- Page 52 and 53:
MA Massachusetts 38 Table 26 Total
- Page 54 and 55:
MA 40 Table 28 Total income generat
- Page 56 and 57:
MA 42 Table 30 Total economic impac
- Page 58 and 59:
NH New Hampshire 44 Table 32 Total
- Page 60 and 61:
NH 46 Table 34 Total income generat
- Page 62 and 63:
NH 48 Table 36 Total economic impac
- Page 64 and 65:
NJ New Jersey 50 Table 38 Total eco
- Page 66 and 67:
NJ 52 Table 40 Total income generat
- Page 68 and 69:
NJ 54 Table 42 Total economic impac
- Page 70 and 71:
NY New York 56 Table 44 Total econo
- Page 72 and 73:
NY 58 Table 46 Total income generat
- Page 74 and 75:
NY 60 Table 48 Total economic impac
- Page 76 and 77:
RI Rhode Island 62 Table 50 Total e
- Page 78 and 79:
RI 64 Table 52 Total income generat
- Page 80 and 81:
RI 66 Table 54 Total economic impac
- Page 82 and 83:
VA Virginia 68 Table 56 Total econo
- Page 84 and 85:
VA 70 Table 58 Total income generat
- Page 86 and 87:
VA 72 Table 60 Total economic impac
- Page 89 and 90:
SOUTHEAST REGION TABLES Alabama Eas
- Page 91 and 92:
Table 63 Total sales/output generat
- Page 93 and 94:
Table 65 Total employment generated
- Page 95 and 96:
Table 67 Federal and state tax impa
- Page 97 and 98:
Table 69 Total sales/output generat
- Page 99 and 100:
Table 71 Total employment generated
- Page 101 and 102:
Table 73 Federal and state tax impa
- Page 103 and 104:
Table 75 Total sales/output generat
- Page 105 and 106:
Table 77 Total employment generated
- Page 107 and 108:
Table 79 Federal and state tax impa
- Page 109 and 110:
Table 81 Total sales/output generat
- Page 111 and 112:
Table 83 Total employment generated
- Page 113 and 114:
Table 85 Federal and state tax impa
- Page 115 and 116:
Table 87 Total sales/output generat
- Page 117 and 118:
Table 89 Total employment generated
- Page 119 and 120:
Table 91 Federal and state tax impa
- Page 121 and 122:
Table 93 Total sales/output generat
- Page 123 and 124:
Table 95 Total employment generated
- Page 125 and 126:
Table 97 Federal and state tax impa
- Page 127 and 128:
Table 99 Total sales/output generat
- Page 129 and 130:
Table 101 Total employment generate
- Page 131 and 132: Table 103 Federal and state tax imp
- Page 133 and 134: Table 105 Total sales/output genera
- Page 135 and 136: Table 107 Total employment generate
- Page 137 and 138: Table 109 Federal and state tax imp
- Page 139 and 140: Table 111 Total sales/output genera
- Page 141 and 142: Table 113 Total employment generate
- Page 143: Table 115 Federal and state tax imp
- Page 146 and 147: SCA Southern California 132 Table 1
- Page 148 and 149: SCA 134 Table 118 Total income gene
- Page 150 and 151: SCA 136 Table 120 Total economic im
- Page 152 and 153: NCA Northern California 138 Table 1
- Page 154 and 155: NCA 140 Table 124 Total income gene
- Page 156 and 157: NCA 142 Table 126 Total economic im
- Page 158 and 159: CA California (all) 144 Table 128 T
- Page 160 and 161: CA 146 Table 130 Total income gener
- Page 162 and 163: CA 148 Table 132 Total economic imp
- Page 164 and 165: OR Oregon 150 Table 134 Total econo
- Page 166 and 167: OR 152 Table 136 Total income gener
- Page 168 and 169: OR 154 Table 138 Total economic imp
- Page 170 and 171: WA Washington 156 Table 140 Total e
- Page 172 and 173: WA 158 Table 142 Total income gener
- Page 174 and 175: WA 160 Table 144 Total economic imp
- Page 177 and 178: U.S. TABLES United States CT DE ME
- Page 179 and 180: Table 147 Total sales/output genera
- Page 181: Table 149 Total employment generate