STAT170 Workshop Notes prepared by Nan Carter for Numeracy ...
STAT170 Workshop Notes prepared by Nan Carter for Numeracy ...
STAT170 Workshop Notes prepared by Nan Carter for Numeracy ...

You also want an ePaper? Increase the reach of your titles
YUMPU automatically turns print PDFs into web optimized ePapers that Google loves.
Week 7 H/Y TESTING HYPOTHESES ABOUT POPULATION MEANS<br />
i. Hypotheses about a population mean, µ, using one random sample of<br />
observations, without value <strong>for</strong> σ .<br />
Without a known value <strong>for</strong> the population standard deviation, σ, the<br />
hypothesis is tested using the standard deviation, s, of the random sample.<br />
For a sample size n, the sample estimate s has (n-1) degrees of freedom. The<br />
test statistic is no longer a z-statistic, but a t-statistic.<br />
Go back to the examples in part (i) on pages 10-11, and in the description<br />
suppose that the given value of σ is the sample estimate, s. Now answer the<br />
questions Q1 to Q12 using these values of s, and the appropriate tdistribution.<br />
ii. One random sample of items, two variables observed on each<br />
item, and we are interested in the difference between the means of the<br />
variables. The two variables are said to be ‘paired’ or ‘matched’ because they<br />
are observed on the same item.<br />
PAIRED t-TEST:<br />
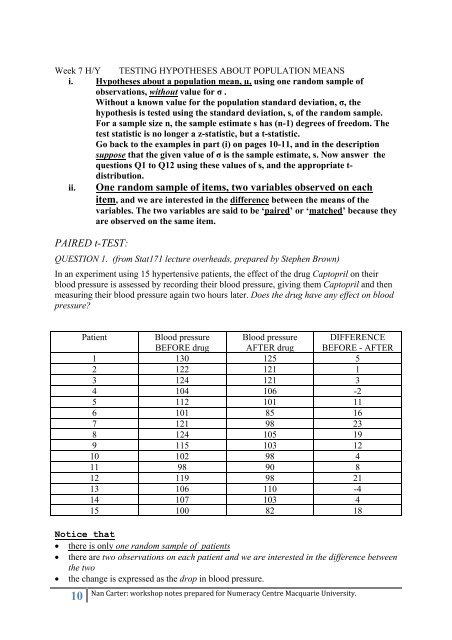
QUESTION 1. (from Stat171 lecture overheads, <strong>prepared</strong> <strong>by</strong> Stephen Brown)<br />
In an experiment using 15 hypertensive patients, the effect of the drug Captopril on their<br />
blood pressure is assessed <strong>by</strong> recording their blood pressure, giving them Captopril and then<br />
measuring their blood pressure again two hours later. Does the drug have any effect on blood<br />
pressure?<br />
10<br />
Patient Blood pressure Blood pressure DIFFERENCE<br />
BEFORE drug AFTER drug BEFORE - AFTER<br />
1 130 125 5<br />
2 122 121 1<br />
3 124 121 3<br />
4 104 106 -2<br />
5 112 101 11<br />
6 101 85 16<br />
7 121 98 23<br />
8 124 105 19<br />
9 115 103 12<br />
10 102 98 4<br />
11 98 90 8<br />
12 119 98 21<br />
13 106 110 -4<br />
14 107 103 4<br />
15 100 82 18<br />
Notice that<br />
• there is only one random sample of patients<br />
• there are two observations on each patient and we are interested in the difference between<br />
the two<br />
• the change is expressed as the drop in blood pressure.<br />
<strong>Nan</strong> <strong>Carter</strong>: workshop notes <strong>prepared</strong> <strong>for</strong> <strong>Numeracy</strong> Centre Macquarie University.