STAT170 Workshop Notes prepared by Nan Carter for Numeracy ...
STAT170 Workshop Notes prepared by Nan Carter for Numeracy ...
STAT170 Workshop Notes prepared by Nan Carter for Numeracy ...
You also want an ePaper? Increase the reach of your titles
YUMPU automatically turns print PDFs into web optimized ePapers that Google loves.
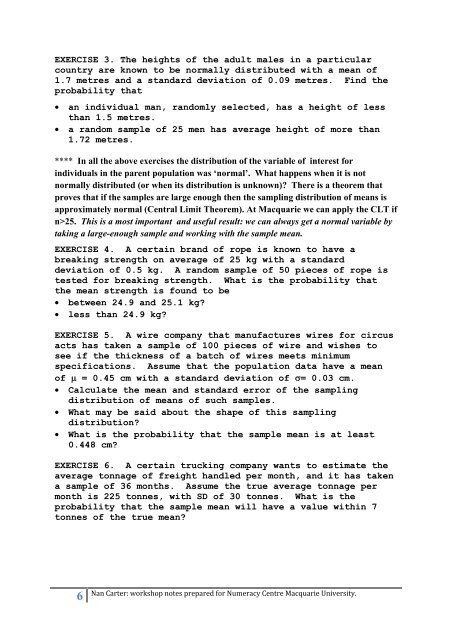
EXERCISE 3. The heights of the adult males in a particular<br />
country are known to be normally distributed with a mean of<br />
1.7 metres and a standard deviation of 0.09 metres. Find the<br />
probability that<br />
• an individual man, randomly selected, has a height of less<br />
than 1.5 metres.<br />
• a random sample of 25 men has average height of more than<br />
1.72 metres.<br />
**** In all the above exercises the distribution of the variable of interest <strong>for</strong><br />
individuals in the parent population was ‘normal’. What happens when it is not<br />
normally distributed (or when its distribution is unknown)? There is a theorem that<br />
proves that if the samples are large enough then the sampling distribution of means is<br />
approximately normal (Central Limit Theorem). At Macquarie we can apply the CLT if<br />
n>25. This is a most important and useful result: we can always get a normal variable <strong>by</strong><br />
taking a large-enough sample and working with the sample mean.<br />
EXERCISE 4. A certain brand of rope is known to have a<br />
breaking strength on average of 25 kg with a standard<br />
deviation of 0.5 kg. A random sample of 50 pieces of rope is<br />
tested <strong>for</strong> breaking strength. What is the probability that<br />
the mean strength is found to be<br />
• between 24.9 and 25.1 kg?<br />
• less than 24.9 kg?<br />
EXERCISE 5. A wire company that manufactures wires <strong>for</strong> circus<br />
acts has taken a sample of 100 pieces of wire and wishes to<br />
see if the thickness of a batch of wires meets minimum<br />
specifications. Assume that the population data have a mean<br />
of μ = 0.45 cm with a standard deviation of σ= 0.03 cm.<br />
• Calculate the mean and standard error of the sampling<br />
distribution of means of such samples.<br />
• What may be said about the shape of this sampling<br />
distribution?<br />
• What is the probability that the sample mean is at least<br />
0.448 cm?<br />
EXERCISE 6. A certain trucking company wants to estimate the<br />
average tonnage of freight handled per month, and it has taken<br />
a sample of 36 months. Assume the true average tonnage per<br />
month is 225 tonnes, with SD of 30 tonnes. What is the<br />
probability that the sample mean will have a value within 7<br />
tonnes of the true mean?<br />
6<br />
<strong>Nan</strong> <strong>Carter</strong>: workshop notes <strong>prepared</strong> <strong>for</strong> <strong>Numeracy</strong> Centre Macquarie University.


