STAT170 Workshop Notes prepared by Nan Carter for Numeracy ...
STAT170 Workshop Notes prepared by Nan Carter for Numeracy ...
STAT170 Workshop Notes prepared by Nan Carter for Numeracy ...

Create successful ePaper yourself
Turn your PDF publications into a flip-book with our unique Google optimized e-Paper software.
Question 2.<br />
The following table gives a sample of advertising<br />
expenditures and associated sales volumes <strong>for</strong> a<br />
company during 10 randomly selected months. We are<br />
interested in being able to predict gross monthly<br />
sales volume from the amount spent on advertising.<br />
(from J. Gosling, Introductory Statistics)<br />
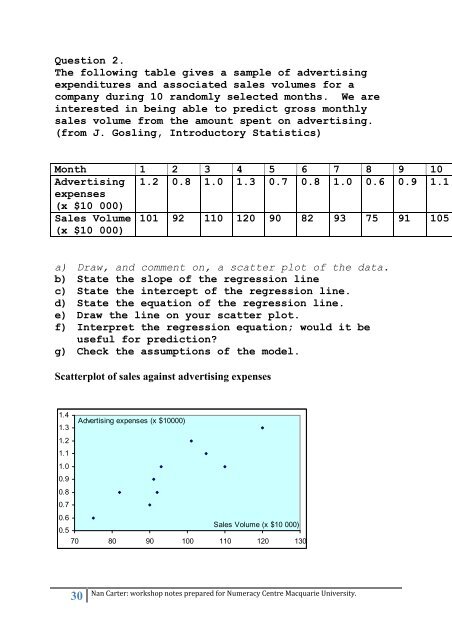
Month 1 2 3 4 5 6 7 8 9 10<br />
Advertising<br />
expenses<br />
(x $10 000)<br />
1.2 0.8 1.0 1.3 0.7 0.8 1.0 0.6 0.9 1.1<br />
Sales Volume 101<br />
(x $10 000)<br />
92 110 120 90 82 93 75 91 105<br />
a) Draw, and comment on, a scatter plot of the data.<br />
b) State the slope of the regression line<br />
c) State the intercept of the regression line.<br />
d) State the equation of the regression line.<br />
e) Draw the line on your scatter plot.<br />
f) Interpret the regression equation; would it be<br />
useful <strong>for</strong> prediction?<br />
g) Check the assumptions of the model.<br />
Scatterplot of sales against advertising expenses<br />
1.4<br />
1.3<br />
1.2<br />
1.1<br />
1.0<br />
0.9<br />
0.8<br />
0.7<br />
0.6<br />
0.5<br />
Advertising expenses (x $10000)<br />
70 80 90 100 110 120 130<br />
30<br />
Sales Volume (x $10 000)<br />
<strong>Nan</strong> <strong>Carter</strong>: workshop notes <strong>prepared</strong> <strong>for</strong> <strong>Numeracy</strong> Centre Macquarie University.